
Determining the Loci of Anomalies Using Minimal Causal Models
Proceedings of the Fourteenth International Joint Conference on Artificial Intelligence. Qualitative Reasoning and Diagnosis. Pages 1821-1828.
© 1995 International Joint Conferences on Artificial Intelligence
Abstract
Any attempt to introduce automation into the monitoring of complex physical systems must start from a robust anomaly detection capability. This task is far from straightforward, for a single definition of what constitutes an anomaly is difficult to come by. In addition, to make the monitoring process efficient, and to avoid the potential for information overload on human operators, attention focusing must also be addressed. When an anomaly occurs, more often than not several sensors are affected, and the partially redundant information they provide can be confusing, particularly in a crisis situation where a response is needed quickly. The focus of this paper is a new technique for attention focusing. The technique involves reasoning about the distance between two frequency distributions, and is used to detect both anomalous system parameters and "broken" causal dependencies. These two forms of information together isolate the locus of anomalous behavior in the system being monitored.
- K. H. Abbott, "Robust Operative Diagnosis as Problem Solving in a Hypothesis Space," 7th National Confer- ence on Artificial Intelligence, St. Paul, Minnesota, Au- gust 1988.
- L. Charest, Jr., N. Rouquette, R. Doyle, C. Robertson, and J. Wyatt, "MESA: An Interactive Modeling and Sim- ulation Environment for Intelligent Systems Automa- tion," Hawaii International Conference on System Sci- ences, Maui, Hawaii, January 1994.
- D. DeCoste, "Dynamic Across-Time Measurement In- terpretation," 8th National Conference on Artificial In- telligence, Boston, Massachusetts, August 1990.
- R. J. Doyle, L. Charest, Jr., N. Rouquette, J. Wyatt, and C. Robertson, "Causal Modeling and Event-driven Sim- ulation for Monitoring of Continuous Systems," Com- puters in Aerospace 9, American Institute of Aeronautics and Astronautics, San Diego, California, October 1993.
- R. J. Doyle, S. A. Chien, U. M. Fayyad, and E. J. Wy- att, "Focused Real-time Systems Monitoring Based on Multiple Anomaly Models," 7th International Workshop on Qualitative Reasoning About Physical Systems, East- sound, Washington, May 1993.
- D. L. Dvorak and B. J. Kuipers, "Model-Based Moni- toring of Dynamic Systems," 11th International Confer- ence on Artificial Intelligence , Detroit, Michigan, Au- gust 1989. IJCAI
- T. Hill, W. Morris, and C. Robert~on, "Implementing a Real-time Reasoning System for Robust Diagnosis," 6th Annual Workshop on Space Operations Applications and Research, Houston, Texas, August 1992.
- J. Muratore, T. Heindel, T. Murphy, A. Rasmussen, and R. McFarland, "Space Shuttle Telemetry Monitoring by Expert Systems in Mission Control," in Innovative Ap- plications of Artificial Intelligence, H. Schorr and A. Rappaport (eds.), AAAI Press, 1989.
- N. F. Rouquette, S. A. Chien, and L. K. Charest, Jr., "Event-driven Simulation in SELMON: An Overview of EDSE," JPL Publication 92-23, August 1992.
- E. A. Searl, J. R. Jamieson, and E. New, "Deriving Fault Location and Control from a Functional Model," 3rd IEEE Symposium on Intelligent Control, Arlington, Vir- ginia, 1988.
References were extracted automatically from the PDF and may contain errors.
Full text extracted automatically from the PDF; figures, tables and equations may differ. The PDF is the version of record.
1 Introduction
Mission Operations personnel at NASA have the task of deter mining, from moment to moment, whether a space platform is exhibiting behavior which is in any way anomalous, which could disrupt the operation of the platform, and in the worst case, could represent a loss of ability to achieve mission goals. Our approach to introducing automation into real-time sys tems monitoring is based on two observations: 1) mission op erators employ multiple methods for recognizing anomalies, and 2) mission operators do not and should not interpret all sensor data all of the time. We seek an approach for determin ing from moment to moment which of the available sensor data is most informative about the presence of anomalies occurring within a system. The work reported here extends the anomaly detection capability in the SELMON monitoring system [4; 5] by adding an attention focusing capability.
Other model-based monitoring systems include Dvorak's MIMIC, which performs robust discrepancy detection for con tinuous dynamic systems [6], and DeCoste's DATMI, which infers system states from incomplete sensor data [3]. This work also complements other work within NASA on empirical and model-based methods for fault diagnosis of aerospace platforms [1; 7; 8; 10].
2 Background: The SELMON Approach
Abnormal behavior is always defined as some kind of depar ture from normal behavior. Unfortunately, there appears to be no single, crisp definition of "normal" behavior. In the tradi tional monitoring technique of limit sensing, normal behavior is predefined by nominal value ranges for sensors. A funda mental limitation of this approach is the lack of sensitivity to context. In the other traditional monitoring technique of discrepancy detection, normal behavior is obtained by simu lating a model of the system being monitored. This approach, while avoiding the insensitivity to context of the limit sens ing approach, has its own limitations. The approach is only as good as the system model. In addition, normal system behavior typically changes with time, and the model must continue to evolve. Given these limitations, it can be difficult to distinguish genuine anomalies from errors in the model.
Noting the limitations of the existing monitoring tech niques, we have developed an approach to monitoring which is designed to make the anomaly detection process more ro bust, to reduce the number of undetected anomalies (false negatives). Towards this end, we introduce multiple anomaly models, each employing a different notion of "normal" be havior.
2.1 Anomaly Detection Methods
In this section, we briefly describe methods that we use to determine when a sensor is reporting anomalous behavior. The first few measures use knowledge about each individual sensor, without knowledge of any relations among sensors.
Surprise. An appealing way to assess whether current be havior IS anomalous or not is via comparison to past behavior. This is the essence of the surprise measure. It is designed to highlight a sensor which behaves other than it has historically. Specifically, surprise uses the historical frequency distribu tion for the sensor in two ways: To determine the likelihood of the given current value of the sensor, and to ex~ine the relative likelihoods of different values of the sensor. It is those sensors which display unlikely values when other values of the sensor are more likely which get a high surprise score. Surprise is not high if the only reason a sensor's value is un likely is that there are many possible values for the sensor, all equally unlikely.
Alarm. Alarm thresholds for sensors, indexed by operating mode, typically are established through an off-line analysis of system design. The notion of alarm in SELMON extends the usual one bit of information (the sensor is in alarm or it is not), and also reports how much of the alarm range has been traversed. Thus a sensor which has gone deep into alarm gets a higher score than one which has just crossed over the alarm threshold.
Alarm Anticipation. The alarm anticipation measure in SELMON performs a simple form of trend analysis to decide whether or not a sensor is expected to be in alarm in the fu ture. A straightforward curve fit is used to project when the sensor will next cross an alarm threshold, in either direction. A high score means the sensor will soon enter alarm or will remain there. A low score means the sensor will remain in the nominal range or emerge from alarm soon.
Value Change. A change in the value of a sensor may be indicative of an anomaly. In order to better assess such an event, the value change measure in SELMON compares a given value change to historical value changes seen on that sensor. The score reported is based on the proportion of previous value changes which were less than the given value change. It is maximum when the given value change is the greatest value change seen to date on that sensor. It is minimum when no value change has occurred in that sensor.
Although many anomalies can be detected by applying anomaly models to the behavior reported at individual sen sors, some can only be detected by reasoning about interac tions occurring in a system and about behavior reported by several sensors.
Deviation. The deviation measure is our extension of the traditional method of discrepancy detection. As in discrep ancy detection, comparisons are made between predicted and actual sensor values, and differences are interpreted to be in dications of anomalies. This raw discrepancy is entered into a normalization process identical to that used for the value change score, and it is this representation of relative discrep ancy which is reported. The deviation score for a sensor is minimum if there is no discrepancy and maximum if the dis crepancy between predicted and actual is the greatest seen to date on that sensor.
Deviation only requires that a simulation be available in any form for generating sensor value predictions. However, the remaining sensitivity and cascading alarms measures require the ability to simulate and reason with a causal model of the system being monitored.
Sensitivity and Cascading Alarms. Sensitivity measures the potential for a large global perturbation to develop from cur rent state. Cascading alarms measures the potential for an alarm sequence to develop from current state. Both of these anomaly measures use an event-driven causal simulator [2; 9] to generate predictions about future states of the system, given current state. Current state is taken to be defined by both the current values of system parameters (not all of which may be sensed) and the pending events already resident on the simulator agenda. The measures assign scores to individual sensors according to how the system parameter corresponding to a sensor participates in, or influences, the predicted global behavior. A sensor will have its highest sensitivity score when behavior originating at that sensor causes all sensors causally downstream to exhibit their maximum value change to date.
A sensor will have its highest cascading alarms score when behavior originating at that sensor causes all sensors causally downstream to go into an alarm state.
2.2 Previous Results
In order to assess whether SELMON increased the robustness of the anomaly detection process, we performed the following experiment: We compared SELMON performance to the per formance of the traditional limit sensing technique in selecting critical sensor subsets specified by a Space Station Environ mental Control and Life Support System (ECLSS) domain expert, sensors seen by that expert as useful in understanding episodes of anomalous behavior in actual historical data from ECLSS testbed operations.
The experiment asked the following specific question: How often did SELMON place a "critical" sensor in the top half of its sensor ordering based on the anomaly detection measures?
The performance of a random sensor selection algorithm would be expected to be about 50%; any particular sensor would appear in the top half of the sensor ordering about half the time. Limit sensing detected the anomalies 76.3% of the time. SELMON detected the anomalies 95 .I% of the time.
These results show SELMON performing considerably bet ter than the traditional practice of limit sensing. They lend credibility to our premise that the most effective monitoring system is one which incorporates several models of anoma lous behavior. Our aim is to offer a more complete, robust set of techniques for anomaly detection to make human oper ators more effective, or to provide the basis for an automated monitoring capability.
The following is a specific example of the value added of SELMON. During an episode in which the ECLSS pre heater failed, system pressure (which normally oscillates within a known range) became stable. This "abnormally normal" behavior is not detected by traditional monitor ing methods because the system pressure remains firmly in the nominal range where limit sensing fails to trig ger. Furthermore, the fluctuating behavior of the sensor is not modeled; the predicted value is an averaged stable value which fails to trigger discrepancy detection. See [4; 5] for more details on these previous results in evaluating the SELMON approach.
3 Determining the Locus of an Anomaly
A robust anomaly detection capability provides the core for monitoring, but only when this capability is combined with attention focusing does monitoring become both robust and efficient. Otherwise, the potential problems of information overload and too many false positives may defeat the utility of the monitoring system.
The attention focusing technique developed here uses two sources of information: historical data describing nominal system behavior, and causal information describing which pairs of sensors are constrained to be correlated, due to the presence of a dependency. The intuition is that the origin and extent of an anomaly can be determined if the misbehaving system parameters and the misbehaving causal dependencies can be determined. Such information also supports reasoning to distinguish whether sensors, system parameters or mech anisms are misbehaving due to the fact that the signature of Signature of Anomalous Mechanism
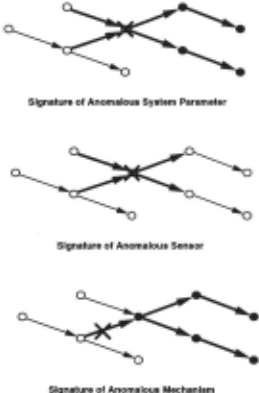
Figure 1: Anomalous System Parameters, Sensors and Mech anisms.
"broken" nodes and arcs in the causal graph are distinguish able. See Figure 1.
For example, the expected signature of an anomalous sen sor includes the node of the sensor itself and the immediately adjacent arcs corresponding to the causal dependencies that the sensor participates in directly. The intuition is that the actual system is behaving normally so the locus of "broken ness" is isolated to the sensor and the set of adjacent causal dependencies which attempt and fail to reconcile the bogus value reported by the sensor.
The expected signature of an anomalous system parameter also includes nodes and arcs which are downstream in the causal graph from the node corresponding to the system pa rameter. The intuition here is that the misbehavior, being in the actual system, will propagate. (Clearly a heuristic inter pretation, for not all misbehaviors will propagate). .
The expected signature of an anomalous mechamsm also includes arcs and nodes causally downstream from the arc corresponding to the mechanism. Once again, the intuition is that the misbehavior is in the system itself, and it will prop agate. The way to distinguish this case from the anomal~us system parameter case is to examine all input arcs (assummg there are more than one) to the most causally prior node in the "broken" subgraph.
3.1 Distance and Causal Distance
While SELMON runs, it computes incremental frequency dis tributions for all sensors being monitored. These frequency distributions can be saved as a method for capturing behav ior from any episode of interest. Of particular interest are historical distributions which correspond to nominal system behavior.
To identify an anomalous sensor, we apply a distance mea sure, defined below, to the frequency distribution which rep resents recent behavior to the historical frequency distribution representing nominal behavior. We call the measure simply distance. To identify a "broken" causal dependency, we first apply the same distance measure to the historical frequen~y distributions for the cause sensor and the effect sensor. This reference distance is a weak representation of the correlation that exists between the values of the two sensors due to the causal dependency. This reference distance is then compared to the distance between the frequency distributions based on recent data of the same cause sensor and effect sensor. The dif ference between the reference distance and the recent distance is the measure of the "brokenness" of the causal dependency. We call this measure causal distance.
3.2 Desired Properties of the Distance Measure
Define a distribution D as the vector d; such that

and
For a sensorS, we assume that the range of values for the sensor has been partitioned into n contiguous subranges of equal size which exhaust the range. We construct a frequency distribution as a vector Ds of length n, where the value of d; is the frequency with which S has displayed a value in the ith subrange.
If our aim was only to compare different frequency distri butions of the same sensor, we could use a distance measure which required the number of partitions, or bins in the two distributions to be equal, and the range of values covered by the distributions to be the same. However, since our aim is to be able to compare the frequency distributions of different sensors, these conditions must be relaxed.
Before defining the set of desired properties of the dis tance measure, we define two special types of frequency dis tribution. Let F be the random, or flat distribution where 'v'i, d; = ~, and entropy is maximized. Let S; be the set of "spike" distributions where d; = 1 and 'v'J =I z, dj = 0, and entropy is minimized.
It is our view that the flat and spike distributions should be maximally distinguished by our distance measure. For what change of behavior seems more startling, more abnor mal, more indicative of a deep anomaly than a sensor which has been perfectly predictive suddenly offering no basis for prediction, or vice versa?
More generally, we seek a distance measure for frequency distributions with the following properties:
This property merely defines the measure as a distance measure.
We do not wish to emphasize whether we are comparing recent data to historical data or vice versa. Also, we do not wish to emphasize whether we are comparing cause data to effect data or vice versa. We want our method to be driven by the simplest causal graphs of undirected dependencies.
The distance measure should distinguish distinct frequency distributions.
Spike Distinctness
We wish the set of S; to be distinguishable.
Spike Ordering
The distance measure should preserve the fact that the bins represent a discretization of a continuously-valued parameter, with an implied ordering among the values.
Spike Equidistance
There should be no difference in weighting of the spike distributions (assuming bins of equal width).
Spike/Flat Equidistance
The difference between any spike distribution and the flat distribution is to be the same. (All spike distributions have minimal , and equal entropy.)
Any spike distribution and the flat distribution are to be considered the most different. All other distributions fall in between. This is our original and most important motivation in devising the distance measure.
3.3 The Distance Measure
The distance measure is computed by projecting the two dis tributions into the two-dimensional space [f, s] in polar coor dinates and taking the euclidian distance between the projec tions.
Define the "flatness" component f(D) of a distribution as follows:
where Entropy( D) is the familiar
This is simply a normalized entropy measure for the distri bution. Note that 0 ~ f(D) ~ 1.
Define the "spikeness" component s(D) of a distribution as:
This is simply the centroid value calculation for the distri bution. The weighting factor ¢ will be explained in a moment. Once again, 0 ~ s(D) ~ 1.
Now take [!, s] to be polar coordinates [r, B] . This maps F to the origin and the S; to points along an arc on the unit circle. See Figure 2.
By inspection, the Spike Distinctness, Spike Ordering and Spike/Flat Equidistance properties are satisfied. The Spike Equidistance property is satisfied because there is no un equal weighting applied in the centroid calculation. The Dis tance, Identity and Symmetry properties follow from taking the euclidian distance between the projections of the distri butions. The Extrema property is satisfied by taking ¢ = 1· This choice of¢ guarantees that t..(So, Sn-1) = t..(F, So) = t..(F, Sn-1) = 1 and all other distances in the region which is the range oft.. are by inspection ~ 1.
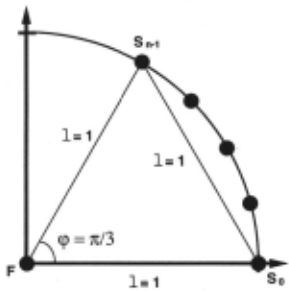
The Distinctness property is not satisfied by the func tion t..(D1, Dz). This is not surprising because the multi dimensional space arising from the number of bins in a distribution is collapsed to a two-dimensional space [!, s]. Thoughts on how to address this limitation appear below.
Insensitivity to the number of bins in the two distributions and the range of values encoded in the distributions is provided by the [f, s] projection function, which abstracts away from these properties of the distributions.
3.4 Results
In this section, we report on the results of applying the dis tribution distance measure to the task of focusing attention in monitoring. The distribution distance measure is used to identify misbehaving nodes (distance) and arcs (causal dis tance) in the causal graph of the system being monitored, or equivalently, detect and isolate the extent of anomalies in the system being monitored.
3.4.1 A Space Shuttle Propulsion Subsystem
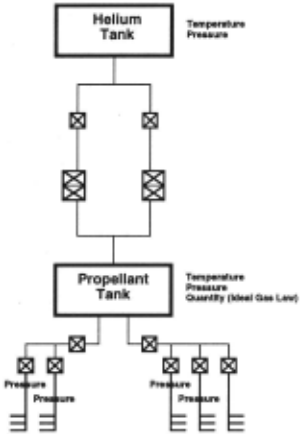
Figure 3 shows a schematic for the Forward Reactive Con trol System (FRCS) of the Space Shuttle. Helium provides backpressure when valves are open to force propellant into the manifolds, or jets. There are two assemblies as shown, one for fuel and one for oxidizer. When these substances mix in the jets, spontaneous ignition occurs.
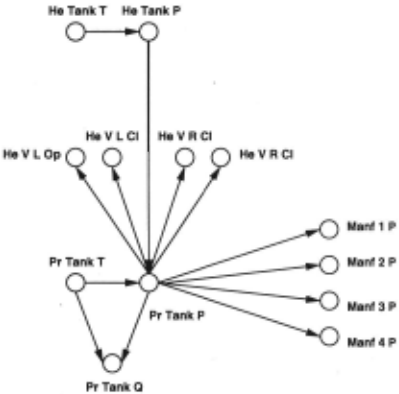
Figure 4 shows a causal graph for a portion of the FRCS of the Space Shuttle. A full causal graph for the Reactive Control System, comprising the Forward, Left and Right RCS, was developed with the domain expert.
3.4.2 Examples
SELMON was run on seven episodes describing nominal behavior of the FRCS. The frequency distributions collected during these runs were merged. Reference distances were computed for sensors participating in causal dependencies.
SELMON was then run on 13 different fault episodes, repre senting faults such as leaks, sensor failures and regulator fail ures. Two of these episodes will be examined here; however, results were similar for all episodes. In each fault episode, and for each sensor, the distribution distance measure was applied to the incremental frequency distribution collected during the episode and the historical frequency distribution from the merged nominal episodes. These distances were a measure ofthe "brokenness" of nodes in the causal graph; i.e., instantiations of the distance measure.
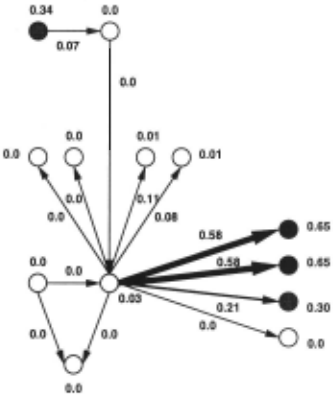
New distances were computed between the distributions corresponding to sensors participating in causal dependencies. The differences between the new distances and the reference distances for the dependencies were a measure of the "bro kenness" of arcs in the causal graph; i.e., instantiations of the causal distance measure.
The first episode involves a leak affecting the first and second manifolds Gets) on the oxidizer side of the FRCS. The pressures at these two manifolds drop to vapor pressure. The dependency between these pressures and the pressure in the propellant tank is altered because the valve between the propellant tank and the manifolds is closed. Thus there are two anomalous system parameters (the manifold pressures) and two anomalous mechanisms (the agreement between the propellant and manifold pressures when the valve is open).
The distance and causal distance measures computed for nodes and arcs in the FRCS causal graph reflect this faulty behavior. See Figure 5. (To visualize how the distribution distance measure circumscribes the extent of anomalies, the coloring of nodes and the width of arcs in the figure are correlated with the magnitudes of the associated distance and causal distance scores).
The behavior at the third manifold is due to a known bug in the training simulator software, which generated the anomaly signatures used in these examples. The apparent anomaly at the helium tank temperature has a different explanation. When the valves between the propellant tank and the manifolds close, the volume of the total system decreases. Since pressure remains the same, temperature changes in accordance with the ideal gas law. SELMON detects this change.
The second episode involves an overpressurization of the propellant tank due to a regulator failure. Onboard software automatically attempts to close the valves which isolate the helium tank from the propellant tank. One of the valves sticks and remains open.
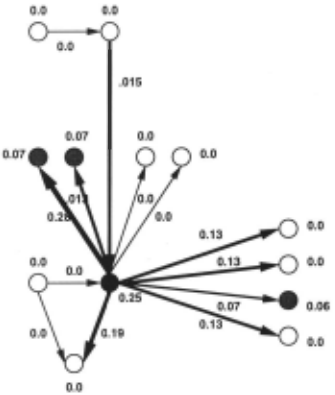
The distance and causal distance measures isolate both the misbehaving system parameters (propellant pressure and valve status indicators) and the altered relationships between the helium and propellant tank pressures and between the pro pellant tank pressure and the valve status indicators. Over pressurization of the propellant tank also alters the usual rela tion between propellant tank pressure and manifold pressures. See Figure 6. Note that the software bug affecting predicted behavior at the third manifold has manifested again.
4 Applications
SELMON is being applied at the NASA Johnson Space Center as a monitoring tool for Space Shuttle Operations. Current application efforts include the one for the Propulsion (PROP) flight control discipline reported on here, and ones for the Guidance, Navigation & Control (GNC) discipline, the Me chanical (MMACS) discipline and the Thermal (EECOM) discipline. An operational SELMON prototype has been avail able since the recent Hubble Repair mission. SELMON runs in a client-server environment and processes change-only data from the telemetry server on hundreds of sensors in real time.
At the Jet Propulsion Laboratory, we are looking at the problem of onboard automated downlink determination for the Pluto Express pre-project. There has also been a gen eral surge of interest recently in spacecraft autonomy. The challenge is to devise methods for robustly detecting and re covering from anomalies on board. When onboard software is unable to effect a recovery, the spacecraft requests assistance from the ground and prepares an anomaly report to bootstrap the analysis of the ground experts. The anomaly detection and attention focusing capabilities of SELMON may be well matched to these tasks.
5 Discussion
The distance and causal distance measures based on the dis tribution distance measure combine two concepts: 1) empir ical data alone can be an effective model of behavior, and 2) the existence of a causal dependency between two parame ters implies that their values are somehow correlated. The causal distance measure constructs a model of the correla tion between two causally related parameters, capturing the general notion of constraint in an admittedly abstract manner. Nonetheless, these models of constraint arising from causal ity provide surprising discriminatory power for determining which causal dependencies (and corresponding system mech anisms) are misbehaving. (In the distance measure for detect ing misbehaving system parameters, we are simply using the degenerate constraint of expected equality between historical and recent behavior.)
The approach described in this paper has usability advan tages over other forms of model-based reasoning. The over head involved in constructing the causal and behavioral model of the system is minimal. The behavioral model is derived directly from actual data; no offline modeling is required. The causal model is of the simplest form, describing only the existence of dependencies. For the Shuttle RCS, a 198-node causal graph was constructed in a single one and one half hour session between the author and the domain expert.
5.1 Monitoring Architecture
The attention focusing capability provided by the distance and causal distance measures can be combined with the multiple viewpoint anomaly detection capability already developed in SELMON to construct a general monitoring architecture.
The multiple anomaly measures (including the distance and causal distance measures, which are anomaly detection mea sures in their own right) provide continuous anomaly detection capability. All of these measures are normalized to the range [0, 1] so their sensitivity, individually or collectively, can be fine-tuned for the behavior of particular monitored systems. Whenever a detected anomaly is announced, the extent of the anomaly is isolated by applying the results of the distance and causal distance measures to the causal graph of the system. If SELMON is supporting a human operator, the operator's at tention is focused on the locus of the anomaly, rather than the potentially long and confusing list of the individual manifes tations of the anomaly.
5.2 Alternate Distance Measures
Other distance measures derived from more standard statis tical concepts certainly are possible. For example, the mean and standard deviation of a distribution might form the basis for the projection space of the function ~. Most of the desired properties for the distance measure can be achieved, with the notable exception of the Extrema property. (Consider three distributions: the flat distribution F, a spike distribution S T, and a distribution with equal peaks at the lowest- and highest valued bins i = 0 and i = n - 1. The mean is the same for these distributions and the standard deviation is least for the spike distribution. However, the flat distribution does not have the greatest standard deviation, violating the Extrema property. Satisfying this property is a prime motivation for our work. Nonetheless a performance comparison of a distance measure based on the mean and standard deviation of a distribution (or other features) would be useful.
The x 2 measure of the difference between two distribu tions is another possibility. However, the standard definition of x 2 would have to be modified to accommodate not only distributions with different numbers of data points, but also distributions with different numbers of bins.
6 Future Work
In addition to exploring alternate distance measures, several issues need to be examined to continue the evaluation of the attention focusing technique based on the distance measure, and its utility in monitoring.
We need to understand the sensitivity of the technique to how sensor value ranges are partitioned. Clearly the discrim inatory power of the distribution distance measure is related to the resolution provided by the number of bins and the bin boundaries. The results reported here are encouraging for the number of FRCS sensor bins were in many cases as low as three and in no cases more than eight. Separately, we are developing a density-based auto-binning technique which se lects bin boundaries which the data naturally reflect. Results have been promising and we hope to soon remove this element of arbitrariness in our approach.
We need to understand the suitability of the technique for systems which have many modes or configurations. We would expect that the discriminatory power of the technique would be compromised if the distributions describing behaviors from different modes were merged. Thus the technique requires that historical data representing nominal behavior is separable for each mode. If there are many modes, at the very least there is a data management task. A capability for tracking mode transitions is also required. We are exploring the use of unsupervised learning to identify and build classifiers for system modes directly from historical data.
We need to understand the consequences of the Distinct ness property not being satisfied by the distribution distance measure. Of concern is whether or not distributions we wish to distinguish are in fact being distinguished. The judicial introduction of additional components (e.g., the number of local maxima in a frequency distribution) to the distribution projection space [j, s] may be required to enhance discrim inability.
7 Acknowledgements
The members of the SELMON team are Len Charest, Dennis DeCoste, Nicolas Rouquette and Jay Wyatt. Matt Barry and Dennis DeCoste provided valuable discussion on the concepts in this paper. Harry Porta provided valuable mathematical and counterexample insights during the development of the distance measure. Matt Barry also served invaluably as do main expert for the Shuttle FRCS. Dave Goeken and Charlie Robertson provided valuable support at Johnson Space Center.
The research described in this paper was carried out by the Jet Propulsion Laboratory, California Institute of Technology, under a contract with the National Aeronautics and Space Administration.
@inproceedings{ijcai1995p234,
  title     = {Determining the Loci of Anomalies Using Minimal Causal Models},
  author    = {Doyle, Richard J.},
  booktitle = {Proceedings of the Fourteenth International Joint Conference on
               Artificial Intelligence, {IJCAI-95}},
  publisher = {International Joint Conferences on Artificial Intelligence},
  editor    = {Chris S. Mellish},
  pages     = {1821--1828},
  year      = {1995},
  note      = {Qualitative Reasoning and Diagnosis},
  url       = {https://ijcai.org/proceedings/1995/234},
}
TY - CPAPER TI - Determining the Loci of Anomalies Using Minimal Causal Models AU - Doyle, Richard J. T2 - Proceedings of the Fourteenth International Joint Conference on Artificial Intelligence, IJCAI-95 PB - International Joint Conferences on Artificial Intelligence PY - 1995 SP - 1821 EP - 1828 UR - https://ijcai.org/proceedings/1995/234 ER -Copied
Machine-readable versions of this paper, for tools and AI agents:





