
Automatic Determination of Image-to-Database Correspondences
Proceedings of the Sixth International Joint Conference on Artificial Intelligence. .
© 1979 International Joint Conferences on Artificial Intelligence
Abstract
New techniques are described for some of the important computations in the automatic determination of image-to-database correspondences. In particular, a technique to predict a region in the image within which a feature is expected to appear, a set of techniques to verify feature matches, and a technique to extend the refinement process to include a new type of match based on linear features, such as roads, are discussed. These techniques are demonstrated in an example in which the system reduces the uncertainties from approximately plus or minus 200 feet on the ground to approximately plus or minus two feet.
- A.P. Ambler et al., "A Versatile Computer-Controlled Assembly System~" ~ ~ ~. pp. 298-307 (August 19r3). IJCAI
- H.G. Barrow, "Interactive Aids for Cartography and Photo Interpretation," Semiannual Technical Report, SRI Project 5300, SRI International, Menlo Park, California (November 1976).
- H.G. Barrow et al., "Parametric Correspondence and Chamfer Matching: Two New Techniques for Image Matching," ~ .E.1f.tll. ~. pp. 659-663 (August 1977). IJCAI
- R.C. Bolles, "Verification Vision for Programmable Assembly," ~.E.1f.tll. ~. pp. 569-575 (August 1977). IJCAI
- R.C. Bolles et al., "The SRI Road Expert: !mage-to-Database Correspondence," ~ ~ Understanding Workshop (November 1978).
- B.L. Bullock et al., "Finding Structur~s in Outdoor Scenes," Hughes Research Report 498, (July 1976).
- L. Davis, "Shtpe Matching Using Relaxation techniques," TR-480, Computer Science Dept., University of Maryland, (September 1976).
- M. Fischler and R. Elschlager, "The Representation and Matching of Pictorial Structures," llEE ~ .QD. Computers, No. 22, pp. 67-92 ~1973}.
- M. Fischler et al., "The SRI Road Expert: An Overview," ~ .ImaG. Understanding Worlfshop (November 1~
- T.D. Garvey, "Perceptual Strategies for Purposive Vision," Technical Note 117 SRI Intl., Menlo Park, California (Septem~er 1976).
- D.B. Gennery, "A Stereo Vision System for an Autonomous Vehicle.~." ~ .E.1f.tll. ~. pp. 576-582 (August 1~77T~ IJCAI
- B.K.P. Horn and B.L. Bachman, "Using ~nthet ic Images with Surface Models," ~. ~ ~1 Vol. 21, No. 11, pp. 914-92~ ovember 1978).
- L.H. Quam, "Road Tracking and Anomaly Detect ion in Aerial Imagery," .fl::2h ~ Understanding Workshop, pp. 51-55 (Mayl978).
References were extracted automatically from the PDF and may contain errors.
Full text extracted automatically from the PDF; figures, tables and equations may differ. The PDF is the version of record.
1. INTRODUCTION
Computing an image-to-database correspondence is a general problem occurring in all knowledge based systems. In most image tasks the correspondence is a projective transformation, which can be modeled as a function of the camera parameters such as focal length, X, Y, Z, heading, pltch, and roll. If the parameters are known precisely, the model can precisely predict the two-dimensional image coordinates for any three-dimensional database point.
One common form of the image-to-database correspondence problem is to be given good estimates of the camera parameters and be asked to improve them. In navigation this refinement process is the crucial step that imRroves the system's estimate of the -location of the plane. In change detection it is used to align two images so that the corresponding regions can be compared.
The basic approach we are using to refine a correspondence is to locate known features in the image and use their locations to improve the correspondence. A database contains descriptions of the available features. The predicted viewpoint and viewing conditions are used to choose features to be located. The estimates of the camera parameters are used to predict what the features look like and where they are likely to appear. Feature detection technique·s ("operators") are chosen to locate the features and they are applied. Since the operators may not locate their intended features, their results are verified either by locating a larger portion of the features or by checking the relative positions of other features. After a set of features has been found, their locations are used to refine the estimates of the camera parameters. The parameters are refined by searching the parameter space for sets of parameter values that minimize the distances between the predicted locations of features and the locations determined by the operators. If the correspondence is not precise enough, the whole process can be repeated.
* This work was supported by ARPA under contract DAAG29-76-C-0057.
A number of people have worked on parts of this process [1, 3, 11, 6, 7, 8, 10, 11, 12], but mainly for pairs of images that were taken closely in time and from similar viewpoints.
Our research goal is to produce an automatic system to refine correspondences for images taken from a variety of viewpoints and under a variety of viewing conditions. This variety makes makes it more difficult to locate features, which in turn, increases the need for verification techniques and carefully planned strategies. ~hich operators should be used for an image taken from this viewpoint and under these conditions? When should the results of one operator be used to reduce the predicted search area for a nearby feature? This type of question becomes more important as features become harder to find.
To build an automatic correspondence refinement system we need to develop new models and techniques for several of the steps in the process. So far we have concentrated on a few of them: the prediction of image locations for features, the verification of the results of operators, and the computation of refined correspondences. In this paper we will state our assumptions, describe our new techniques, and present an example.
2. ASSUMPTIONS
Our assumptions are summarized in Figure 1. Our experimental system refines correspondences for aerial images of rural areas containing roads [ 9].
We assume that we have a database of the area on the ground contained in each picture to be analyzed. The database contains the geometry and topology of the features to be used in the refinement process.
We expect the pictures of an area to be from different viewpoints. They may be taken at
5,000 feet or 20 1 000 feet; they may be 45-degree obliques or vert1cal pictures. Thls variety implies that intensity correlation is not always sufficient to locate features.
- 1 Aerial images of roads
- 2 Perspective images
- a Variety of sun angles
- Repetitive coverage
- ~ Variety of viewpoints Ground resolutions between 20 feet/pixel and 1 foot/pixel
- Time of day and day of year image was taken
- ~8~ Estimates of camera parameters
- ( 16 ~ Small parameter uncertainties Maximum uncertainty regions on the ground of 200 x 200 feet
- ( 11 ) Database of roads and other features
- ( 12) F·eatures obscured by clouds, shadows,and terrain features
FIGURE 1 ASSUMPTIONS
Even though the viewpoints may vary widely, we expect to be given good estimates of the camera parameters for each picture. We also expect a measure of the uncertainty associated with each parameter estimate. For example, the HEADING might be estimated to be 75 degrees plus or minus two degrees. These uncertainties are used to predict the regions in a picture to be searched in order to locate a feature. We will refer to these search regions as "uncertainty regions." The smaller the uncertainties, the smaller the uncertainty regions; the smaller the uncertainty regions, the easier it is to automatically locate the desired features.
Two of our assumptions restrict the range of initial uncertainties about the camera parameter estimates. The first one restricts the combined uncertainties so that they do not imply uncertainty regions on the ground of more than approximately plus or minus 200 feet. The second one restricts the size of each parameter's uncertainty so that it is relatively small. The first assumption, in effect, restricts the sizes of the uncertainty regions that have to be searched to locate a feature. For example, if an image has a resolution of 1 foot/pixel, the largest uncertainty region would then be approximately 400 x 400 pixels. The second assumption limits the portion of the parameter space that the optimizer has to search. It also indirectly limits the maximum geometric change in the appearance of a feature.
3. UNCERTAINTY REGIONS
what region in the picture will have a given probability (e.g., a 95S probability) of containing a point feature from the database? To answer this question, one has to predict the effect on the location 1n the image of a feature caused by changing the parameter values in accordance with their stated uncertainties. To do that one needs a model of their uncertainties. The error model we use is that the parameters vary according to a joint normal distribution, which is a reasonable assumption for measurements produced by a device such as an inertial ~uidance system because each parameter s error is a sum of several small errors. For this model the uncertainty regions are ellipses in the image plane. The derivation of this fact can be found in [5).
Having found one feature one wouid expect that its location would greatly restrict the possible locations for a nearby feature. This idea leads to a second type of uncertainty region a relative uncertainty region. In addit{on to the normal information used to compute an uncertainty region, a relative uncertainty region is a function of another feature and its location. Given the assumption that the camera parameters vary according to a joint normal distribution, the relative uncertainty regions are also ellipses. A derivation of the mathematical description of a relative uncertainty region can be found in [5).
A relative uncertainty region is used to reduce the amount of work required to locate a second feature after a nearby feature has been found. This is particularly useful when a possible match for a feature is being verified. The logic is as follows: if this is feature A, then feature B should be in a small region over there; if B is not there, then we cannot depend on this being A.
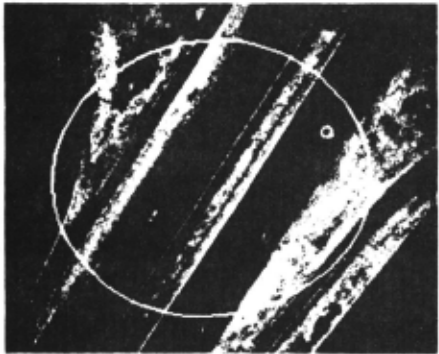
Figure 2 shows the initial uncertainty ellipse and the relative uncertainty ellipse about a point feature. The large ellipse is the uncertainty region predicted from the uncertainties about the camera parameters. The small ellipse is the relative uncertainty region derived from the location of the road marking just above it in the picture.
4. POINT-Ob-A-LINE MATCHES
Point-to-point matches are the standard feature matches used in correspondence refinement. we have introduced point-on-a-line matches because many of the prominent features in pictures are linear, such as roads in aerial images and surface-intersection edges in blocks-world images. To do so we have implemented operators to find points on roads, developed techniques to verify these matches, and extended the parameter refinement process to use them.
We have implemented two techniques that locate points on roads. One is used at low resolution (e.g., 20 feet/pixel) when roads appear as lines, and one ls used at high resolution
(e.g., 1 foot/pixel) when the internal structure of the road is discernible. The low resoluti9n technique is based on the Duda road operator L2], which is a type of line-finding operator. The high resolution technique is an adaptation of Quam's road tracking operator [13] which performs a one-dimensional correlation of the expected road cross section to portions of the image.
There is a built-in trade-off between point features and line features: it is easier to find a point on a line than it is to locate a point feature! but less information is gained by doing so. Po nt-to-point matches produce twice the number of constraints for the refinement process, but they are generally more expensive to find because an area search is required as opposed to a linear search for point-on-a-line matches.
5. CORRESPONDENCE REFINEMENT
The correseondence refinement process (or "optimizer ) is similar to Gennery' s approach to calibration [11]. It solves the nonlinear problem by iteratively solving linear approximations. For point-to-point matches a three-dimensional point in the world is matched with a two-dimensional point in the image. In that case .the optimizer has two residuals per match to use to improve the camera parameter estimates: the X and Y components of the difference between the predicted image of the world point and the point in the image at which the operator located its match. If instead of locating a specific point, an operator locates a point on a line, the optimizer only has one residual to use because the point could be any place along the line. The residual for a point-on-a-line match is the shortest distance from the point to the ·line. As the optimizer searches for improved camera parameters, the image of the three-dimensional line should get closer to the point located by the operator, but the closest point on the line may slip back and forth along the line.
So far the optimizer has only been extended to handle point-on-a-line matches. It may be useful to extend the optimizer to include other types of matches that involve a point and an anal~tic curve! e.g., a point-on-an-ellipse mate · The ma n components of such an extension are 1) a procedure to compute the minimum distance between a point and the curve and (2) a procedure to compute the partial derivatives of that distance with respect to the camera parameters.
The optimizer could even be extended to arbitrary curves by ipcorporating a procedure, such as chamfering [3J, that computes the distance between a point and an arbitrary curve. Unfortunately, such distance computations are generally expensive.
The current implementation of the optimizer is relatively fast. It takes one second on our KL-10 to perform one iteration when 100 residuals are used to refine the estimates. (Recall that each point-to-point match adds two residuals; each point-on-a-line match adds one.) Five to ten iterations are normally required to achieve convergence, which is defined to be a state in which the parameter adjustments a.re on the order of · 00005 units.
As Gennery points out, the optimizer can be used to filter out "mistakes" by iteratively deleting the match with the largest normalized residual, if it is larger than a threshold. In practice this heuristic has proven to be useful, but it is expensive and does not always produce the intended result. Therefore, it is important to filter out as many mistakes as possible before calling the optimizer. The next section describes some of the ways this filtering or verification can be done.
6. FEATURE VERIFICATION
As mentioned in the last section, it appears to be more cost-effective to filter out mistakes, if at all possible, before applying the optimizer. We have identified four possible methods for performing such filtering:
Operator threshold - Be suspicious of any match for which the operator does not produce a confidence above a certain threshold; e.g., if a two-dimensional correlation operator produces a correlation of less than .8, ignore its results.
Self support - Be suspicious of any match that cannot be verified by locating a larger portion of the same feature; e.g., if an operator locates a point that is supposed to be on a road but the road tracker cannot extend the match, ignore it.
Pairwise support - Be suspicious of a pa 1r of matches if they are not positioned correctly with respect to each other· e.g., if the distance between the matching locations for two road markings is significantly longer than expected, assume tliat at least one of the matches is incorrect.
Group support - Be suspicious of a set of matches whose locations do not form a predicted structure; e.g., if the matching locations for four features do not form a square, as expected, assume that at least one of the matches is incorrect.
We differentiate between these heuristics because they require different models and techniques.
It is relatively straightforward to apply all of the verification methoas to point features. The relative uncertainty regions can be used to determine if two features are mutually consistent. This pairwise consistency can be extended to group 90psistency through maximal clique techniques L 1J or through optimal embedding techniques [8).
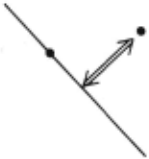
Additional care has to be taken to apply the verification techniques to point-on-a-line matches. The important test is to be able to distinguish pairwise consistent matches from pairwise inconsistent matches when one or more of the matches is a point-on-a-line match. Figure 3 shows the three significantly different cases. In Figure 3a one of the two matches is a point-to-point match and one is a point-on-a-line match. If the slope of the line is known accurately, the distance between the point and the line can be used to determine if the matches are consistent. Since the uncertainties associated with each camera parameter are relatively small, the slope of the line should remain relatively constant. Thus the distance from the point to the line ·should be relatively constant.
(A)
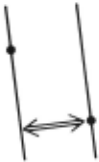
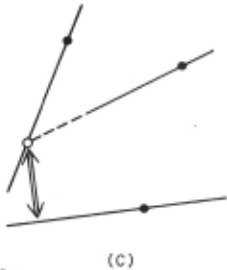
FIGURE 3 "PAIRWISE" SUPPORT CONFIGURATIONS
In Figure 3b both of the matches are point-on-a-line matches and the lines are essentially parallel. In this case the distance between the lines is sufficient to check the relative positions of the two matches. For example, if an operator is trying to locate both sets of lanes on a freeway, the oistance between the two sets of lanes should be within a predetermined range.
If both of the matches are point-on-a-line matches and the lines are not parallel, as in Figure 3c, some additional informat ion is needed in order to check their relative consistency. One solution is to intersect the two lines and use that point in conjunction with a third match to check the relative position of all three matches.
7. EXAMPLE
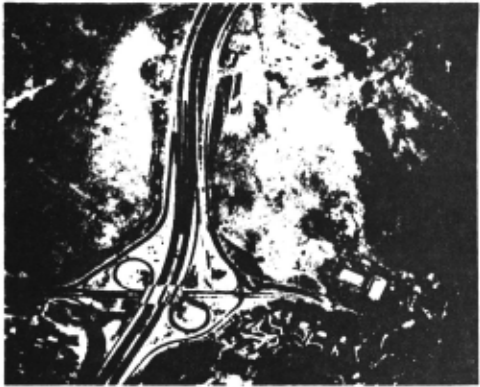
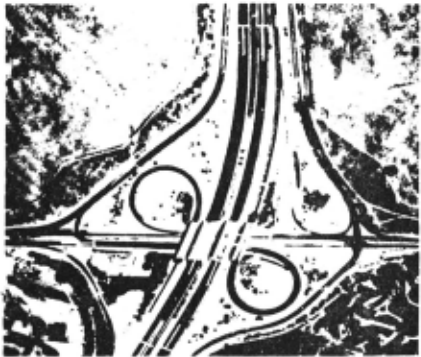
The example task is to refine the image-to-database correspondence for the picture shown in Figure 4 usins its full resolution of approximately 2 feet/plxel. The initial uncertainties about the camera parameters imply uncertainties in the image of plus or minus 95 pixels, which correspond to approximately plus or minus 190 feet on the ground. The goal is to reduce these uncertainties to approximately plus or minus one pixel, an increase ln precision of almost two orders of magnitude.
The database used in this example contains two types of features, linear road segments and road surface markings. Figure 5 shows the features that are available for this site. The lines represent the road segments and the pluses represent the surface markings. The appearance of each road segment is described by a road cross section model. The appearance of a surface marking is described by an image patch from a previous picture of the site.
A fixed strategy has been implemented to use these features-to perform the task and demonstrate our new techniques. The basic approach is to locate the linear features first because they are less expensive to find, use them to refine the camera parameters, locate the point features, use them to verify tne first refinement, and then perform a second refinement using both the points and the lines.
Given estimates for the camera parameters, the system predicts the location of the road segments in the new picture. Figure 6 shows these predictions, which are shifted left and down approximately 60 pixels from their actual locations. The estimates of the camera parameters are also used to warp each road cross section to the expected size and orientation of the corresponding road segment. In addition, the estimates of the uncertainties about the camera parameters are used to predict the uncertainty regions about the center points of each linear segment. Figure 6 shows these uncertainty ellipses that have a 95~ probability of containing the desired point.
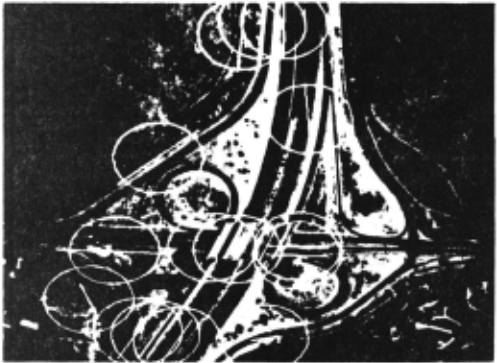
PREDICTIONS AND UNCERTAINTY REGIONS
The search strategy for a linear feature is to look along lines perpendicular to the expected location of the feature. The lengths of the search lines are determined by the uncertainty ellipse.
~he high-resolution, one-dimensional correlation operator is applied along the search line to locate points that may be on the desired road. The self-support method is used to verify each candidate point. That is, the road tracker is asked to track the road for a short distance. If it cannot, the point is abandoned.
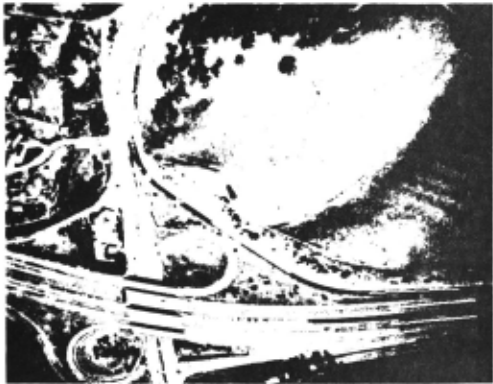
Self-support is not sufficient to identify some road segments because there are two or three parallel roads that are close to each other and all look alike. Pairwise and group support are used to identify these roads on the basis of preplanned groups of features. For example, Figure 1 shows three sets of lanes, two of which are difficult to tell apart. The relative locations of the three sets of lanes are used to determine the correct matches. The lines perpendicular to the roads indicate the final choice for a consistent set of matches.
Figure 8 shows the results of searching for all of the road segments in the database (shown in Figure 5). Two of the roads were not found because the contrasts were not sufficient to produce matches with the desired confidence. The matches were given to the optimizer along with the initial estimates of the camera parameters and the uncertainties about the estimates; the optimizer produced new estimates for the parameters and new uncertainties. Figure 9 shows the new predictions for the locations of the road segments. The new uncertainties imply uncertainties in the image of approximately plus or minus 1.5 pixels, close to our goal.
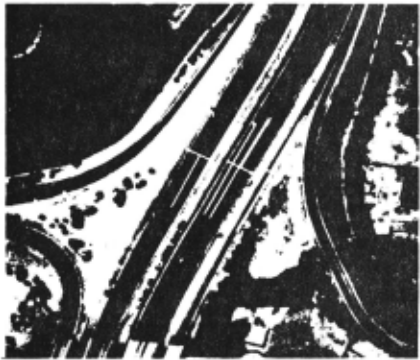
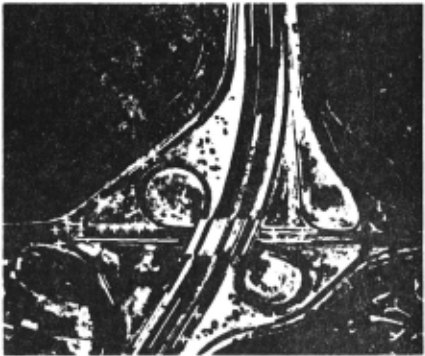
NEW PREDICITIONS
To verify the new estimates the surface markings were located. The new estimates were used to predict the locations and appearances of the features; the new uncertainties were used to predict the uncertainty regions; and two-dimensional correlation was used to locate the features. The average difference between the predicted location and the matching location was approximately 1.3 pixels and the largest distance was 1.7 pixels. The final refinement based on both the lines and the points reduced the uncertainties in the image to approximately 1.1 pixels, which is very close to our goal and corresponds to approximately 2.2 feet on the ground.
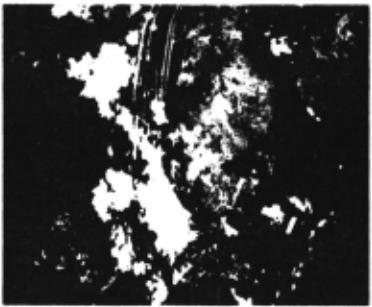
We have begun to experiment with pictures containing clouds. Figure 10 shows the linear features that the system found in one example.
8. CONCLUSION
~e have described and demonstrated a set of techniques to perform some of the subtasks required in an automatic system to refine image-to-database correspondences. In particular, we discussed techniques to compute uncertainty regions, techniques to incorporate point-on-a-line matches, and techniques to verify the results of operators. These techniques were combined to form a strategy, which we demonstrated in an example task.
Additional research is required on several other key subtasks required in an automatic system, such as, the selection of features and the tailoring of a strategies to different tasks. Other needs include better feature modeling, better operators to locate features over a wide range of viewing angles and conditions, and an alternative to least-squares optimization.
@inproceedings{ijcai1979p20,
  title     = {Automatic Determination of Image-to-Database Correspondences},
  author    = {Bolles, Robert C. and Quam, L. H. and Fischler, Martin A. and Wolf, Helen C.},
  booktitle = {Proceedings of the Sixth International Joint Conference on
               Artificial Intelligence, {IJCAI-79}},
  publisher = {International Joint Conferences on Artificial Intelligence},
  editor    = {Bruce G. Buchanan},
  year      = {1979},
  month     = {8},
  url       = {https://ijcai.org/proceedings/1979/20},
}
TY - CPAPER TI - Automatic Determination of Image-to-Database Correspondences AU - Bolles, Robert C. AU - Quam, L. H. AU - Fischler, Martin A. AU - Wolf, Helen C. T2 - Proceedings of the Sixth International Joint Conference on Artificial Intelligence, IJCAI-79 PB - International Joint Conferences on Artificial Intelligence PY - 1979 UR - https://ijcai.org/proceedings/1979/20 ER -Copied
Machine-readable versions of this paper, for tools and AI agents:





