
Further Results on Predicting Cognitive Abilities for Adaptive Visualizations
Proceedings of the Twenty-Sixth International Joint Conference on Artificial Intelligence. Main track. Pages 1568-1574.
https://doi.org/10.24963/ijcai.2017/217
Keywords
- Multidisciplinary Topics and Applications: Intelligent User Interfaces
- Multidisciplinary Topics and Applications: Personalization and User Modeling
- Machine Learning: Classification
Abstract
Previous work has shown that some user cognitive abilities relevant for processing information visualizations can be predicted from eye tracking data. Performing this type of user modeling is important for devising user-adaptive visualizations that can adapt to a user’s abilities as needed during the interaction. In this paper, we contribute to previous work by extending the type of visualizations considered and the set of cognitive abilities that can be predicted from gaze data, thus providing evidence on the generality of these findings. We also evaluate how quality of gaze data impacts prediction.
- Ahn and Brusilovsky 2013]
- J. Ahn and P. Brusilovsky. 2013. Adaptive Visualization for Exploratory Information Retrieval. Inf. Process. Manag. 49, 5, 1139-1164.
- Bednarik et al. 2013]
- R. Bednarik, S. Eivazi, and H. Vrza- kova. 2013. A Computational Approach for Prediction of Problem-Solving Behavior Using Support Vector Ma- chines and Eye-Tracking Data. In Eye Gaze in Intelligent User Interfaces. London: Springer, 111-134.
- Bixler and D'Mello 2015]
- R. Bixler and S. D'Mello. 2015. Automatic Gaze-Based Detection of Mind Wandering with Metacognitive Awareness. In Int. Conf. on User Modeling, Adaptation and Personalization. Dublin, Ire- land: Springer, 31-43.
- Boy et al. 2014]
- J. Boy, R.A. Rensink, E. Bertini, and J.D. Fekete. 2014. A Principled Way of Assessing Visualiza- tion Literacy. IEEE Trans. Vis. Comput. Graph. 20, 12, 1963-1972.
- Conati et al. 2015]
- C. Conati, G. Carenini, D. Toker, and S. Lallé. 2015. Towards User-Adaptive Information Visuali- zation. In 29th AAAI Conf. on Artificial Intelligence. Aus- tin, TX, USA: AAAI, 4100-4106.
- Ekstrom et al. 1976]
- R.B. Ekstrom, J.W. French, H.H. Harman, and D. Dermen. 1976. Manual for kit of factor referenced cognitive tests. Educational Testing Service.
- Andy Field. 2012. Discovering Statistics Using IBM SPSS Statistics 4. ed., London: Sage Publications.
- Fukuda and Vogel 2009]
- K. Fukuda and E.K. Vogel. 2009. Human Variation in Overriding Attentional Capture. J. Neurosci. 29, 27, 8726-8733.
- Gingerich and Conati 2015]
- M.J. Gingerich and C. Conati. 2015. Constructing Models of User and Task Characteris- tics from Eye Gaze Data for User-Adaptive Information Highlighting. In 29th AAAI Conf. on Artificial Intelli- gence. Austin, Texas, USA: AAAI, 1728-1734.
- Gotz and Wen 2009]
- D. Gotz and Z. Wen. 2009. Behavior- driven visualization recommendation. In Int. Conf. on In- telligent User Interfaces. New York, NY: ACM, 315-324.
- B. Grawemeyer. 2006. Evaluation of ERST: An External Representation Selection Tutor. In 4th Int. Conf. on Diagrammatic Representation and Infer- ence. Berlin: Springer, 154-167.
- K. Holmqvist. 2011. Eye tracking: A Comprehensive Guide to Methods and Measures. Oxford: Oxford University Press.
- Iqbal et al. 2005]
- S.T. Iqbal, P.D. Adamczyk, X.S. Zheng, and B.P. Bailey. 2005. Towards an Index of Opportunity: Understanding Changes in Mental Workload During Task Execution. In SIGCHI Conf. on Human Factors in Com- puting Systems. Portland, OR, USA: ACM, 311.
- Jaques et al. 2014]
- N. Jaques, C. Conati, J.M. Harley, and R. Azevedo. 2014. Predicting Affect from Gaze Data dur- ing Interaction with an Intelligent Tutoring System. In Int. Conf. on Intelligent Tutoring Systems. Honolulu, HI, USA: Springer, 29-38.
- Kardan and Conati 2012]
- S. Kardan and C. Conati. 2012. Exploring gaze data for determining user learning with an interactive simulation. In Int. Conf. on User Modeling, Adaptation, and Personalization. Springer, 126-138.
- M. Kuhn. 2008. Building predictive models in R using the caret package. J. Stat. Softw. 28, 5, 1-26.
- Lallé et al. 2016]
- S. Lallé, C. Conati, and G. Carenini. 2016. Prediction of Individual Learning Curves across In- formation Visualizations. User Model. User-Adapt. Inter- act. 26, 4, 307-345.
- Lallé et al. 2017]
- S. Lallé, C. Conati, and G. Carenini. 2017. Impact of Individual Differences on User Experi- ence with a Real-World Visualization Interface for Public Engagement. In Int. Conf. on User Modeling, Adaptation, and Personalization. Bratislava, Slovakia: ACM (to ap- pear)
- Mouine and Lapalme 2012]
- M. Mouine and G. Lapalme. 2012. Using Clustering to Personalize Visualization. In Int. Conf. on Information Visualization. Montpellier, France: IEEE, 258-263.
- Nazemi et al. 2014]
- K. Nazemi, W. Retz, J. Kohlhammer, and A. Kuijper. 2014. User similarity and deviation analy- sis for adaptive visualizations. In Human Interface and the Management of Information. Information and Knowledge Design and Evaluation. Springer, 64-75.
- Ooms et al. 2014]
- K. Ooms, P. De Maeyer, and V. Fack. 2014. Study of the attentive behavior of novice and expert map users using eye tracking. Cartogr. Geogr. Inf. Sci. 41, 1, 37-54.
- Špakov 2012
- O. Špakov. 2012. Comparison of eye move- ment filters used in HCI. In Symposium on Eye Tracking Research and Applications. ACM, 281-284.
- Steichen et al. 2014]
- B. Steichen, C. Conati, and G. Carenini. 2014. Inferring Visualization Task Properties, User Performance, and User Cognitive Abilities from Eye Gaze Data. ACM Trans. Interact. Intell. Syst. 4, 2, 11.
- Toker et al. 2012]
- D. Toker, C. Conati, G. Carenini, and M. Haraty. 2012. Towards adaptive information visualiza- tion: on the influence of user characteristics. In Int. Conf. on User Modeling, Adaptation, and Personalization. Ber- lin: Springer, 274-285.
- Toker et al. 2013]
- D. Toker, C. Conati, B. Steichen, and G. Carenini. 2013. Individual user characteristics and infor- mation visualization: connecting the dots through eye tracking. In SIGCHI Conf. on Human Factors in Compu- ting Systems. New York, USA: ACM, 295-304.
- Ziemkiewicz et al. 2011]
- C. Ziemkiewicz, R.J. Crouser, A.R. Yauilla, S.L. Su, W. Ribarsky, and R. Chang. 2011. How locus of control influences compatibility with visual- ization style. In IEEE Conf. on Visual Analytics Science and Technology. Providence, RI, USA: IEEE, 81-90.
References were extracted automatically from the PDF and may contain errors.
Full text extracted automatically from the PDF; figures, tables and equations may differ. The PDF is the version of record.
1 Introduction
Information visualization (InfoVis) is a thriving area of research that takes advantage of the strength of human perception to facilitate the analysis of complex data. There is mounting evidence that several cognitive abilities and traits can influence users' visualization experience both in terms of overall task performance (e.g., [Ziemkiewicz et al. 2011; Toker et al. 2012]) as well as in how well users can process specific elements of a visualization (e.g., [Toker et al. 2013; Ooms et al. 2014; Iqbal et al. 2005]) These findings support the value of having user-adaptive visualizations, i.e., intelligent interfaces that learn about their users (user modeling) and adapt the visualization to meet each user's needs in real time [Conati et al. 2015].
Previous work has shown that some of the user cognitive abilities known to be relevant for processing information visualizations - perceptual speed, visual working memory (WM), and verbal WM - can be predicted in real time from eye tracking data [Gingerich and Conati 2015; Steichen et al. 2014]. These findings provided encouraging evidence on the feasibility of the user modeling necessary for useradaptive visualization. However, this previous work focused on users processing either bar graph or radar graph visualizations, to perform fictional question-answering tasks abstracted from any real usage context. We contribute to this previous work by replicating results on the real-time prediction of perceptual speed and visual WM, for users working with two very different types of visualizations (a deviation chart and a map-based visualization), embedded in a commercial application designed to engage the public in decision making related to urban planning. We also show that real-time prediction is feasible for two other cognitive abilities (visual scanning and spatial memory), not previously considered and relevant for processing the new visualizations we investigated. These results are an important step for advancing research on user-adaptive visualizations from initial proof of concepts to more generalizable findings.
We also evaluate how quality of eye tracking data impacts prediction accuracy. There are promising results on the value of eye tracking data for predicting a variety of user states and abilities in user modeling (e.g., [Bednarik et al. 2013; Kardan and Conati 2012; Jaques et al. 2014; Ooms et al. 2014; Gingerich and Conati 2015; Lallé et al. 2016]). However, eye tracking data can be rather noisy, due to several factors such as user eye physiology (e.g., wearing glasses),excessive movement, design of the eye tracker, etc. [Holmqvist 2011]. Existing user-modeling research has mostly dealt with the problem either by adopting usually laborious procedures to increase data quality during data collection, or by discarding too-noisy data. In addition to being time consuming, these approaches provide results that have limited generalizability to real-world settings, where eye tracking data is bound to be noisy. In this paper, we show that relatively noisy eye tracking data can still be used for prediction, thus providing encouraging, albeit preliminary, evidence on the applicability of our findings to realworld scenarios.
The rest of the paper starts with an overview of related work, followed by a description of the study that generated the dataset we used for this research. Next, we illustrate the eye tracking features we leveraged, the classification experiments we conducted, and their results.
2 Related Work
There is increasing interest in integrating AI and InfoVis research to devise user-adaptive visualizations that can support the specific needs on each individual user. Work to date has focused on adapting to user suboptimal visualization usage [Gotz and Wen 2009], visualization preference [Grawemeyer 2006; Mouine and Lapalme 2012; Nazemi et al. 2014] and interest in the information to be visualized [Ahn and Brusilovsky 2013]. All these user properties were tracked based on user interface actions. There has also been research on predicting user cognitive abilities (namely perceptual speed, visual working memory (WM), and verbal WM) that have been shown to be relevant for processing information visualizations based on bar and radar graphs, using user gaze data [Steichen et al. 2014; Gingerich and Conati 2015]. Other work has shown that these cognitive abilities impact the processing of specific elements of bar and radar graphs. For instance, lower levels of perceptual speed can result in slower processing of legend and labels in bar graphs [Toker et al. 2013], suggesting that these users might benefit from personalized interventions geared toward facilitating legends and labels processing if the visualization can detect in real-time that they have low perceptual speed.
[Lallé et al. 2017] showed similar impact of cognitive abilities on how users process two different types of visualizations in MetroQuest (MQ), a commercial system designed to support decision making for environmental problems. These results suggest that adaptive interventions based on user cognitive abilities could enhance user experience with MQ. In this paper, we investigate whether previous results on predicting cognitive abilities in real-time with eye tracking data can be reproduced on data collected with MQ, both for some abilities already seen in previous work and for new ones specific to [Lallé et al. 2017].
Work in user modeling has typically handled noise in eye tracking data by discarding users or trials with too noisy data, e.g., [Steichen et al. 2014; Jaques et al. 2014; Bixler and D'Mello 2015]. An alternative approach adopted in [Kardan and Conati 2012] involved monitoring data generated by each participant in real-time and requesting adjustments when noisy data was observed, e.g., asking the participants to move less. There are techniques in eye tracking research designed to reduce noise without discarding data, such as removing artifacts responsible for noise, e.g., blinks [Holmqvist 2011], or smoothing noisy gaze datapoints based on the latest clean ones [Špakov 2012]. However, there is limited understanding on how well these techniques scale up with the increase of noise in the data. We provide a first investigation of how noise in eye tracking data affects the prediction in a user modeling task.
3 Dataset
The data used in this paper was collected during a user study (mentioned in the related work and fully described in [Lallé et al. 2017]) that investigated the impact of individual differences on user experience and gaze behavior with MetroQuest (MQ). Here we provide a brief summary of MQ and of the study, sufficient for the purposes of this paper.
3.1 MetroQuest (MQ)
MQ supports rapid customization of a set of standardized screens that guide users through the process of learning about a target decision problem, defining their preferences over the decision factors, exploring various outcome scenarios and generating their decision.
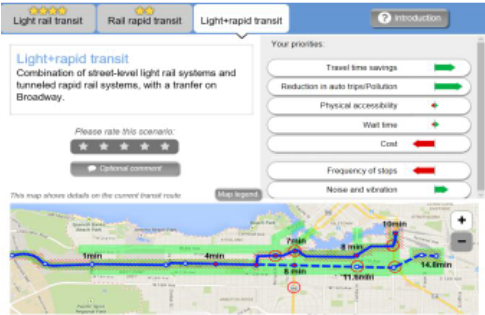
The MQ interface used in this study (Figure 1) addresses the problem of building a new transportation system to our campus. This is a real project currently studied by the City, and it has generated substantial controversy on which of the proposed transit scenarios (light rail, rapid rail, or a combination of both) should be selected. MQ allows users to rank their priorities for seven factors that are affected by the transit decision (e.g., travel time saving to campus, wait time, frequency of stops, reduction in auto trips and pollution). Then MQ shows how each of the proposed transit scenarios affects the decision factors by displaying two complementary visualizations, a deviation chart and a map.
The deviation chart (Fig. 1, upper right hand side of the screen) indicates whether the value of each factor improves (green arrow) or worsens (red arrow) compared to the current situation. Arrow size shows the magnitude of the difference. The map (Fig. 1, bottom) displays factual information on the planned transit scenario (e.g., the route, stop locations) as well as the actual values for factors by means of map keys (e.g., time savings are reported at stops along the route). A button allows opening the legend for the keys of the map. Users can view and compare the different scenarios by using the tabs shown at the top left of Figure 1. A short textual description of each scenario is provided below the tabs. Users can rate a scenario by using the scale shown below the textual description.
3.2 User Study
In the study, 166 participants were invited to use MQ to learn about and provide their preferences on the transit scenarios described in the previous subsection. This mimic how MQ is often used in public settings, such as in information kiosks, where target communities engage in one-time interaction with MQ. Participants were recruited among the population living or working on campus, and thus undoubtfully have a real interest in the task. During the interaction with MQ, participants' gaze was tracked with the Tobii T120, a non-intrusive camera-based eye tracker embedded in the study monitor. Prior to engaging in the study task, each participant underwent a standard calibration phase with the eye tracker. The Tobii T120 also tracks pupil size, which we include in the dataset for predicting user characteristics (see Section 4.2). To compensate for physiological differences in pupil size among users, pupil diameter baselines were collected for each participant by having them stare at a blank screen for ten seconds. To avoid possible confounds of pupil size due to lighting changes, the study was administered in a windowless room with uniform lighting. After completion of the task with MQ (mean completion time = 4min 45sec, st. dev. = 2min 01sec), participants filled a postquestionnaire about their experience with MQ. Lastly, each participant took a battery of tests to measure 12 user characteristics. In this paper, we focus on five of them:
- Perceptual speed (PS), a measure of speed when performing simple perceptual comparisons [Ekstrom et al. 1976]);
- Visual working memory (VisWM) a measure of storage and manipulation capacity of shapes and colors of visual objects [Fukuda and Vogel 2009]);
- Spatial memory (SpM), a measure of storage and manipulation of the spatial arrangement of objects [Ekstrom et al. 1976]);
- Visual scanning (VisScan, a measure of the capacity to actively find relevant information in our surroundings quickly and efficiently [Ekstrom et al. 1976]).
- Visualization literacy (VisLit, the "ability to use wellestablished data visualizations to handle information in an effective and efficient manner" [Boy et al. 2014]) 1 .
We focus on these five characteristics because a previous analysis [Lallé et al. 2017] on this dataset has shown that they are the ones influencing user experience and gaze behavior with the MQ visualizations. Specifically, VisWM affects user preference between chart and maps, i.e., users with high visual WM preferred the deviation charts over the maps. SpM influenced perceived visualization usefulness, i.e., users with lower SpM found the deviation chart less useful than users with higher SpM. SpM, along with PS, VisScan, and VisLit, also influenced gaze behaviors related to making comparisons between visualizations across scenarios, i.e., users with lower levels of these characteristics made fewer visual comparisons than users with higher levels. These results indicate that it could be beneficial to predict in real time whether MQ users have lower or higher levels of the aforementioned abilities and provide adaptive support accordingly. Such support could include for instance, interventions designed to make deviation charts more useful for users predicted to have low SpM, or to facilitate comparisons between scenarios for users with low levels for the relevant abilities. In the next sections, we discuss the eye tracking data and machine learning experiments we used to ascertain if making such predictions is possible.
1 PS, SpM, VisScan and visual WM were collected using the Kit of FactorReferenced Cognitive Tests [Ekstrom et al. 1976]. The Fukuda & Vogel's test [Fukuda and Vogel 2009] was used for visual WM. VisLit was collected using a formal test that has been recently proposed [Boy et al. 2014].
4 Eye Tracking Data Processing
We leverage the eye tracking data collected during the user study described in the previous section to build classifiers that can predict the five user characteristics reported in Section 3.2 during interaction with MQ.
4.1 Data Windows
To simulate the real-time prediction of user characteristics, we generated ten data windows corresponding to incremental percentages (10%, 20%... up to 100%) of eye tracking data during interaction with MQ. This approach allows us to verify how early during the interaction with MQ the target user characteristics can be predicted. Investigating prediction timing is of prime importance for our goal of providing adaptive support in real-time to users with specific characteristics. Early adaptation is especially important in systems like MQ that typically target one-time users for a short period of time, and thus need to be quickly understandable. To predict user characteristics, we generated a battery of eye tracking features (described next.) at each data windows.
4.2 Eye Tracking Features
The Tobii eye tracker captures user's gaze samples, i.e., where the user is looking on the screen, at 120 Hz. Then fixations (gaze maintained at one point on the screen) and saccades (quick eye movement between two fixations) are derived from gaze samples. For every recorded gaze sample, the eye tracker also captures pupil size and distance from user's head to the screen. From all these measures (Gaze, Pupil, and Head Distance) we derived a set of features listed in Table that we leveraged to predict user characteristics during interaction with MQ. We used EMDAT (https://github.com/ATUAV/EMDAT), an eye tracking data analysis toolkit, to generate these features.
Gaze features: EMDAT generated the gaze features listed in Table (part a) by calculating various summary statistics (e.g., sum, mean) over a user's fixations and saccades. These statistics are computed for gaze movements over the whole interface, generating the gaze features labelled as Overall Gaze Features in Table a, or they can be computed over specific areas of interest (AOI) in the MQ interface, generating the AOI Gaze Features in Table a. There are four AOIs defined over four regions of MQ (which is shown Figure 1): Description of the transit scenario; Deviation chart; Map; Legend of the map.
Pupil Features: Pupil sizes were adjusted using the pupil baseline collected during the study, following [Iqbal et al. 2005]. Using EMDAT, we computed a set of summary statistics on user-adjusted pupil size, suitable for describing fluctuations of this measure over the course of the interaction with MQ. These include min, max, mean, and std. dev. of users' pupil sizes in each data window (see Table 1, part b). We also included the measure of a user's pupil at the beginning and the end of the current data window (start and end pupil size in Table 1, b), as a way to capture pupil size variations between the start and the end of each window.
Head Distance Features: Head distance is obtained by averaging the distances from both eyes to the screen. We used EMDAT to compute the same set of statistics as for pupil size (see Table 1, part c), as described above.
| a) Gaze Features (68) |
| Overall Gaze Features (12): |
| Fixation rate |
| Mean & Std. deviation of fixation durations |
| Mean & Std. deviation of saccade length |
| Mean, Rate & Std. deviation of relative saccade angles |
| Mean, Rate & Std. deviation of absolute saccade angles |
| Mean saccade velocity |
| AOI Gaze Features for each AOI (56): |
| Fixation rate in AOI |
| Longest fixation in AOI, Time to first & last fixation in AOI |
| Proportion of time, Proportion of fixations in AOI |
| Number & Prop. of transitions from this AOI to every AOI |
| b) Pupil Features (6) and c) Head Distance Features (6) |
| Mean, Std. deviation, Max., Min. of pupil width/head distance |
| Pupil width/head distance at the first and last fixation in the data window |
Table 1: Set of features considered for classification.
4.3 Eye Tracking Data Validity Thresholds
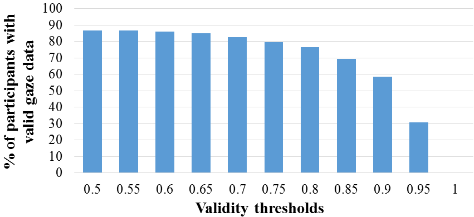
As described in the introduction, we want to investigate if and how quality of eye tracking data influences the real-time prediction of our target user characteristics. The Tobii eye tracker marks each gaze sample as valid or not. Too many invalid gaze samples may make the data for a given user unreliable to represent their gaze, pupil and head behaviors. However, there are no established guidelines to ascertain how many invalid samples are too many. One could be conservative and include only users with small percentages of invalid samples, but this can severely reduce the size of the dataset. To illustrate, Figure 2 shows the percentage of study participants in our dataset with a proportion of valid gaze samples higher than validity thresholds ranging from 0.5 to 1. Setting a validity threshold of 0.9 (i.e., including participants with at least 90% of valid gaze samples) would exclude about 40% of users in our dataset.
We study the tradeoff between data quality and amount available for training by comparing the accuracy of classifiers built on datasets with the following validity thresholds:
- 0.9, which is the last threshold in Fig. 2 that maintains high quality data without losing a large majority of participants (97 participants retained, i.e., 58% of all users);
- 0.6, which includes rather noisy data but a large pool of users (144 participants retained, i.e., 86% of all users);
- 0.8, which is a compromise between the two other thresholds (127 participants retained, i.e., 77% of all users).
5 Classification Experiments and Results
We evaluate the prediction of our five user characteristics (PS, SpM, VisScan, VisWM, VisLit) using a two-stage approach. The first stage ascertains whether we can build classifiers that can predict binary labels of the aforementioned user characteristics. The binary labels were generated by dividing participants into "High" and "Low" groups for each characteristic (e.g., High and Low perceptual speed), based on a median split on the test scores 2 from the study. We compared against a majority-class baseline two classification algorithms available in the CARET package [Kuhn 2008] in R: Boosted logistic regression (LB); and Random forest (RF). Classifier performance is measured by their accuracy (proportion of correct predictions). We focus on these algorithms because in previous work they produced good results for predicting various user states during visualization processing, e.g., [Steichen et al. 2014; Lallé 2016].
The second stage takes the best classifier identified in stage one, and investigates the impact of data quality on prediction accuracy, as well as how early during interaction with MQ we can obtain accurate predictions.
5.1 Feasibility of Predicting User Characteristics
In this first stage, we evaluate the performance of LB, RF, and majority-class baselines as predictors for the target binary labels. It should be noted that baselines are slightly different for datasets with different thresholds because they include different users. For all combinations of user characteristics (5), window lengths (10) and validity thresholds (3), LB, RF and the appropriate baselines were trained and evaluated in 10-fold cross validation over users, namely at each fold users in the test set do not appear in the training set. The process was repeated 25 times (runs) to strengthen the stability and reproducibility of the results. The accuracy of each classifier is averaged over the 10 folds and the 25 runs.
To formally compare the obtained accuracies, for each of the five user characteristics, and for each of the three thresholds, we run a univariate GLM [Field 2012] with classification algorithm (3 levels) as factor and classification accuracy averaged across windows as the dependent measure 3 . Results show significant 4 main effects of classification algorithm for PS, SpM, VisWM, and VisScan, for all three thresholds (F statistics are reported in the "F-statistic" columns in Table 2). Pairwise comparisons for these main effects (Sidak correction applied to adjust for multiple comparisons [Field 2012]), indicate that LB always beats the baseline. RF always beats the baseline and also outperforms LB in all cases (see "Accuracy" in Table 2). We thus opt for RF as the algorithm to further investigate the effect of threshold in the second stage of analysis. Neither RF nor LB beat the baseline in predicting VisLit, thus this characteristic is dropped from the next stage (stage 2) of our analysis.
2 The ranges of the test scores in our data are: 13-63 for PS; 023 for SpM; 0-40 for VisScan; 0-4.7 for VisWM; -1.67-1 for VisLit.
3 We run a separate model for each threshold (as opposed to including threshold as factor in one model) because this approach is better to compare classifiers for each threshold with the baseline for that threshold.
4 Statistical significance in this paper is reported at p < 0.05.
| Threshold 0.6 | Threshold 0.8 | Threshold 0.9 | ||||||||||
|---|---|---|---|---|---|---|---|---|---|---|---|---|
| User Char | Accuracy (%) | Accuracy (%) | F-Statistic | Accuracy (%) | F-Statistic | |||||||
| RF | LB | Baseline | RF | LB | Baseline | RF | LB | Baseline | ||||
| PS | 60.3 † | 55.8 † | 50.8 | F2,7497=496.2 | 60.6 † | 56.3 † | 50.8 | F2,7497=523.436 | 58.1 † | 54.1 † | 51.5 | F2,7497=194.1 |
| SpM | 60.9 † | 58.2 † | 50.6 | F2,7497=587.08 | 61.3 † | 58.7 † | 50.4 | F2,7497=663.93 | 61.2 † | 57.5 † | 50.4 | F2,7497=504.99 |
| VisScan | 57.3 † | 55.4 † | 52.5 | F2,7497=125.469 | 56.7 † | 54.9 † | 51.8 | F2,7497=124.778 | 56.2 † | 53.7 † | 51.9 | F2,7497=82.02 |
| VisWM | 57.5 † | 54.7 † | 50.1 | F2,7497=282.09 | 58.8 † | 55.5 † | 50.5 | F2,7497=354.177 | 60.3 † | 55.7 † | 52.9 | F2,7497=225.75 |
5.2 Effects of Data Validity Threshold
For each of the four user characteristics found to be predictable by RF in the previous subsection (Table 2), Figure 3 includes a graph showing, for the 3 validity thresholds, classifier accuracy over the 10 windows. To formally compare the accuracies with different thresholds, for each of the 4 user characteristics, we run a linear mixed-effects ANOVA [Field 2012] with validity threshold (3 levels) and window length (10 levels) as factors along with classification accuracy as the dependent variable. The last column of Table 3 reports the see F-statistics for this models.
There is a main effect of validity threshold for PS, VisScan and VisWM. The results of pairwise comparisons on validity threshold (Sidak correction applied) for these three characteristics are summarized in the second column of Table 3. Thresholds are ordered by prediction accuracy, e.g., "0.6 > 0.9" indicates RF with data validity at 0.6 performed better than RF with data validity at 0.9. Underlining indicates that the differences between thresholds underlined together are not statistically significant.
| User Char. | Ranking of accuracy at different threshold | Main Effect (F-Statistic) | |
|---|---|---|---|
| PS | 0.8 > 0.6 > 0.9 | F2,7470= | 23.78 † |
| SpM | 0.8 > 0.9 > 0.6 | F2,7470= | 1.02 |
| VisScan | 0.6 > 0.8 > 0.9 | F2,7470= | 7.10 † |
| VisWM | 0.9 > 0.8 > 0.6 | F2,7470= | 34.46 † |
Table 3 shows that for PS, both 0.8 and 0.6 are the best thresholds (there is no significant difference between their accuacies). For VisScan, validity threshold 0.6 provides the best classification accuracies. For VisWM, the best validity threshold is 0.9. No main effect of validity threshold was found for SpM, meaning that there is no significant differences in classification accuracies among the three thresholds for this characteristic.
It is notable that for PS, SpM, and VisScan, a validity threshold of 0.6 is either the best or is tied for the best. Recall that a threshold of 0.6 allows for more eye tracking data to be used for training our models, but the data is noisier. When 0.6 provides top predictive accuracies, it means that having more training data outweighs or compensates the need for having clean data. These findings provide preliminary evidence that accurate predictions can be made for users with rather noisy data, which is what will likely be available to the classifier if these predictions are to be used to guide adaptive support to users of MQ in real-world settings. As Table 3 shows, VisWM is the only user characteristic for which having more data is less important than having clean data, possibly because the patterns indicative of this ability are more subtle and thus more prone to be learned incorrectly by a classifier with noisier data. We will further discuss prediction of VisWM at the end of this section.
In the rest of this section, we focus on the classifier with the winning validity threshold for each user characteristic, and discuss when it achieves its maximum accuracy over the ten data windows representing the availability of classification data overtime during an interaction with MQ. For each classifier, we performed pairwise comparisons between its accuracy at each of the 10 windows and report in Table 4 (third column) the set of windows (ordered by accuracy) where classification accuracy was statistically equivalent and outperformed the accuracy in all other windows.
| User Char | Optimal Validity Threshold | Best Window Lengths | Accuracy at Earli- est Best Window |
|---|---|---|---|
| PS | .6 | 40>10>50 | 63.9% |
| SpM | .6 | 80>60>70>90 | 67.4% |
| VisScan | .6 | 30 | 64.0% |
| VisWM | .9 | 30 | 68.2% |
The last column in Table 4 reports the accuracy at the earliest window reported in the previous column. For instance, for PS, windows 10, 40, and 50 have statistically equivalent accuracy and outperform all other windows. Thus the earliest optimal prediction for PS can be obtained after only 10% of a user's interaction with the MQ task (only 15 seconds of interaction on average), with an accuracy close to 63.9%. Overall, Table 4 shows that the best predictions occur early
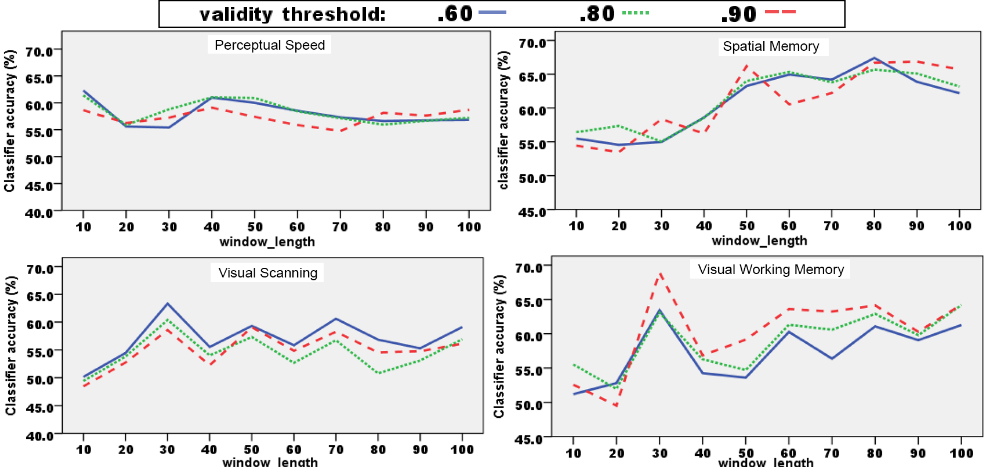
not just for PS, but also for VisScan and VisWM (window 30). For SpM, the earliest best window is 60, i.e., slightly more than halfway in the task, which still leave substantial time to provide adaptation.
5.3 Further Results for VisWM
The previous subsection showed that unlike the other user characteristics, the best predictions for VisWM are obtained using data with a high validity threshold of 0.9. Here, we investigate whether a VisWM classifier trained using this high quality data can still make good predictions on users with noisier (and thus more realistic) data. Specifically, we evaluated a RF classifier using 25-runs of 10-fold cross validation, where at each fold the training set included only users with data at the 0.9 validity threshold, and the test set included unseen users with data at the 0.6 validity threshold. A statistical analysis similar to the one in the previous subsection shows that this combined classifier and the VisWM classifier evaluated on data at the 0.9 threshold are not statistically different and both are significantly better than the model evaluated on data at the 0.6 threshold. In terms of actual accuracies and when they peak during interaction, the best (statically equivalent) windows for the combined classifier are 30, 80, and 70. The earliest of these windows (30), is the same as for the classifier with 0.9 validity and the accuracy at this window is 66.1%, which is comparable to the best accuracies for the other three user characteristics.
6 Conclusion
In this paper, we investigated if a user's cognitive abilities relevant for processing information visualizations can be predicted solely from eye tracking during interaction with MetroQuest (MQ), a visualization-based system designed to engage the public in environmental decision making. We showed that a Random Forest classifier outperforms a majority-class baseline in predicting four of the five user cognitive abilities we tested: perceptual speed (PS), visual WM (VisWM), spatial memory (SpM), and visual scanning (VisScan). Our results are important because previous findings on predicting user abilities during visualization processing were obtained for fictitious tasks done on bar and radar charts, whereas here we consider two different visualizations used for a task resembling how MQ is used in real-life settings. Moreover, previous findings pertained only to PS and VisWM; here, we replicated those findings with similar accuracies, but also showed the feasibility of predicting two additional cognitive abilities. Thus, our findings are a step toward showing the generality of predicting a variety of user cognitive abilities during visualization processing. These predictions are motivated by the long-term goal of devising user-adaptive visualizations that can recognize and adapt to the specific abilities of their users.
We also investigated how noise in eye tracking data influences our prediction. For PS, SpM, and VisScan we found that training our classifiers with noisier but larger datasets worked better that having cleaner but fewer data. These results suggest that further investigation on the impact of gaze data validity in user-modeling is worthwhile, because it may eventually reduce the efforts researchers have to put in obtaining high validity data, at least for specific user modeling tasks. As for VisWM, the best accuracies were obtained with a classifier trained with high validity data. However, we showed that this classifier can still make good predictions on noisier data containing up to 40% invalid samples per user. Investigating prediction on noisy data is important to gauge the applicability of eye-tracking-based user models in real-world settings. Thus, as part of future work, we plan to continue experimenting with eye tracking data collected in realistic settings. We also plan to examine ways to increase the performance of our classifiers, for instance by leveraging additional data sources such as interaction data.
@inproceedings{ijcai2017p217,
  title     = {Further Results on Predicting Cognitive Abilities for Adaptive Visualizations},
  author    = {Conati, Cristina and Lallé, Sébastien and Rahman, Md. Abed and Toker, Dereck},
  booktitle = {Proceedings of the Twenty-Sixth International Joint Conference on
               Artificial Intelligence, {IJCAI-17}},
  publisher = {International Joint Conferences on Artificial Intelligence Organization},
  editor    = {Carles Sierra},
  pages     = {1568--1574},
  year      = {2017},
  month     = {8},
  note      = {Main track},
  doi       = {10.24963/ijcai.2017/217},
  url       = {https://doi.org/10.24963/ijcai.2017/217},
}
TY - CPAPER TI - Further Results on Predicting Cognitive Abilities for Adaptive Visualizations AU - Conati, Cristina AU - Lallé, Sébastien AU - Rahman, Md. Abed AU - Toker, Dereck T2 - Proceedings of the Twenty-Sixth International Joint Conference on Artificial Intelligence, IJCAI-17 PB - International Joint Conferences on Artificial Intelligence Organization PY - 2017 SP - 1568 EP - 1574 DO - 10.24963/ijcai.2017/217 UR - https://doi.org/10.24963/ijcai.2017/217 ER -Copied
Machine-readable versions of this paper, for tools and AI agents:





