
Automated Heart Wall Motion Abnormality Detection from Ultrasound Images Using Bayesian Networks
Proceedings of the Twentieth International Joint Conference on Artificial Intelligence. Pages 519-524.
© 2007 International Joint Conferences on Artificial Intelligence
Abstract
Coronary Heart Disease can be diagnosed by measuring and scoring regional motion of the heart wall in ultrasound images of the left ventricle (LV) of the heart. We describe a completely automated and robust technique that detects diseased hearts based on detection and automatic tracking of the endocardium and epicardium of the LV. The local wall regions and the entire heart are then classified as normal or abnormal based on the regional and global LV wall motion. In order to leverage structural information about the heart we applied Bayesian Networks to this problem, and learned the relations among the wall regions off of the data using a structure learning algorithm. We checked the validity of the obtained structure using anatomical knowledge of the heart and medical rules as described by doctors. The resultant Bayesian Network classifier depends only on a small subset of numerical features extracted from dual-contours tracked through time and selected using a filterbased approach. Our numerical results confirm that our system is robust and accurate on echocardiograms collected in routine clinical practice at one hospital; our system is built to be used in real-time.
- [American Heart Association, 2006] American Heart Association. Heart disease and stroke statistics -2006 update. 2006. URL:http://www.americanheart.org/presenter.jhtml? identifier=1200026. Link
- [Biesiada J., 2005] Duch W. Biesiada J. Feature selec- tion for high-dimensional data: A kolmogorov-smirnov correlation-based filter solution. CORES 2005 4th Inter- national Conference on Computer Recognition Systems., pages 95 -105, 22-25 May 2005. Rydzyna. Advances in Soft Computing, Computer Recognition Systems.
- [Catlett, 1991] J. Catlett. On changing continuous attributes into ordered discrete attributes. Proceedings of the Eu- ropean Working Session on Learning, Berlin, Germany, pages 164 -178, 1991.
- [Cerqueira et al., 2002] Manuel D. Cerqueira, Neil J. Weiss- man, Vasken Dilsizian, Alice K. Jacobs, Sanjiv Kaul, Warren K. Laskey, Dudley J. Pennell, John A. Rum- berger, Thomas Ryan, , and Mario S. Verani. Stan- dardized myocardial segmentation and nomenclature for tomographic imaging of the heart: A statement for healthcare professionals from the cardiac imag- ing committee of the council on clinical cardiology of the american heart association. American Heart Association Circulation, 105:539 -542, Jan 2002. http://circ.ahajournals.org/cgi/content/full/105/4/539; ac- cessed Dec 8, 2004. Link
- [Chakravarti and Roy, 1967] R. Laha I. Chakravarti and J. Roy. Handbook of Methods of Applied Statistics. John- Wiley and Sons, Chichester, 1967.
- [Comaniciu et al., 2004] D. Comaniciu, X. S. Zhou, and S. Krishnan. Robust real-time tracking of myocardial bor- der: An information fusion approach. IEEE Trans. Med- ical Imaging, 23, NO. 7:849 -860, 2004.
- [Comaniciu, 2003] D. Comaniciu. Nonparametric informa- tion fusion for motion estimation. Proc. IEEE Conf. Com- puter Vision and Pattern Recognition, I:59 -66, 2003.
- [Cowell et al., 1999] R. G. Cowell, A. P. Dawid, S. L. Lau- ritzen, and D. J. Spiegelhalter. Probabilistic Networks and Expert Systems. Springer, 1999.
- [Dougherty et al., 1995] James Dougherty, Ron Kohavi, and Mehran Sahami. Supervised and unsupervised discretiza- tion of continuous features. In International Conference on Machine Learning, pages 194-202, 1995.
- [Fayyad and Irani, 1993] U. M. Fayyad and K. B. Irani. Multi-interval discretization of continuous-valued at- tributes for classification learning. Proceedings of the 13th International Joint Conference on Artificial Intelligence, pages 1022 -1027, 1993. IJCAI
- [Georgescu et al., 2005] B. Georgescu, X. S. Zhou, D. Co- maniciu, and A. Gupta. Database-guided segmenta- tion of anatomical structures with complex appearance. IEEE Conf. Computer Vision and Pattern Recognition (CVPR'05), San Diego, CA, 2005, 2005.
- [Moir and Marwick, 2004] Stuart Moir and Thomas H. Mar- wick. Combination of contrast with stress echocar- diography: A practical guide to methods and inter- pretation. Cardiovascular Ultrasound, 2:15, 2004. URL: http://cardiovascularultrasound.com/content/2/1/15; accessed Nov 5, 2004. Link
- [Murphy, 2001] Kevin P. Murphy. The bayes net toolbox for MATLAB: http://bnt.sourceforge.net, 2001. [Norsys: Software corp., 2000] Norsys: Software corp. Net- ica, 2000. Link
- [P. Spirtes and Scheines, 2000] C. Glymour P. Spirtes and R. Scheines. Causation, Prediction, and Search. Adaptive Computation and Machine Learning. MIT Press, second edition, 2000.
- [Picano et al., 2001] Eugenio Picano, Attila Palinkas, and Robert Amyot. Diagnosis of myocardial ischemia in hy- pertensive patients. Journal of Hypertension, 19:1177 - 1183, 2001.
- [Picano, 1997] Eugenio Picano. Stress Echocardiography. Springer Verlag, 1997. ISBN: 3540626204.
- [World Health Organization, 2004] World Health Organiza- tion. The atlas of heart disease and stroke. 2004. http://www.who.int/cardiovascular diseases/resources/ at- las/en/index.html. Link
- [Zhou et al., 2005] Xiang Sean Zhou, Dorin Comaniciu, and Alok Gupta. An information fusion framework for robust shape tracking. IEEE Trans. on Pattern Anal. and Machine Intell., 27, NO. 1:115 -129, January 2005.
References were extracted automatically from the PDF and may contain errors.
Full text extracted automatically from the PDF; figures, tables and equations may differ. The PDF is the version of record.
1 Introduction
Early detection (along with prevention) is an excellent way of controlling Coronary Heart Disease (CHD). CHD (along with Congestive Heart Failure) can be detected by measuring and scoring the regional and global motion of the left ventricle (LV) of the heart; CHD typically results in wall-motion abnormalities, i.e., local segments of the LV wall move abnormally (move weakly - known as hypokinesia, not at all - known as akinesia, or out of sync with the rest of the heart - known as dyskinesia), and sometimes motion in multiple regions, or the entire heart, is compromised. The LV can be imaged in a number of ways. The most common method is the echocardiogram - an ultrasound video of different 2-D crosssections of the LV. Echocardiograms are unfortunately notoriously difficult to interpret, and even the best of physicians can misdiagnose heart disease. Hence there is a tremendous need for an automated "second-reader" system that can provide objective diagnostic assistance, particularly to the lessexperienced cardiologist.
In this paper, we address the task of building a computeraided diagnosis system that can automatically detect wallmotion abnormalities from echocardiograms. Our goal is to develop a real-time system to assist physicians to interpret wall motion scores, and thereby reduce variability and improve diagnostic accuracy of wall motion analysis. Section 2 provides some medical background on cardiac ultrasound and the standard methodology used by cardiologists to score wall-motion abnormalities. In Section 3 we describe our real-life dataset, which consists of echocardiograms from leading healthcare institutions to diagnose wallmotion abnormalities. Sections 4 and 5 provide an overview of our proposed system which we built on top of an algorithm that detects and tracks the inner and outer cardiac walls [Georgescu et al., 2005; Zhou et al., 2005; Comaniciu, 2003; Comaniciu et al., 2004]. It consists of a classifier that classifies the local region of the heart wall (and the entire heart) as normal or abnormal based on the wall motion. We describe our methodology for feature selection and classification, followed in Section 6 by our experimental results. We reference some related work in Section 7, and conclude with some thoughts about our plans for future research in Section 8.
2 Medical Background Knowledge
2.1 What is Coronary Artery Disease?
Coronary artery disease (CAD) results from the development of plaque within one or several of the arteries that feed the muscle surrounding the left ventricle of the heart. Early signs of CAD include perfusion abnormalities which would indicate the lack of oxygenated blood going to tissue. As CAD progresses, it will manifest itself as wall motion abnormalities, which can be detected by echocardiography. Finally, CAD will lead to angina, or chest pain. This changing manifestation of CAD is described by Picano et al. [Picano et al., 2001; Picano, 1997] as the "ischemic cascade". Accurate regional wall motion analysis of the LV is an essential component of interpreting echos to detect this effect, particularly for early disease.
Heart disease has no gender, geographic or socio-economic boundaries. Cardiovascular Disease (CVD) is a global epidemic that is the leading cause of death worldwide (17 mil. deaths per year) [World Health Organization, 2004]. Since 1900, CVD has been the No. 1 killer in the USA every year except 1918. It claims more lives each year than the next 4 leading causes of death combined, which are cancer, chronic lower respiratory diseases, accidents, and diabetes mellitus [American Heart Association, 2006]. Coronary Heart Disease (CHD) accounts for more than half the CVD deaths (roughly 7.2 mil. deaths worldwide every year, and 1 of every 5 deaths in the US), and is the single largest killer in the world. Accurate early diagnosis of CHD - primarily with cardiac ultrasound - has been identified as a critical factor in improving patient outcomes for CHD.
2.2 Divisions of the Heart
There are many imaging modalities that have been used to measure myocardial perfusion, left ventricular function, and coronary anatomy for clinical management and research; for this project we chose to use echocardiography. The Cardiac Imaging Committee of the Council on Clinical Cardiology of the American Heart Association has created a standardized recommendation for the orientation of the heart, angle selection and names for cardiac planes and number of myocardial segments [Cerqueira et al., 2002]. This is the standardization used in this project.
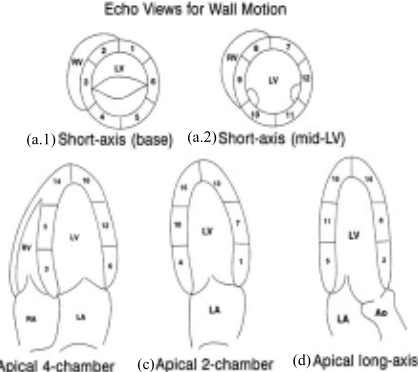
Echo images are collected from four standard views: apical 4 chamber (A4C, Figure 1(b)), apical 2 chamber (A2C, Figure 1(c)), parasternal long axis (PLAX) or apical 3 chamber (A3C, Figure 1(d)), and parasternal short axis (PSAX, Figure 1(a.1,a.2)). These views result from cutting the heart along different 2-D planes.
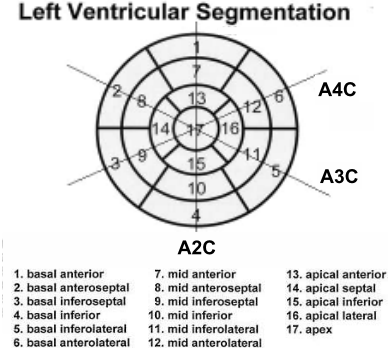
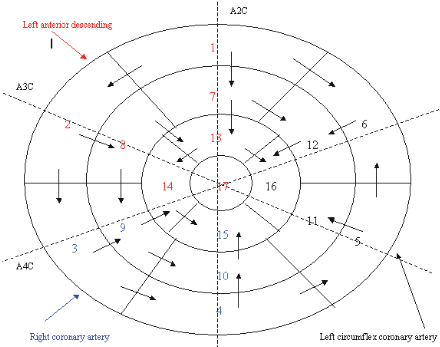
The left ventricle (LV) is divided into 17 myocardial segments, 16 of which are measurable. The short-axis view which results in a circular view of the LV can be taken at 3 locations, near the apex (apical), at the middle (mid-cavity, Figure 1(a.2)), or near the base (basal, Figure 1(a.1)). The most desirable being the mid-cavity cut. If one lays these 3 resultant rings against one another, all segments of the heart are visible in relationship to one another, as shown in Figure 2 (modified from reference [Cerqueira et al., 2002]). The left anterior descending(LAD) feeds segments 1, 2, 7, 8, 13, 14 and 17, the right coronary artery (RCA) feeds segments 3, 4, 9, 10 and 15, and the left circumflex coronary artery (LCX) feeds segments 5, 6, 11, 12 and 16.
3 Understanding the Data
The data is based on standard adult transthoracic B-mode ultrasound images collected from the four standard views described previously. The echos are in 256 gray scale color, with a resolution in the order of magnitude of about 2 mm. Currently we utilize the three apical views - A2C, A3C, and A4C - which show all 16 segments of interest These provide all the information needed to achieve our goal of classifying hearts.
Even though we have images at different levels of stress (resting, low-dose stress, peak-dose stress, recovery) this work is based on images taken when the patient was resting. The goal is to automatically provide an initial score, or classification, to determine whether a heart is normal or abnormal given the resting ultrasound.
The data consists of 345 cases for which we have associated images as well as ground truth and 2216 cases for which we only have ground truth (no images); all of which were generated using pharmacological stress, which allows the physician to control the amount of stress a patient experiences (in this case induced by dobutamine). All the cases have been labeled at the segment level by a group of trained cardiologists; this is what we refer to as "ground truth". Each of the 16 segments were labeled 1 - 5 (1 = normal, 2 = hypokinetic, 3 = akinetic, 4 = dyskinetic, 5 = aneurysm), for simplification purposes we converted this 5-class problem to a binary class problem (1 = normal, 2 - 5 = abnormal).
4 Preparation of the Data
Our application consists of two main parts: image processing, and classification. In this paper we will focus only on the classification portion, details of the image processing part can be found in the referenced papers. The echos are run through an algorithm which detects and automatically tracks both the interior (endocardial) and exterior (epicardial) borders of the LV [Comaniciu, 2003; Comaniciu et al., 2004]. Motion interferences (e.g. probe motion, patient movement, respiration, etc.) are compensated for by using global motion estimation based on robust statistics outside the LV, this is done so that only the heart's motion is analyzed. Then numerical feature vectors, which are extracted from the dual-contours tracked through time, form the basis for the regional wall motion classification.
4.1 Image processing
The first step toward classification of the heart involves contour generation of the LV [Georgescu et al., 2005]. Ultrasound is known to be noisier than other common medical imaging modalities such as MRI or CT, and echocardiograms are even worse due to the fast motion of the heart muscle and respiratory interferences. The framework used by our algorithm is ideal for tracking echo sequences since it exploits heteroscedastic (i.e. location-dependent and anisotropic) measurement uncertainties.
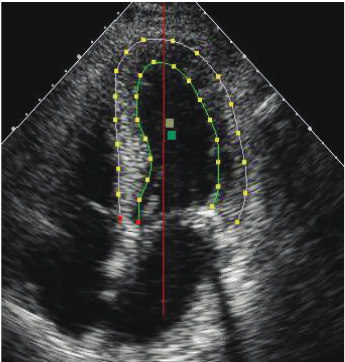
The algorithm takes a hand-initialized border and tracks it from one frame to the next through the entire video clip. The inner and outer contours are treated as a single shape for coupled double-contour tracking. "Intuitively, a double-contour approach can propagate information from the endocardium to guide the localization of the epicardium (or vice versa), thus achieving more robust tracking of the two borders than tracking them independently" (details in [Zhou et al., 2005]). The global motion estimation can be seen in Figure 3 as a vertical line near the center of the image. After tracking, numerical features are computed from the dual-contours tracked through time. The features extracted are both global (involving the whole LV) and local (involving individual segments visible in the image), and are based on velocity, thickening, timing, volume changes, etc.
4.2 Extracted Features
A number of features have been developed to characterize cardiac motion in order to detect cardiac wall motion abnormalities, among them: velocity, radial and circumferential strain, local and global Simpson volume, global and local ejection fraction (EF) ratio, and segmental volume. Some of these features, including velocity, circumferential strain, and local EF ratio, are based on the inner (endocardial) contour.
Due to the patient examination protocol, only the systole (i.e. contraction phase of the heart) is recorded for some patients. In order for the features to be consistent, the systole is extracted from each patient based on the cavity area change. For each frame, the LV cavity area can be estimated accurately based on the inner (endocardial) contour of that frame. The frame corresponding to the maximal cavity area that is achieved at the end of diastolic phase (expansion phase of the heart) is the frame considered to be the beginning of systole. The frame corresponding to the minimal cavity area (achieved at the end of systolic phase) is the frame assumed to be the end of systole. For the time being, all features are computed based only on the systolic phase. However, the methods used to calculate the features are generally applicable for the diastolic phase as well. The following is a basic description of some of the features:
- Velocity features: determines how fast any pair of control points change in the x and y coordinate system per frame.
- Circumferential strain features: also called Fractional Shortening, measures how much the contour between any two control points shrinks in the systolic phase. This is measured along the parameter of the contour.
- Radial strain features: also called Thickening, measures how much the contour shrinks for each control point between any two time frames. This is measured along the radius from a calculated "center" of the LV.
- Local and Global Simpson Volume features: determine the volume as computed by the Simpson rule (with 50 disks) for each frame, and for the systolic phase of the heart as a whole (this gives the global EF, which captures the whole heart's contraction abnormalities).
- Segmental Volume features: determine the volume per segment per frame, and the segmental EF values (i.e local EFs, which aim to capture the local cardiac contraction abnormalities).
In general, the global version of certain features (e.g. radial strain, circumferential strain, etc) can be calculated by taking the mean, or standard deviation, of the 6 segment's respective feature values from any one view. All in all we had 120 local and global features for each of the 3 views (360 total), all of which were continuous. The limitations of present wall motion analysis programs, e.g. color kinesis and blood pool, is that they only evaluate wall motion and not heart wall thickening, which is the hallmark of ischemia. Our program takes both into account.
5 Segment Classification
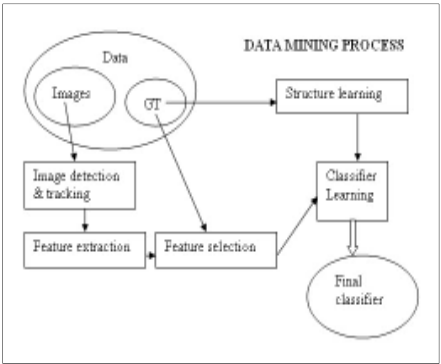
Our data mining process which starts with the raw data (ultrasound videos) and ends with a robust classifier that predicts/ assesses heart wall motion for the 16 segments of the heart, can be summarized as follows:
- The image sequences are pre-processed to extract the area of interest (i.e. the LV). Intensity Normalization and an appropriate resizing are applied.
- Given the initial contour, the border tracking is performed as described in section 4.1, item 2.
- A set of features is extracted from the tracked contours as described in section 4.2.
- Using the provided Ground Truth (assessments from the doctors), a network structure is learned that represents the correlations among segments, this process is explained in detail in section 5.2.
- For each segment, a subset of relevant features for classification is selected (section 5.1), as a result the classifiers we obtain only depend on a small number of numerical features extracted from the dual-contours tracked through time. Having classifiers depending on a small number of features not only improves performance time but also results in better generalization.
- This subset of numerical features is providedas evidence for the networks' variables of interest (the 16 heart segments) to provide classification for each segment and the whole heart. The entire process is diagrammed in figure 4.
5.1 Feature Selection
One of the difficulties in constructing a classifier for this task is the problemof feature selection. It is a well-known fact that a reduction on classifier feature dependence can improve the classifier's generalization capability. However, the problem of selecting an "optimal" minimum subset of features from a large pool (in the order of hundreds) of potential original features is known to be NP-hard. In this paper we use a very simple but efficient filter-based approach. In general, Filterbased methods aim to select features based on simple auxiliary criteria, such as feature correlation, to remove redundant features. We used the Kolmogorov-Smirnov test (KS-test)
[Biesiada J., 2005; Chakravarti and Roy, 1967] to measure the maximum difference between the empirical cumulative distributions of the two classes according to a given feature, in other words, the KS-test measures the difference between the two histograms of the two classes with respect to all the available features. This test is a nonparametric method and it makes no assumptions about the underlying distributions of the two classes being tested .All the available features are ranked by the score given by the KS-test and only the features at the top of the list are selected for classification. Note that a high rank according to the KS-test implies that the corresponding empirical cumulative distributions of the two classes according to these features are considerably different, making these features desirable for discrimination between the two classes.
5.2 Bayesian Networks
Bayesian Networks or Belief Networks (BNs) are directed graphical models (e.g., see [Cowell et al., 1999] for an overview): the BN structure is a directed acyclic graph (DAG), and the BN parameters are conditional probabilities, represented by a contingency table in case of discrete variables. The directed edges in the graph can often be interpreted in an intuitive way, namely as causal relationships (requiring additional assumptions) [P. Spirtes and Scheines, 2000].
We applied BNs to automatically detecting heart abnormalities to utilize the structural knowledge of the heart segments in hopes of improving the classification accuracy for the whole heart. In this paper, the following representation will be used
- numbers between 1 and 16 will be used to name the respective heart segment being referred to.
- arrows (for example: ← , →) are used to denote the direction of causality. An arrow is drawn from the cause (parent) node to the effect (child) node. Example: 5 ← 6 should be read as 6 causes/influences 5, here 5 is the child node and 6 is the parent node.
- Two segments are called "neighbors" if they share a
common boundary. For example: the neighbors of 1 are 6, 7, and 2 (as shown in Figure 2). 8 and 12 are not neighbors since they lie diagonal to 1 and share only a point of contact with 1. They could only be influenced by 1 via one of the neighbors.
Prior Domain Knowledge expressed as Rules
We derived prior knowledge from prior clinical research - Moir & Marwick [Moir and Marwick, 2004] are well-known cardiologists who have provided some basic rules about reading echos in standard views. According to our cardiologist collaborators, two rules of thumb that most doctors use while reading a patient's echos have to do with neighboring segments and shared coronary artery territory. Neighboring segments influence each others behavior. And if two segments are fed by the same coronary artery, one is abnormal and the other unknown, then it is better to err on the side of caution and classify the unknown segment as abnormal.
Learning Bayesian Network structure from data
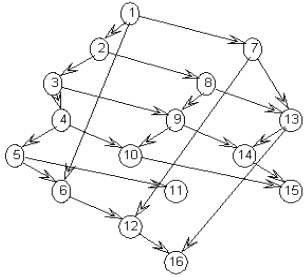
To find a network structure that represents the relations among the heart segments from the data, we used Kevin Murphy's BNT algorithm [Murphy, 2001]. We applied a structure discovery method because creating a structure by hand using only physical knowledge of the heart would have resulted in a cyclic graph. For learning the structure we used the GT from both the training cases and the 2216 non-image cases. It is important to note that the structures that we found using the data, actually mirrored the physical relationships within the heart but without creating cycles, furthermore, the resulting structure coincides with our cardiac knowledge extracted from literature. The obtained structure can be seen in Figure 5. Overlaying the structural relationships learned on the circular diagram of the heart segments (see Figure 6) shows the logical sense of themwith respect to the physical heart.
6 Testing Learned BNModels
To test the BNs we learned, we transferred the final networks to a well-known Bayesian networks commercial software, Netica [Norsys: Software corp., 2000] and did parameter training using 220 training cases with images, and 2216 cases without images (i.e. a subset of the same cases used to do structure learning; note that the 2216 cases without images were only used during training since they incorporated the relationship between segments in their GT). The test set was 125 cases, with images, held out specifically for this purpose. The testing process involved entering all available evidence into the compiled network, running inference, and querying all variables of interest simultaneously. In our case, the evidence given to the network were the 6 best segment specific features found by the Kolmogorov-Smirnov test (all continuous attributes), and the variables of interest that were queried were the nodes that represented each heart segment (S1, S2, ... , S16; all discrete attributes). After the structure between the segments was learned off of data via the BNT method described above, we manually added the evidence variables using a naive Bayesian methodology (each node representing a segment specific feature was influenced only by the corresponding segment's node in the network, e.g. S2→ s2 A3C segvol ef).
As an alternative to this naive Bayes method, we also tried to learn a general Bayes net (i.e., without any constraints on the network structure), allowing a feature node to be possibly connected to several segment nodes. However, when learning the structure between the imaging-feature nodes and the segment nodes, the number of available training cases with images, namely 220, was very small compared to the number of 96 feature nodes in the Bayes net. This let to large uncertainty concerning the learned structure, and possibly to overfitting. Not surprisingly, we found that, on the test set, the general Bayes net learned from this small amount of training data actually gave results inferior to the ones of the naive Bayes method
All continuous valued features were discretized using Recursive Minimal Entropy Partitioning [Dougherty et al., 1995], a method based on minimal entropy heuristic, presented in [Catlett, 1991; Fayyad and Irani, 1993]. This is a supervised algorithm that uses class information entropy of candidate partitions to select bin boundaries for discretization. We tested the network using a subset of selected features described above.
6.1 Numerical Experiments
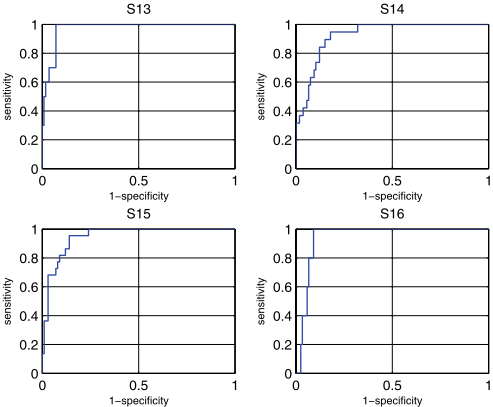
Since the trade-off between false positives (FP, i.e. wrongly labeling the heart abnormal) versus false negatives (FN, i.e. wrongly labeling the heart normal) depends on the clinical context were the system is being used, we decided that the more objective way to measure the performance of our classifier is to measure the area under the ROC curve (AUC).
Our classifier was trained using 220 cases, and was tested on 125 cases. It's result can be seen in the ROC curves of four segments in Figure 7. Our feature selection resulted in each segment being dependent on six features (both global and local). Table 1 shows the AUCs for the testing set. As the results show, the classifier did well on each segment, and on the whole achieved high sensitivity, between 80% and 90%, for 80% specificity on most segments.
| Table 1: AUCs for test set | |||
|---|---|---|---|
| Segment | 16 seg BNT | Segment | 16 seg BNT |
| S1 | 0.90883 | S9 | 0.96474 |
| S2 | 0.89617 | S10 | 0.92763 |
| S3 | 0.96779 | S11 | 0.84508 |
| S4 | 0.91673 | S12 | 0.98374 |
| S5 | 0.84806 | S13 | 0.97168 |
| S6 | 0.98374 | S14 | 0.92552 |
| S7 | 0.86453 | S15 | 0.94818 |
| S8 | 0.8208 | S16 | 0.945 |
7 RelatedWork
There is currently no system that tries to do a similar sort of analysis as our system; our approach is novel in this regard. In the past, systems have attempted to extract and display only one parameter of interest. For example, the current stateof-the-art Hewlett-Packard's Acoustic Quantification extracts and displays volume, and their Color Kinesis system displays motion. The problems with both these systems are that their segmentation is unreliable and they only display one feature, which is insufficient to capture wall motion. Our work has robust segmentation and is the first to combine all features of interest. There is only one other paper that mentions similar work: "Automated Classification of Wall Motion Abnormalities by Analysis of Left Ventricular Endocardial Motion Patterns" by Johan G. Bosch, Francisca Nijland Ph.D., Steven C. Mitchell, G. van Burken, Boudewijn P.F. Lelieveldt Ph.D., Otto Kamp Ph.D, Milan Sonka Ph.D., and Johan H.C. Reiber Ph.D in the Journal of the American Society of Echocardiography (ASE), 2003. But they had very limited results with their system. Due to the limited nature of past systems, we do not have any numerical results that compare our system to other approaches.
8 Future work
In the future we plan on expanding our classification to identify different levels of CHD severity at the segment level, incorporating the use of other standard echocardiography views and including images from other levels of stress (e.g.: peak dose). We would also like to apply a ranking algorithm to take advantage of multi-class scores for classification. We are currently studying the effects of perturbation of the border initialization on the final predictions. We also hope to address the question of the sensitivity of results to errors in the border initialization.
9 Conclusion
In this paper we address the task of building an objective classification application for heart wall motion analysis, based on features calculated off of echocardiograms. The simple but effective feature selection technique that was used results in a classifier that depends on only a small subset of the calculated features, and their limited number makes it easier to explain the final classifier to physicians in order to get their feedback. Although we only had a relatively small number of cases with images and ground truth, we were able to leverage a large number of additional cases - namely data without images, but with ground truth only - to improve performance. And the learned structure that resulted showed that it was possible to learn the same relationships as described in literature. Using a simple and publically available algorithm we achieved sensitivity performance in the mid-80's. Currently we are looking into how these encouraging results can help less-experienced cardiologists improve their diagnostic accuracy; as it stands now, the agreement between less-experienced cardiologists and the experts is often below 50%. As a top cardiologist put it: "It is AWESOME! This will be a major advance to patient care... This will be a REAL killer application...!".
@inproceedings{ijcai2007p82,
  title     = {Automated Heart Wall Motion Abnormality Detection from Ultrasound Images Using Bayesian Networks},
  author    = {Qazi, Maleeha and Fung, Glenn and Krishnan, Sriram and Rosales, Rómer and Steck, Harald and Rao, R. Bharat and Poldermans, Don and Chandrasekaran, Dhanalakshmi},
  booktitle = {Proceedings of the Twentieth International Joint Conference on
               Artificial Intelligence, {IJCAI-07}},
  publisher = {International Joint Conferences on Artificial Intelligence},
  editor    = {Manuela M. Veloso},
  pages     = {519--524},
  year      = {2007},
  url       = {https://ijcai.org/proceedings/2007/82},
}
TY - CPAPER TI - Automated Heart Wall Motion Abnormality Detection from Ultrasound Images Using Bayesian Networks AU - Qazi, Maleeha AU - Fung, Glenn AU - Krishnan, Sriram AU - Rosales, Rómer AU - Steck, Harald AU - Rao, R. Bharat AU - Poldermans, Don AU - Chandrasekaran, Dhanalakshmi T2 - Proceedings of the Twentieth International Joint Conference on Artificial Intelligence, IJCAI-07 PB - International Joint Conferences on Artificial Intelligence PY - 2007 SP - 519 EP - 524 UR - https://ijcai.org/proceedings/2007/82 ER -Copied
Machine-readable versions of this paper, for tools and AI agents:





