
Inferring Useful Heuristics from the Dynamics of Iterative Relational Classifiers
Proceedings of the Nineteenth International Joint Conference on Artificial Intelligence. Pages 708-712.
© 2005 International Joint Conferences on Artificial Intelligence
Abstract
In this paper we consider dynamical properties of simple iterative relational classifiers. We conjecture that for a class of algorithms that use label– propagation the iterative procedure can lead to nontrivial dynamics in the number of newly classified instances. The underlaying reason for this non– triviality is that in relational networks true class labels are likely to propagate faster than false ones. We suggest that this phenomenon, which we call two-tiered dynamics for binary classifiers, can be used for establishing a self–consistent classification threshold and a criterion for stopping iteration. We demonstrate this effect for two unrelated binary classification problems using a variation of a iterative relational neighbor classifier. We also study analytically the dynamical properties of the suggested classifier, and compare its results to the numerical experiments on synthetic data.
- [Cohen and Morrison, 2004] P. Cohen and C. T. Morrison. The hats simulator. In Proceedings of the 2004 Winter Simulation Conference, Washington, DC, 2004.
- [Friedman et al., 1999] Nir Friedman, Lise Getoor, Daphne Koller, and Avi Pfeffer. Learning probabilistic relational models. In Proceedings of the 16th International Joint Conference on Artificial Intelligence (IJCAI), pages 1300- 1307, Stockholm, Sweden, 1999. IJCAI
- [Getoor et al., 2001] L. Getoor, E. Segal, B. Taskar, and D. Koller. Probabilistic models of text and link structure for hypertext classification. In Proceedings of IJCAI-01 Workshop on Text Learning: Beyond Supervision, Seattle, WA, 2001.
- [Keogh et al., 2004] E. Keogh, S. Lonardi, and C. Ratanama- hatana. Towards parameter-free data mining. In Pro- ceedings of ACM SIGKDD International Conference on Knowledge Discovery and Data Mining, Seattle, WA, 2004.
- [Kleinberg, 1999] Jon M. Kleinberg. Authoritative sources in a hyperlinked environment. Journal of the ACM, 46(5):604-632, 1999.
- [Macskassy and Provost, 2003] S. Macskassy and F. Provost. A simple relational classifier. In Pro- ceedings of Workshop on Multi-Relational Data Mining in conjunction with KDD-2003, Washington, DC, 2003.
- [McCallum et al., 2000] Andrew McCallum, Kamal Nigam, Jason Rennie, and Kristie Seymore. Automating the con- struction of internet portals with machine learning. Infor- mation Retrieval Journal, 3:127-163, 2000.
- [McGovern et al., 2003] A. McGovern, L. Friedland, M. Hay, B. Gallagher, A. Fast, J. Neville, and D. Jensen. Exploiting relational structure to understand publication patterns in. SIGKDD Explorations, 5(2):165-172, 2003.
- [Neville and Jensen, 2000] J. Neville and D. Jensen. Iterative classification in relational data. In Proceedings of AAAI- 2000 Workshop on Learning Statistical Models from Rela- tional Data, pages 13-20, Austin, TX, 2000.
- [Slattery and Craven, 2000] Seán Slattery and Mark Craven. Discovering test set regularities in relational domains. In Proceedings of ICML-2000, pages 895-902, Stanford, US, 2000.
- [Taskar et al., 2004] B. Taskar, M. Wong, P. Abbeel, and D. Koller. Link prediction in relational data. In Advances in Neural Information Processing Systems 16. MIT Press, Cambridge, MA, 2004.
References were extracted automatically from the PDF and may contain errors.
Full text extracted automatically from the PDF; figures, tables and equations may differ. The PDF is the version of record.
1 Introduction
Recently there has been a growing interest in relational learning and classification. While traditional learning approaches assume different data instances are independent and identically distributed, relational classification methods allows for the study of more complex data structures because it explicitly takes into account their existing links and relations. Recently developed algorithms for relational classification have been used for learning probabilistic relational models [Friedman et al., 1999], hypertext classification [Getoor et al., 2001], web page classification [Slattery and Craven, 2000; Macskassy and Provost, 2003], link prediction [Taskar et al., 2004], discovery of authoritative information [Kleinberg, 1999], studying relational structures in scientific publications [McGovern et al., 2003], etc.
Most of the existing methods for relational classification are iterative in nature [Neville and Jensen, 2000; Macskassy and Provost, 2003]. The intuitive assumption behind the iterative approach is that information inferred about one entity can be used to make inferences about other entities that are related to it. This allows class labels (or associated probabilities) to propagate throughout the system as newer instances are classified. Although iterative classifiers have been shown to enhance prediction accuracy [Neville and Jensen, 2000; Macskassy and Provost, 2003], there is an associated risk: a few false inferences sometimes lead to a "snow-ball" effect [Neville and Jensen, 2000] cascading the number of misclassified entities as iteration proceeds. As a consequence, the final results will depend strongly on the accuracy of initially assigned class labels and on the classification criteria, i.e., model parameters. More generally, it is known that many classification algorithms are sensitive to parameter settings. For example, [Keogh et al., 2004] found that few popular data mining algorithms performed well on multiple problems without parameter adjustments.
In this paper we argue that for a class of iterative classifiers the issue of parameter sensitivity can be addressed in a self consistent and elegant manner by examining the dynamics of the iterative procedure more closely. We illustrate this point for a simple iterative classifier that uses a threshold-based criterion for labelling data-instances, and propose a metaheuristic for setting the optimal threshold value. Our heuristic is based on the assumption that in relational networks true class labels are likely to propagate faster than false ones. We demonstrate that this phenomenon, which we call two-tiered dynamics, can serve as a natural criterion for both setting a threshold value and stopping the iteration. Hence, our method reduces the dependency of iterative classification on model parameters.
To illustrate our approach, we introduce a simple algorithm for relational binary classification. We consider the case when the relation between two data-instances is characterized by the weight of the link connecting them, so that the relational structure is fully determined by an adjacency matrix M. Given an initial set of known instances of a class A, our algorithm then defines an iterative scheme with a simple threshold based rule: an instance will be classified as type A if it is connected to super-threshold number of classified or initially known instances of type A. The novelty of our approach is that we suggest a self-consistent way of setting the parameter of our model, the threshold: namely, we set it automatically to the value that produces the most pronounced two-tiered dynamics. We present empirical results that illustrate the use of this approach. We also develop an analytical framework for describing the dynamics of iterative classification of our algorithm, and compare its predictions with results obtained for synthetic, randomly generated networks.
The rest of the paper is organized as follows. In the next section we provide a more detailed description of our algorithm. In Section 3 we present results for two case studies that demonstrate the two-tier dynamics. In Section 4 we present an analytical framework for studying the dynamical properties for a binary iterative classifier. Discussion on our results and future developments are presented in Section 5.
2 Dynamics of for Iterative Classification
To understand the main idea behind our approach, we find it illustrative to frame the classification problem as an epidemic process. Specifically, let us consider a binary classification problem defined on a network where data-instances (from classes A and B) correspond to nodes and the relations between them are represented by (weighted) links. We are given the correct classification of a small subset of nodes from class A and want to classify other members of this class. Assume that we are using a simple, threshold based iterative relational classifier (such as one described below in Fig. 1), for assigning class labels and propagating them through the system. Now, if we treat the initially labelled data-instances as "infected", then the iterative scheme defines an epidemic model where at each time step new instances will be infected if the super-threshold classification criterion is met. Clearly, the fixed point of this epidemic process will depend both on the value of the threshold and both inter- and intra-class link structure of the network. In the case where two classes are totally decoupled (i.e., there are no cross-links between two sub-classes) the epidemics will be contained on the set A , and one can relax the classifier threshold to guarantee that all the instances of A will be correctly classified. If there are links between data-instances in different sub-classes, then there is a chance that the nodes from class B will be infected too (i.e., misclassified). However, if the link patterns between two subclasses are sufficiently different, we can hope that the process of epidemic spreading in two systems will be separated in time. Moreover, by tuning the classification threshold, we can control the rate of epidemic spreading in subpopulation A, hence affecting the epidemic spread in subpopulation B. The main idea of our approach is to tune the threshold parameter in order to achieve maximum temporal separation of epidemic peaks in two classes.
We characterize the dynamics of an iterative classifier by the number of newly classified instances at each time step, e.g., if N(t) is the total number of classified A-instances at time t, then the relevant variable is ∆N(t) = N(t)-N(t-1). As it will be clear later, two-tiered dynamics arises whenever ∆N(t) has two temporally separated peaks.
To proceed further, we now formally define our binary classification algorithm. Let S be the set of data-instances to be classified, and let assume that S is composed of two subsets SA ⊂ S and S-A = S \ SA. Initially, we know the correct class labels of a (small) subset of the instances of type A, S0A, and the problem is to identify other members of class SA given the characterizing relations between the entities across both types. We define Mij as the weight of the link between the i-th and j-th entities.
We associate a state variable with each entity, si = 0, 1
so that the state value si = 1 corresponds to type A. Initially, only the entities with known class labels have si = 1. At each iteration step, for each non-classified instance we calculate the cumulative weight of the links of that instance with known instances of type A. If this cumulative weight is greater or equal than a preestablished thresholdH, that instance will be classified as a type A itself. This is shown schematically in Figure 1. Note that our algorithm differs slightly from other simple relational classifiers (such as Relational Neighbor classifier [Macskassy and Provost, 2003]) in two aspects: First, it directly assigns class labels and not probabilities, and second, it is asymmetric in the sense that if an instance was classified as type A it will remain in that class for the remainder of the run. This later property implies that the total number of classified A-instance is a monotonically non-decreasing function of time. If the number of iterations
input adjacency matrix M initialize si = 1, for initially known instances, si = 0 for the rest initialize a threshold H iterate t = 0 : Tmax for i-th node with si(t) = 0 calculate the weight wi of adversary nodes connected to it: wi = ∑ Mijsj(t) if wi ≥ H ⇒ si(t + 1) = 1 end for loop endTmax is large enough, then a steady state will be achieved, i.e., no instance will change its state upon further iterations. As we mentioned above, the final state of the system will depend on the threshold value and the adjacency matrix. If the threshold value is set sufficiently low then the system will evolve to a state where every instance has been classified as type A. On the other hand, if it is set too high, then no additional instances will be classified at all. As we will show below, for intermediary values of the threshold H the system will demonstrate two-tier dynamics.
3 Case Studies
In this section we test our hypothesis empirically on two distinct and unrelated data-sets: The first is a synthetic data generated by the Hats Simulator [Cohen and Morrison, 2004], and the second is Cora [McCallum et al., 2000], a large collection of research papers in computer science.
3.1 Results for the Hats Simulator Data
The Hats simulator is a framework designed for developing and testing various intelligence analysis tools. It simulates a virtual world where a large number of agents are engaged in individual and collective activities. Each agent has a set of elementary capabilities which he can trade with other agents if desired. Most of the agents are benign while some are covert adversaries that intend to inflict harm by destroying certain landmarks called beacons. There also are agents known to be adversaries. Agents travel for meetings that are planned by an activities generator. Each agent belongs to one or more organizations that can be of two types, benign or adversary. Each adversary agent belongs to at least one adversary organization, while each benign agent belongs to at least one benign organization and does not belong to any adversary organization. When a meeting is planned, the list of participants is drawn from the set of agents that belong to the same organization. Hence, a meeting planned by an adversary organization will consist of only adversary (either known or covert) agents, whereas a meeting planned by a benign organization might contain all three types of agents.
The type of data from the Hats simulator is a sequence of lists containing unique hat ID-s that have met with each other. Given this sequence, one can unequivocally construct a graph (adjacency matrix) M of hats' meeting activities, where each entry Mij describes the number of meetings between the ith and j-th agents (note that the graph is not directed so the matrix is symmetric). In the simulations presented here we used Hats data for N = 1200 agents, (Nk = 50 known adversaries, Nb = 1000 benign, and Nc = 150 covert) which was collected for the first 2500 ticks of simulations.
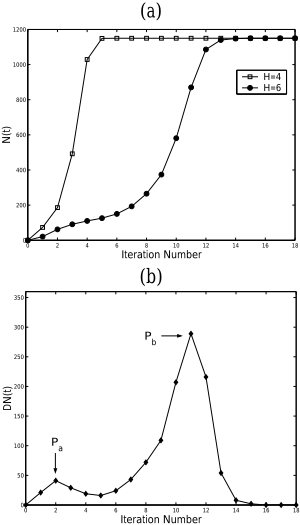
We tested our algorithm for small, large, and intermediate values of the threshold H. For small H most of the nodes in the network are infected after a short time, as expected (see Fig. 2). Similarly, for large values of H (not shown here) the epidemic spreads through only a very small subset of nodes. In both cases the epidemics are characterized by onetier dynamics. The situation is drastically different for intermediate values of the threshold, as the behavior of epidemic spreading demonstrates two-tiered structure. Namely, after a sharp initial spread the epidemic seems to be saturated. However, upon further iterations, the number of infected nodes increases sharply, and all the nodes in the network are infected shortly thereafter. Clearly, this corresponds to some kind of threshold-phenomenon in the whole network, where infection of certain nodes causes an epidemic in the whole system. This is illustrated in Fig. 2(a) where we plot the number of infected actors vs time for H = 4 and H = 6. As we mentioned in the introduction, this behavior suggests a natural criterion for stopping the iteration. More precisely, in Fig. 2(b) we plot the number of newly infected nodes at each times step versus time, i.e., ∆N(t) = N(t) -N(t -1). For the threshold value H = 4 (not plotted) there is only a single peak in ∆N(t). However, for H = 6 one can distinguish two well-separated peaks, denoted Pa and Pb which are indicative of two-tier dynamics in epidemic spreading. If we assume that Pa corresponds to the epidemic spreading in the first (covert) sub-population, and Pb corresponds to the rest of the network, then the iteration should be stopped right before the infection starts to spread in the rest of the system (i.e., at t = 5). In this particular example, we established that if the above mentioned criterion is used, then the algorithm correctly identifies 118 out of 150 covert adversaries, while at the same time misidentifying only 8 of the 1000 benign nodes as adversaries. This is a surprising result especially taking into account the simplicity of the algorithm.
More generally, our experiments with the Hats data indicate that although the detection error rate of the algorithm varies depending on the particular structure of the network, the amount of the available data, as well as the presence of noise, its performance is rather robust as long as the two-tier dynamics is observed.
3.2 Results for Cora Data
The Cora data [McCallum et al., 2000] contains a set of computer science research papers that are hierarchically categorized into topics and subtopics. Each paper includes a label for a topic/subtopic/sub-subtopic, and a list of cited articles. Following the previous studies [Macskassy and Provost, 2003], we focused on the papers on Machine Learning category, that contained seven different subtopics: Case-Based, Theory, Genetic Algorithms, Probabilistic Methods, Neural Networks, Rule Learning and Reinforcement Learning. Two papers are linked together by using common author (or authors) and citation.
Since our algorithm is for binary classification, we constructed separate classification problem for each topic. We varied the fraction of known instances from as high as 50% to as low as 2%. For each classification task, we did up to 10 different runs using random subsets of classified hats. Note, that initially labelled set contained papers that belong to a class other than one we wanted to identify (the class label of all the papers in the initially labelled sets were fixed throughout iteration.
After pruning out the isolated papers from the data-set, we were left with 4025 unique titles. Since we observed a large dispersion in the node connectivity ranging from 1 to more than 100, we revised our threshold-based rule a little so that the threshold condition was established not only for the total weight, but also on the fraction of that weight.
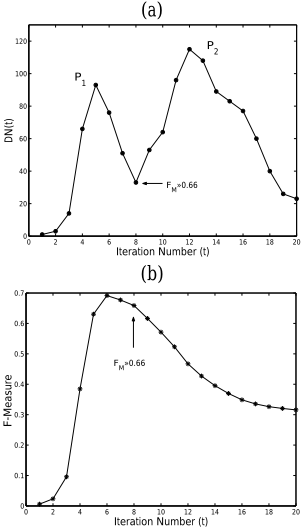
We observed that the structure of dynamics (i.e., twotier vs single-tier) varied from topic to topic. From the seven subtopics, the data that demonstrated the best manifestation of two-tiered dynamics was Reinforcement Learning subtopic: it robustly demonstrated two separate peaks from run to run for various fraction of initially known data as shown in Fig 3(a). What is more striking, however, is that the accuracy of classification was remarkable even if the fraction of initially known instances were as low as 2% of the total number. Indeed, as illustrated in Fig 3(b), for 2% of initially known class-labels, and from which only 7 in the Reinforcement Learning Topic, the F-Measure at the iteration-stopping point t = 8 is FM ≈ 0.66. Moreover, our experiments also suggest that increasing the number of initially labelled data does not necessarily improve the performance. Although this seems counterintuitive, it makes sense from the perspective of our algorithm: Indeed, the more labelled instances we have at the start, the better the chances that the epidemics will leave the sub-network and start to infect nodes from other classes. One could think of increasing the threshold would help, but it did not, probably because of large dispersion in node connectivity. Of course, one can always sample from available known instances and choose to include only an appropriate number of them.
We observed two-tier structures in most of the other topics too. Although some of them were not as pronounce as for the previous case, they were robust in the sense that uprise of the second peak almost surely corresponded with the spread of label-propagation outside of that class. However, in some instances, notably for the Neural Networks subtopic, we did not observe any clear sign of this dynamics at all. Our explanation is that this subcategory was vastly larger than the RL-one (1269 compared to 344) so it was easier for the initial infection to propagate outside. This suggests that perhaps our method is best when one wants to identify a sub-class that is considerably smaller compared to the total number of instances.
4 Analysis
In this section we present an analysis of our classification algorithm. Specifically, we study the epidemics spreading as described by our algorithm. For the sake of simplicity, we consider a case of an unweighed graph when the entries in the adjacency matrix are either 0 or 1. Generalization to the case of the weighed networks is straightforward. Also, for clarity purposes we will retain the language of section 3.1 and refer to instances as agents.
Let us start by considering only one of the subnetworks in the system. Namely, we neglect benign agents for now and consider a network consisting of covert and known adversaries only. We want to examine how the epidemic spreads through the covert population.
We now consider the iterative procedure more closely. Initially, all of the agents except known adversaries are classified as not-infected, si(t = 0) = 0, i = 1, 2, ..N. We define a local field hi for the i-th agents as the number of its connections with known adversaries. We assume that hi-s are uncorrelated random variables drawn from a probability density function P(h). Let f(h) = ∑h′≥h P(h′ ) be the the fraction of agents who are connected with at least h initially known adversary agents. Also, let ki be the number of connections the i-th agent has with newly classified adversaries (note that ki excludes the links to the initially known adversaries) and assume that ki-s are described by a probability density function P(k; t). In other words, P(k; t) is the probability that a randomly chosen uninfected covert agent at time t is connected to exactly k infected covert agents. Since the number of infected agents changes in time, so does the distribution P(k; t). Initially, one has P(k; t = 0) = δk,0, where δij is the Kroenecker's symbol. 1 .
In the first step of the iteration, the agents who have a local field larger than or equal to the threshold value, hi ≥ H, will change their states to 1. Hence, the fraction of agents classified as adversaries at t = 1 is n(t = 1) = f(H). Since these new adversary agents are connected to other non-classified agents, this will alter the local fields for non-classified agents. Let us define a variable for each agent zi = hi +ki. Then the distribution of zi is described by
1 Kroenecker's symbol is defined as follows: δij = 1 if i = j and δij = 0, i ̸= j.
Clearly, the criterion for infection is zi ≥ H. Hence, the fraction of agents that will be classified as covert at time t+1 is
Note that the probability P(k; t) of being connected to an infected agent depends on the fraction of infected agents, P(k; t) = P(k; n(t)) . Hence, the Equation 2 is in general a highly non-linear map. Once the functions P(k; t) and f(h) are specified, Equation 2 can be solved (at least numerically) to study the dynamics of epidemic spreading in a homogenous, single-population network. In particular, the final fraction of infected agents is given by its steady state n(t →∞).
The above framework is easily generalized for the case when there are two sub-populations in the network. We denote two sub-populations by C (covert) and B (benign). Let fc(h) fb(h) be the fraction of C and B agents respectively that are connected to at least h known adversaries. Also, let Pcc(k; t) and Pcb(k; t) be the probability that a randomly chosen C agent is connected to exactly k infected C and infected B agents, respectively. Similarly, we define Pbb(k; t) and Pbc(k; t) as the probability that a randomly chosen B agent is connected to k infected B and infected C agents, respectively. Then the fraction of infected agents in each population nc(t) and nb(t) satisfy the following set of equations:
To proceed further we need to make assumptions about the distribution functions Pcc(k; t), Pbb(k; t), Pcb(k; t) and Pbc(k; t) i.e., probability that a randomly chosen uninfected agent of type C (B) is connected to k infected agents of respective type. This is particularly easy to do when the graph is obtained by randomly establishing a link between any two agents/nodes with a fixed probability. Specifically, let us assume that each covert agent is connected to covert and benign agents with corresponding probabilities pcc and pcb, while each benign agent has similarly defined probabilities pbb and pbc (note that pcb = pbc). Hence, each covert agent in average is connected with γcc = pccNc covert and γcb = pcbNb benign agents, and each benign agent is connected with γbb = pbbNb benign and γbc = pbcNb benign agents.
Consider now a randomly chosen uninfected agent of either type, say, covert, at a certain time t, and denote it as c0. There are Ncnc(t) infected covert agents at time t, and c0 is connected with each of them with probability pcc. Hence, the probability Pcc(k; t) that c0 is connected with exactly k infected covert agents at time t is given by a Poisson distribution with a mean γccnc(t). Similar arguments hold also for Pbb(k; t), Pcb(k; t) and Pbc(k; t). Hence, one obtains from the Equation 3
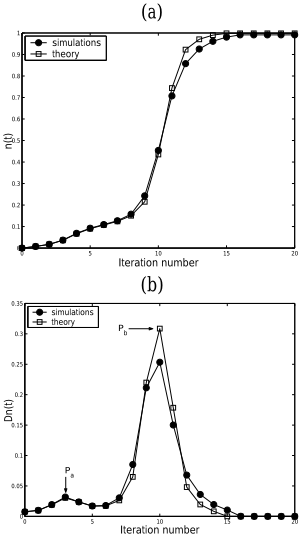
Equations 4 and 5 are a system of coupled maps that governs the evolution of fraction of infected individuals in both sub-populations. The coupling strength depends on γcb and γbc , or in other words, average number of interconnections between two sub-populations. Note that if one sets γcb = γbc = 0 the dynamics of two sub-populations are totally independent and one recovers the system Equation2 with corresponding parameters for each sub-population. To validate the prediction of our analysis, we compared Equations 4 and 5 with experiments on randomly generated graphs. The results are shown in Fig. 4 where we plot the fraction of the infected nodes n(t) = nc(t) + nb(t) as well as the difference ∆n(t) = n(t + 1) - n(t) versus iteration number for a randomly generated graph of Nc = 100 covert and Nb = 1000 benign nodes. The parameters of the graph are pcc = 0.2, pbb = 0.04 and pcb = 0.04. Also, we chose the value of the threshold field such that to ensure two-tier dynamics. The results of the simulations were averaged over 100 random realization of graphs. Clearly, the agreement between the analytical prediction given by equations 4 and 5 and the results of the simulations is quite good. In particular, these equations accurately predicts the two-tier dynamics observed in the simulations. We also note that the graphs are structurally very similar to the results from the Hats simulator data in Fig. 2. This suggests that despite the the explicit organizational structure in the Hats data, its infection dynamics is well captured by a simple random-graph analysis model. Note however, that this agreement might deteriorate for more complex organizational structure (e.g., large overlap between different organizations), hence more sophisticated analytical models might be needed.
5 Discussion and Future Work
We have presented a simple, threshold based iterative algorithm for binary classification of relational data. Our algorithm can be stated in terms of epidemic spreading in networks with two sub-populations of nodes (data-instances) where infected nodes correspond labelled data-instances. We also presented a meta-heuristics that utilizes the differences in the propagation of true and false class-labels for setting the right threshold value in our algorithm. Specifically, we demonstrated that if the threshold value is tuned appropriately, the dynamics of the number of newly classified instances will have a two-peak structure suggesting that the infection propagation in two sub-classes is time-separated. Consequently, we suggested that the iteration should be stopped at the point when the second peaks starts to develop.
Our empirical tests, especially with Cora, indicate that the two-tier dynamics is not an artifact, but is present in real world relational data. Although we did not observe this dynamics in all the classification tasks in Cora, our results nevertheless indicate that whenever the two-tier dynamics is present, it is indeed robust, and contains useful information that can be utilized by classification algorithm. In addition, our experiments, as well as qualitative arguments on epidemic spreading, suggest that the method presented in this paper should work best when the sub-class one wants to identify is a small fraction of the whole data-set, as there is a greater chance that the class-labels will propagate throughout the proper sub-population first before infecting instances of other classes.
We also developed an analytical framework for studying the properties of iterative classification. In particular, we obtained a coupled of set discrete-time maps the describe the evolution infected/labelled individuals in both subpopulations. We compared our analytical results with numerical experiments on synthetic data and obtained excellent agreement. We would like to mention that the assumption of a random graph we used in our analysis is clearly an over-simplification. Indeed, most of the real-world relational structures (e.g., social networks) demonstrate smallworld phenomenon that is not captured by our random graph model. In our future work we intend to extend our framework to account for more general type of networks. Note that in this scenario the probability of being infected will be strongly correlated with a degree of a node (i.e., more links will imply more chances of being infected).
6 Acknowledgements
We thank Joshua Moody for preparing the Hats data.
@inproceedings{ijcai2005p224,
  title     = {Inferring Useful Heuristics from the Dynamics of Iterative Relational Classifiers},
  author    = {Galstyan, Aram and Cohen, Paul R.},
  booktitle = {Proceedings of the Nineteenth International Joint Conference on
               Artificial Intelligence, {IJCAI-05}},
  publisher = {International Joint Conferences on Artificial Intelligence},
  editor    = {Leslie Pack Kaelbling and Alessandro Saffiotti},
  pages     = {708--712},
  year      = {2005},
  url       = {https://ijcai.org/proceedings/2005/224},
}
TY - CPAPER TI - Inferring Useful Heuristics from the Dynamics of Iterative Relational Classifiers AU - Galstyan, Aram AU - Cohen, Paul R. T2 - Proceedings of the Nineteenth International Joint Conference on Artificial Intelligence, IJCAI-05 PB - International Joint Conferences on Artificial Intelligence PY - 2005 SP - 708 EP - 712 UR - https://ijcai.org/proceedings/2005/224 ER -Copied
Machine-readable versions of this paper, for tools and AI agents:





