
Discrimination of Semi-Quantitative Models by Experiment Selection: Method and Application in Population Biology
Proceedings of the Seventeenth International Joint Conference on Artificial Intelligence. Pages 74-81.
© 2001 International Joint Conferences on Artificial Intelligence
Abstract
Modeling an experimental system often results in a number of alternative models that are justified equally well by the experimental data. In order to discriminate between these models, additional experiments are needed. We present a method for the discrimination of models in the form of semiquantitative differential equations. The method is a generalization of previous work in model discrimination. It is based on an entropy criterion for the selection of the most informative experiment which can handle cases where the models predict multiple qualitative behaviors. The applicability of the method is demonstrated on a real-life example, the discrimination of a set of competing models of the growth of phytoplankton in a bioreactor.
- [Berleant and Kuipers, 1997] D. Berleant and B. Kuipers. Qualitative and quantitative simulation: Bridging the gap. Artif. Intell., 95:215-256, 1997.
- [Bernard and Gouzé, 1995] O. Bernard and J.-L. Gouzé. Transient behavior of biological loop models with applica- tion to the Droop model. Math. Biosci., 127:19-43, 1995.
- [Caperon and Meyer, 1972] J. Caperon and J. Meyer. Nitrogen-limited growth of marine phytoplankton.I. Changes in population characteristics with steady-state growth rate. Deep-Sea Res., 19:601-618, 1972.
- [Contois, 1959] D.E. Contois. Kinetics of bacterial growth: relationship between population density and specific growth rate of continuous cultures. J. Gen. Microbiol., 21:40-50, 1959.
- [Cooney and McDonald, 1995] M.J. Cooney and K.A. Mc- Donald. Optimal dynamic experiments for bioreactor model discrimination. Appl. Microbiol. Biot., 43:826-837, 1995.
- [de Kleer, 1990] J. de Kleer. Using crude probability esti- mates to guide diagnosis. Artif. Intell., 45:381-391, 1990.
- Droop, 1968
- M.R. Droop. Vitamin B12 and marine ecol- ogy. IV. The kinetics of uptake growth and inhibition in Monochrysis lutheri. J. Mar. Biol. Assoc., 48(3):689-733, 1968.
- [Espie and Macchietto, 1989] D. Espie and S. Macchietto. The optimal design of dynamic experiments. AIChE, 35(2):223-229, 1989.
- [Fedorov, 1972] V.V. Fedorov. Theory of Optimal Experi- ments. Academic Press, 1972.
- [Kuipers, 1994] B. Kuipers. Qualitative Reasoning. MIT Press, 1994.
- [Monod, 1942] J. Monod. Recherches sur la croissance des cultures bactériennes. Herman and Cie, 1942.
- [Struss, 1994] P. Struss. Testing for discrimination of diag- noses. In Working notes DX-94, 1994.
- [Vatcheva and de Jong, 1999] I. Vatcheva and H. de Jong. Semi-quantitative comparative analysis. In Proceedings IJCAI'99, pages 1034-1040, 1999. IJCAI
- [Vatcheva et al., 2000] I. Vatcheva, H. de Jong, and N.J.I. Mars. Selection of perturbation experiments for model dis- crimination. In Proceedings ECAI-2000, pages 191-195, 2000.
References were extracted automatically from the PDF and may contain errors.
Full text extracted automatically from the PDF; figures, tables and equations may differ. The PDF is the version of record.
1 Introduction
Obtaining an adequate model of an experimental system is a laborious and error-prone task. In many cases one arrives at a number of rival models that are justified equally well by the experimental data. In order to discriminate between these models, additional experiments are needed. Since in real-life applications the number of experiments to perform may be quite large, and the costs of each of them considerable, it is important that the experiments be selected carefully. In fact, experiments need to be chosen such that the set of possible models is maximally reduced at minimal costs.
For experimental systems described by differential equations, several approaches for model discrimination have been proposed in the literature (e.g. [Espie andMacchietto, 1989]). With few exceptions (e.g. [Struss, 1994; Vatcheva et al., 2000]), these methods apply to completely specified quantitative models. That is, they cannot be used when precise numerical values for the parameters are not available and the precise form of functional relations is unknown.
This has motivated the development of a method for model discrimination that is able to handle incompletely specified models in the form of semi-quantitative differential equations (SQDEs). The method is based on an entropy criterion for the selection of the most informative discriminatory experiment. This experiment is determined from the behavioral predictions obtained from the competing models through simulation under various experimental conditions.
In earlier work, we have developed a method for the discrimination of semi-quantitative models [Vatcheva et al., 2000]. However, the previously proposed approach is restricted to the case that all models predict the same qualitative behavior, a situation rarely occuring in the case of more complex models. The method described in this paper is a generalization of the approach above in that it allows one to deal with situations in which multiple qualitative behaviors are predicted.
The applicability of the method is demonstrated on a real problem in population biology, the selection of experiments to discriminate between competing models of the growth of phytoplankton in a bioreactor. The choice of good discriminatory experiments is critical in this application, since the experiments may take several weeks to complete. Semiquantitative models are appropriate, because the available data is incomplete and imprecise, as for most biological systems. We have compared the optimal experiment as determined by our method with an experiment that has been actually carried out. Furthermore, taking into account the results of the latter experiment, the best next experiment to perform has been suggested.
The paper is organized as follows. The next section deals with the basic concepts of semi-quantitative modeling and simulation. Sec. 3 gives an outline of the method for model discrimination, focusing on the criterion for selecting the most informative experiment. The results of the application of the method to the modeling of phytoplankton growth in a bioreactor are presented in Sec. 4. The final section discusses achievements and limitations of our work in the context of related work on model discrimination and gives some perspectives on further research.
2 Semi-quantitative modeling and simulation
Semi-quantitative differential equations (SQDEs) are abstractions of ordinary differential equations (ODEs) that allow incompletely or imprecisely specified dynamical systems to be modeled [Berleant and Kuipers, 1997]. In an SQDE, bounding envelopes are defined for unknown functions, as well as numerical intervals to bound the values of parameters and initial conditions.
Fig. 1 shows an example of a second-order SQDE describing the growth of the microalgae Dunaliella tertiolecta under
Monod
Figure 1: An example of an SQDE describing the growth of phytoplankton in a bioreactor, the Monod model. The physical meaning of the variables and parameters is given in the caption of Fig. 3.
nutrient limitation in a bioreactor [Monod, 1942]. The state variables are the biomass x and the concentration of the limiting nutrient s. The intervals bounding the model parameters µmax, ks, and y have been estimated from preliminary experiments.
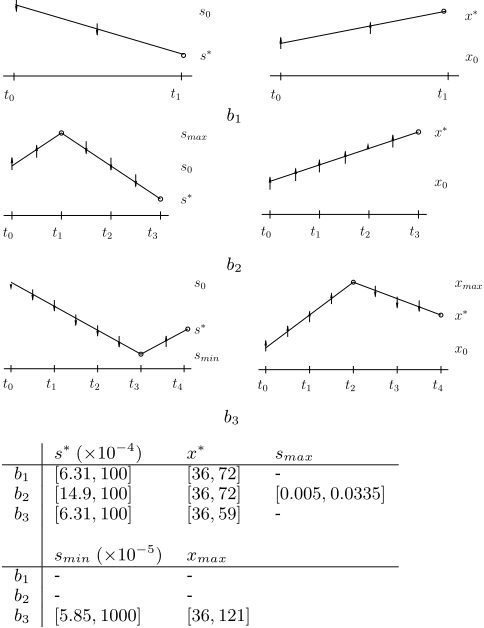
For the simulation of SQDEs we employ the techniques Q2+Q3 [Berleant and Kuipers, 1997], which refine the qualitative behavior tree produced by the QSIM algorithm [Kuipers, 1994]. The results of semi-quantitative simulation consist of one or more qualitative behaviors supplemented by ranges for the values of the variables at qualitatively significant time-points. The behaviors resulting from the simulation of the SQDE in Fig. 1 are shown in Fig. 2. In order to narrow down the interval predictions, we use the comparative analysis technique SQCA [Vatcheva and de Jong, 1999]. SQCA refines the simulation results by comparing a behavior predicted for one experiment with behaviors predicted for related experiments.
3 Method for model discrimination
The predictions obtained through semi-quantitative simulation can be exploited to maximally discriminate a set of competing models against minimal costs. The method for achieving this is based on a generalization of the entropy criterion for the most informative experiment developed in [Vatcheva et al., 2000].
3.1 Model discrimination and behavior predictions
Consider a set M of competing models of an experimental system. Each mi ∈ M has a probability p(mi) to be the correct model of the system, and we assume that ∑mi∈M p(mi) = 1 [Fedorov, 1972]. The a priori model probabilities are estimated from data obtained in preliminary experiments or assumed equal when no such data exist. Each time an experiment is executed, and new data becomes available, the model probabilities are being updated. If the data does not justify the predictions of some mi, its a posteriori probability becomes zero.
For the discrimination of the models in M, experiments from a set E of experiments need to be selected. The experiment that discriminates best between the models is estimated from the model predictions. For each experiment e ∈ E, the models in M are perturbed according to e, and then simulated to predict the behavior of the system under the experimental conditions. The prediction of mi for some e is a set of behaviors Be i . The set of all qualitatively distinct behaviors resulting from the simulation of the models in M for e is denoted by Be .
For discrimination purposes, only certain characteristics of the predicted behaviors b ∈ Be are taken into account. This gives rise to a set of behavioral features Fb for b. The set of behavioral feature consists of minima, maxima and equilibria of the system variables. The behavioral features defined for b3 in Fig. 2, for instance, are the maximum of x and the minimum of s (xmax and smin), and the steady state levels of these variables (s∗ and x∗ ). Here we will assume that the value of a behavioral feature is an interval.
Intuitively, the experiment that can be expected to optimally discriminate between the models is the experiment for which the predicted values of the behavioral features overlap least. This intuition will be formalized below by defining the most informative experiment. A set of competing models can then be discriminated by repeatedly determining the most informative experiment, performing this experiment, and updating the model probabilities in the light of the outcomes.
3.2 Criterion for most informative experiment
A standard measure in information theory is the information increment of an experiment [Fedorov, 1972]. For every experiment e ∈ E we define
where p(mi) and p(mi | be , Y e ) are the a priori and a posteriori probabilities of mi. be is the behavior of the system observed in e, and Y e is the vector of observations for the behavioral features Fbe . The observations are assumed to be intervals Y e j = [ye j - εj/2, ye j + εj/2], where ye j is the midpoint, and εj is the estimated size of the confidence interval for the jth behavioral feature. For clarity of presentation, we will assume for the moment, that each behavior b is characterized by a single feature.
∆H reaches its maximum when all posterior probabilities but one are zero. That is, when the observations obtained in e confirm the predictions of a single model. On the other hand, a minimal value is attained, when all posterior probabilities are equal.
Since the a posteriori probabilities of the models depend on the outcome of the experiment which is not yet known, ∆H cannot be computed directly. Instead, we can compute its expected value, or the expected information increment of e:
where Be is the set of predicted behaviors, Y = [y-ε/2, y+ ε/2], D the domain of the behavioral feature, and g e (y, b) its probability distribution:
p(b|mi) is the probability of behavior b provided mi is the correct model of the system, and g e i (y, b) is the modelspecific probability distribution of the behavioral feature, defined by
with V e i the interval prediction of mi for the behavioral feature in experiment e, and | · | denoting interval length.
ge i (y, b) expresses the probability that the value of the behavioral feature is Y , if mi is the correct model of the system and b is the system behavior. If the interval Y does not overlap with the model prediction V e i , the probability of the feature having value Y is zero. Otherwise, the probability is weighted according to the size of the overlap between Y and V e i .
By substituting the expression for ∆H in (2) and using the Bayes' rule
we arrive at the following expression for the expected information increment of an experiment e:
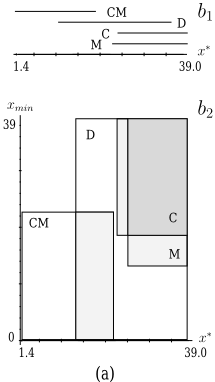
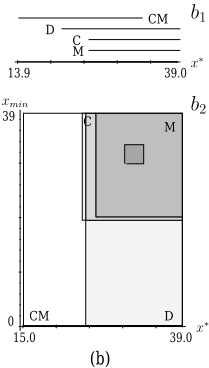
The criterion ranks the experiments in E according to their expected informativeness. The optimal discriminatory experiment will be the most informative experiment, that is, the experiments for which ∆J(e) is maximal. Intuitively, experiments which give rise to predictions as different as possible will be favored. Fig. 4(a)-(b) shows the predictions of the four models given in Figs. 1 and 3 for two different experiments (see next section). In both cases, each of the models predicts two possible qualitative behaviors for the biomass x. The expected information increment for the first experiment, however, is higher than the expected information increment for the second (∆J = 0.5927 versus ∆J = 0.3290), as the predicted intervals overlap less.
The expression for ∆J can be simplified in a number of cases. For instance, if all models predict for a given experiment e the same qualitative behavior, (3) can be reduced to
which is the criterion previously derived by [Vatcheva et al., 2000].
On the other hand, if for a given e, each model predicts a different set of qualitative behaviors, we obtain:
which is the maximum value ∆J(e) can take.
The criterion (3) is easily generalizable to the case when each behavior b is characterized by more than one feature. In this case we have to substitute the probability distributions by joint probability distributions, and the integral by a multiple integral of the k behavioral features. For computational simplicity, we assume in this article that the behavioral features are independent.
The algorithms for the simulation of SQDEs, outlined in the previous section have been proven sound. That is, all possible predictions are derived from a given SQDE model. If Contois Droop Caperon-Meyer
y ∈ [0.15, 0.6], kx ∈ [0.00014, 0.0167], ¯µ ∈ [1.7, 2.3], kq ∈ [1.6, 2.0], µmax ∈ [1.2, 1.6], ρmax ∈ [9.25, 9.55], k0 ∈ [2.0, 2.4]
Figure 3: Models for the growth of phytoplankton in a bioreactor. x is the amount of biomass per unit volume, s[µmol/l] the nutrient concentration, q[µmol/l] the internal quota. The Monod and Contois models assume constant growth yield y[l/µmol]. µmax[day-1] is the maximum growth rate of cells, and ¯µ[day-1] a theoretical maximum growth rate obtained for infinite quota. ks, kx, and k0[µmol/l] are half-saturation constants, kq[µmol/l] is the minimum cell quota, ρmax[µmol/l/day] is the maximum uptake rate of nutrients. For all models sin ∈ [80, 120][µmol/l] is the input nutrient concentration, and d[day -1 ] the dilution rate to be controlled in the experiments. The initial conditions are x0 ∈ [36.0, 39.0], s0 ∈ [0.005, 0.01], q0 ∈ [2.4, 2.7] which are the equilibrium values reached for the initial dilution rate d0 = 0.4.
the results obtained in the experiment are correct, this guarantees that a model will never be falsely rejected. However, these algorithms do not exclude spurious predictions. As a consequence, an experimental result may corroborate a model while it should be ruled out. Spurious predictions, therefore, may prolong the discrimination process.
3.3 Computation of behavior probabilities
In order to compute ∆J(e), the conditional behavior probabilities p(bj|mi) must be estimated. We have adopted the following approach. Let vl be a parameter or initial condition in model mi, and let range(vl, bj) be the interval value of vl for which behavior bj is obtained. Define
p(bj |mi) = r(bj |mi)/ ∑bk∈Be Consider, for instance, the three behaviors given in Fig. 2. b1, b2 and b3 have been obtained for different subintervals of the interval ranges for ks and y:
∏l | ⋃bk∈Be r(bj |mi) estimates the fraction of the interval volume of the model parameters which gives rise to bj. The conditional probability of bj is now given by normalizing the r(bj |mi)s: i r(bk|mi).
| beh | ks | y |
|---|---|---|
| b1 | [0.01, 0.158] | [0.3, 0.6] |
| b2 | [0.0236, 0.158] | [0.3, 0.6] |
| b3 | [0.01, 0.158] | [0.15, 0.488] |
By using these values, the procedure outlined above gives r(b1) = 0.67, r(b2) = 0.61, r(b3) = 0.75. Consequently, the behavior probabilities can be computed: p(b1) = 0.33, p(b2) = 0.30, p(b3) = 0.37.
4 Application: phytoplankton growth
Understanding the regulation of phytoplankton growth is essential for predicting how life in the ocean may respond to climate changes. As these processes are difficult to study in the open sea, the growth conditions are recreated in the laboratory in a bioreactor.
A variety of models can be used to describe the growth of phytoplankton in a bioreactor. Which of these applies best in a given situation cannot be determined on a priori grounds. Therefore, experiments need to be performed to discriminate between the alternative models. Unfortunately, these experiments may take weeks to complete and are thus quite costly to perform.
We have applied the method of the previous section in the context of the microalgae D. tertiolecta, carried out by population biologists in a marine laboratory. Four alternative models to describe the system have been considered, which are shown in Figs. 1 and 3. The models make different assumptions about the nutrient consumption, the influence of the biomass on the growth rate of the population, and the relation between growth and uptake rates. The models are labeled after their originators: M [Monod, 1942], C [Contois, 1959], D [Droop, 1968], and CM [Caperon and Meyer, 1972].
Because of coarse and noisy data, and evolution of the system in the time frame of the experiment, precise numerical estimations for the values of the parameters cannot be obtained. This motivates the use of semi-quantitative models. The interval values for the parameters required in the SQDEs have been estimated by the biologists, based on the outcome of preliminary experiments (see Fig. 3).
In order to discriminate between the competing models, the value of the dilution rate d can be varied by the experimenter. Starting from an equilibrium, the dilution rate is changed and the transient behavior of the system towards a new equilibrium is observed. We have considered ten experiments, corresponding to equispaced values in the range [0, 1.2]: d = 0.1, d = 0.2, . . . . Taking into account 5% measurement uncertainty, the values of d become intervals.
| d = 0.1 | d = 0.2 | d = 0.3 | d = 0.5 | d = 0.6 | |
|---|---|---|---|---|---|
| ∆J | 0.3204 | 0.3181 | 0.3519 | 0.3547 | 0.3323 |
| d = 0.7 | d = 0.8 | d = 0.9 | d = 1.0 | d = 1.1 | |
| ∆J | 0.3290 | 0.3710 | 0.4668 | 0.5093 | 0.5927 |
| d = 1.1 | d = 0.7 | d = 0.1 | ||||
|---|---|---|---|---|---|---|
| p(b1) | p(b2) | p(b1) | p(b2) | p(b1) | p(b2) | |
| M | 0.47 | 0.53 | 0.47 | 0.53 | 0.50 | 0.50 |
| C | 0.47 | 0.53 | 0.47 | 0.53 | 0.51 | 0.49 |
| D | 0.57 | 0.43 | 0.57 | 0.43 | 0.54 | 0.46 |
| CM | 0.57 | 0.43 | 0.57 | 0.43 | 0.27 | 0.73 |
The only variable that can be reliably measured in the course of the experiment is the biomass x. This determines the behavioral features that we have considered: the minimum and the maximum value of x (xmin and xmax), and the equilibrium value of x (x∗ ). In order to obtain the predicted values of the behavioral features required for the determination of the most informative experiment, the models have been simulated using the techniques in Sec. 2. For each experiment, all models predict multiple qualitative behaviors as a consequence of the large intervals for the parameter values. In total, four different behaviors for x are predicted. None of these behaviors is spurious, as we have been able to establish by comparing the predictions with the qualitative analysis of [Bernard and Gouz´e, 1995].
Starting from the assumption that the models are equiprobable in the beginning, we have calculated the expected information increment (3) for each of the experiments (Table 1). The optimal discriminatory experiment is predicted to be d = 1.1. For this experiment, each of the four models predicts two behaviors, b1 and b2, that differ with respect to the observable variable x. In b1 the equilibrium of the system is reached asymptotically, whereas in b2, x reaches a minimum before the equilibrium is attained. Fig. 4(a) shows the interval predictions of the behavioral features for all four models, and Table 2 lists the corresponding conditional behavior probabilities. Notice that in b1 only one behavioral feature applies (x∗ ), whereas in b2 predictions for x∗ and xmin need to be taken into account.
The experiment d = 1.1 has not been performed, but data for the suboptimal experiment d = 0.7 was available from an earlier study. The predictions of the behavioral features for this experiment are shown in Fig. 4(b) and the behavior probabilities are given in Table 2.
In the experiment d = 0.7, x was found to reach its equilibrium after passing through a minimum. This rules out b1. The measured values of the behavioral features, shown in Fig. 4(b), are xmin = [29.2, 32.2], and x∗ = [30.5, 33.5]. Using these results, the a posteriori probabilities of the models have been computed via Bayes' rule: p(M) = 0.34,
- p(C) = 0.33, p(D) = 0.21, and p(CM) = 0.12. In addition, the measurements have allowed the parameter values to be refined by means of the constraint propagation algorithm in Q2 [Berleant and Kuipers, 1997].
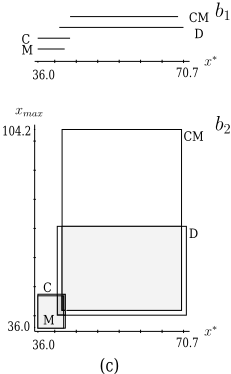
The new model probabilities show that experiment d = 0.7 has not been very discriminating. Given the new model probabilities and parameter values, what would be the optimal experiment to perform next? The method advises that d = 0.1 be tried, as it has the highest expected information increment (∆J = 0.7129). The predicted values for the behavioral features, again for two behaviors, are shown in Fig. 4(c). Table 2 gives the corresponding behavior probabilities. The experiment d = 0.1 has not been performed yet (we recall that each experiment takes weeks to complete). Notice, however, that d = 0.1 is likely to rule out at least two of the four models due to the lack of overlap between M - C and D - CM.
5 Discussion
We have proposed a method for the discrimination of semiquantitative models of an experimental system. The method is based on an entropy criterion for the selection of the most informative experiment. The value of ∆J for a particular experiment is calculated from the model predictions obtained through semi-quantitative simulation. The method generalizes upon a previous method [Vatcheva et al., 2000], in that it can handle cases where the models predict multiple qualitative behaviors. This occurs in the case of the phytoplankton growth models, which predict the biomass to asymptotically approach its equilibrium value or to pass through a maximum or a minimum first.
The applicability of the method has been demonstrated by having it predict the most informative experiment to discriminate between four models of the growth of D. tertiolecta in a bioreactor. This has been achieved in the presence of several complicating factors, in particular the nonlinearity of the models, the crude estimations of the parameter values, and the difficulty to observe the behavior of the system. The discrimination of bioreactor models has been attempted before [Espie and Macchietto, 1989; Cooney and McDonald, 1995], but unlike the method discussed in this paper, these approaches require precise numerical data to be available, a requirement that usually cannot be fulfilled in practice.
Within AI, methods for model discrimination have been developed in the field of model-based diagnosis (e.g., [Struss, 1994; de Kleer, 1990]). Basically, these methods determine which inputs need to be applied to a faulty device, and which measurements need to be made, in order to optimally discriminate between a number of diagnoses. In comparison with the approach in this paper, these methods have been adapted to qualitative models. By considering only qualitative distinctions, however, one may fail to discriminate between alternative behaviors. Although two models may predict the same qualitative behavior, their (semi-)quantitative predictions may be different, as clearly shown in Fig. 4.
For the discrimination of the phytoplankton growth models, only one type of experiment was available, a change in the dilution rate. It should be emphasized, though, that the method is not restricted to parameter changes and may even involve structural changes of the models. A limitation of the method, however, is that the set of experiments needs to be specified in advance. In the case of the dilution rate experiments, for instance, ten possible values from a continuous range have been selected. There is obviously no guarantee that the optimal value is included in the list of prespecified experiments. A subject for further research would therefore be to handle continuous ranges of experiments, and more generally, to move away from the selection of experiments to the design of experiments.
@inproceedings{ijcai2001p10,
  title     = {Discrimination of Semi-Quantitative Models by Experiment Selection: Method and Application in Population Biology},
  author    = {Vatcheva, Ivayla and Bernard, Olivier and de Jong, Hidde and Gouzé, Jean-Luc and Mars, Nicolaas J. I.},
  booktitle = {Proceedings of the Seventeenth International Joint Conference on
               Artificial Intelligence, {IJCAI-01}},
  publisher = {International Joint Conferences on Artificial Intelligence},
  editor    = {Bernhard Nebel},
  pages     = {74--81},
  year      = {2001},
  url       = {https://ijcai.org/proceedings/2001/10},
}
TY - CPAPER TI - Discrimination of Semi-Quantitative Models by Experiment Selection: Method and Application in Population Biology AU - Vatcheva, Ivayla AU - Bernard, Olivier AU - de Jong, Hidde AU - Gouzé, Jean-Luc AU - Mars, Nicolaas J. I. T2 - Proceedings of the Seventeenth International Joint Conference on Artificial Intelligence, IJCAI-01 PB - International Joint Conferences on Artificial Intelligence PY - 2001 SP - 74 EP - 81 UR - https://ijcai.org/proceedings/2001/10 ER -Copied
Machine-readable versions of this paper, for tools and AI agents:





