
Ensembles as a Sequence of Classifiers
Proceedings of the Fifteenth International Joint Conference on Artificial Intelligence. Learning. Pages 860-864.
© 1997 International Joint Conferences on Artificial Intelligence
Abstract
An ensemble is a classifier created by combining the predictions of multiple component classifiers. We present a new method for combining classifiers into an ensemble based on a simple estimation of each classifier's competen ce . The classifiers are grouped into an ordered list where each classifier has a corresponding threshold. To classify an example, the first classifier on the list is consulted and if that classifier's confidence for predicting the example is above the classifier's threshold, then that classifier's prediction is used. Otherwise, the next classifier and its threshold is consulted and so on. If none of the classifiers predicts the example above its confidence threshold then the class of the example is predicted by averaging all of the component classifier predictions. The key to this method is the selection of the confidence threshold for each classifier. We have implemented this method in a system called SEQUEL which has been applied to the task of recognizing volcanos in SAR images of Venus . In this domain, SEQUEL outperforms each individual classifier as well as the simple approach of using an ensemble constructed from the average prediction of all the classifiers.
- [Breiman, 1996] L. Breiman. Bagging predictors. Ma- chine Learning, 24(2) :123-140, 1996.
- [Burl et al., 1994] M.C. Burl, U.M . Fayyad, P. Perona, P. Smyth, and M.P. Burl. Automating the hunt for volcanos on venus. In Proceedings of the 1994 Computer Vision and Pattern R ecognition Confer- ence, CVPR-94 , pages 302-309, Los Alamitos, CA, 1994.
- [Burl et al., 1996] M.C. Burl, U.M. Fayyad, P. Perona, and P. Smyth. Trainable cataloging for digital image libraries with application to volcano detection. Tech- nical Report Computation and Neural Systems, Cali- fornia Institute of Technology, Pasadena, CA, 1996.
- [Clemen, 1989] R. Clemen. Combining forecasts: A re- view and annotated bibliography. International Jour- nal of Forecasting, 5:559-583, 1989.
- [Drucker et al., 1994] H. Drucker, C . Cortes, L. Jackel, Y. LeCun, and V. Vapnik. Boosting and other machine learning algorithms. In Proceedings of the Eleventh International Conference on Machine Learn- ing, pages 53-61 , New Brunswick, NJ, July 1994.
- Mor- gan Kaufmann. [Fukunaga, 1990]
- K. Fukunaga. Introduction to statis- tical pattern recognition. Academic Press, New York, 1990.
- [Hansen and Salamon, 1990] L. Hansen and P. Salamon. Neural network ensembles. IEEE Transactions on Pattern Analysis and Machine Intelligence, 12:993- 1001, 1990.
- [Hashem et al., 1994] S. Hashem, B. Schmeiser, and Y. Yih. Optimal linear combinations of neural net- works: An overview. In Proceedings of the 1994 IEEE International Conference on Neural Networks, Orlando, FL, 1994.
- [Jacobs et al. , 1991] R. Jacobs, M. Jordan, S. Nowlan, and G. Hinton. Adaptive mixtures of local experts. Neural Computation, 3:79-87, 1991.
- [Jolloffe, 1986] I. T. Jolloffe. Principal component anal- ysis. Springer-Verlag, New York, 1986.
- [Jordan and Jacobs, 1994] M. Jordan and R. Jacobs. Hierarchical mixtures of experts and the EM algo- rithm. In Proceedings of the International Conference on Artificial Neural Networks, London, 1994.
- [Kearns and Seung, 1995] M. Kearns and H. Seung. Learning from a population of hypotheses. Machine Learning, 18:255-276, 1995.
- [Krogh and Vedelsby, 1995] A. Krogh and J . Vedelsby. Neural network ensembles, cross validation, and active learning. In G . Tesauro, D. Touretzky, and T. Leen, editors, Advances in Neural Information Processing Systems, volume 7, Cambridge, MA, 1995. MIT Press.
- [Lincoln and Skrzypek, 1989] W. Lincoln and J. Skrzy- pek. Synergy of clustering multiple back propagation networks. In D. Touretzky, editor, Advances in N eural Information Processing Systems, volume 2, pages 650- 659, San Mateo, CA, 1989.
- Morgan Kaufmann. [Maclin and Shavlik, 1995]
- R. Maclin and J. Shavlik. Combining the predictions of multiple classifiers: Us- ing competitive learning to initialize neural net- works. In Proceedings of the Fourteenth International Joint Conference on Artificial Intelligence, Montreal, Canada, September 1995. IJCAI
- [Nowlan and Hinton, 1990] S. Nowlan and G. Hinton. Evaluation of adaptive mixtures of competing experts. In R. Lippmann, J . Moody, and D. Touretzky, editors, Advances in Neural Information Processing Systems, volume 3, San Mateo, CA, 1990.
- Morgan Kaufmann.
- [Perrone and Cooper, 1994] M. Perrone and L. Cooper. When networks disagree: Ensemble method for neural networks. In R. J . Mammone, editor, Artificial Neural Networks for Speech and Vision. Chapman and Hall, London, 1994.
- [Quinlan, 1996] J . R. Quinlan. Bagging, boosting, and c4.5 . In Proceedings of the Thirteenth National Con- ference on Artificial Intelligence, 1996.
- [Rogova, 1994] G. Rogova. Combining the results of several neural-network classifiers. Neural Networks, 7:777-781, 1994.
- [Rost and Sander, 1993] B. Rost and C. Sander. Predic- tion of protein secondary structure at better than 70% accuracy. Journal of Molecular Biology, 232:584-599, 1993.
- [Saunders, 1992] R. S. Saunders. Magellan mission sum- mary. Journal of Geophysical Research, 97:13067- 13090, 1992.
- [Thrk and Pentland, 1991] M. Thrk and A. Pentland. Eigenfaces for recognition. Journal of Cognitive Neu- roscience, 3:71-86, 1991.
- [Wolpert, 1992] D. Wolpert. Stacked generalization. Neural Networks, 5:241-259, 1992.
- [Zhang et al., 1992] X. Zhang, J . Mesirov, and D. Waltz. Hybrid system for protein secondary structure predic- tion. Journal of Molecular Biology, 225 :1049-1063, 1992.
References were extracted automatically from the PDF and may contain errors.
Full text extracted automatically from the PDF; figures, tables and equations may differ. The PDF is the version of record.
1 Introduction
A popular method for creating an accurate classifier from a set of training data is to train several different clas sifiers on the training data, and then to combine the predictions of these classifiers into a single prediction [Breiman, 1996; Drucker et al., 1994; Wolpert , 1992] . The resulting classifier is generally referred to as an en semble because it is made up of component classifiers. In this paper we present a novel method for combining the predictions of several classifiers. For each classifier we calculate a prediction threshold and a confidence factor associated with that threshold. Our approach orders the
*Current address: Department of Computer and Systems Sciences, Stockholm University, Sweden.
Richard Maclin
Department of Computer Science University of Minnesota
Duluth, Minnesota 55812-2496
classifiers by decreasing confidence. To make a predic tion the most confident classifier is consulted and if its prediction is above its threshold (it is considered compe tent to make a prediction) then that prediction is used, otherwise the next most confident classifier is consulted, then the third most confident classifier, and so on. If no classifier is competent then the average of all of the classifiers' predictions is used.
To test our approach we developed a system, referred to as SEQUEL (SEQUEnce Learner), which we have ap plied to the difficult task of detecting volcanos from radar images of Venus. In our experiments we demonstrate that our approach generally performs as well or better than any of its component classifiers and outperforms the standard ensemble approach of simply averaging the predictions of the component classifiers.
2 Background
A number of researchers have demonstrated that en sembles are generally more accurate than any of their component classifiers [Breiman, 1996; Clemen, 1989; Quinlan, 1996; Wolpert, 1992; Zhang et al., 1992]. Fig ure 1 shows a basic framework for combining classifiers. Using an ensemble, the class of an example is predicted by first classifying the example with each of the compo nent classifiers and then combining the resulting predic tions into a single classification. To create an ensemble, a user generally must focus on two aspects: (1) which clas sifiers to use as components of the ensemble; and (2) how to combine their individual predictions into one.
Hansen and Salamon [1990] demonstrated that under certain assumptions, the accuracy of an ensemble increases with the number of classifiers combined. For each example where the average error rate is less than 50% for the distribution of possible classifiers, they show that in the limit the expected error on that example can be reduced to zero. Of course, since not all patterns will necessarily share this characteristic (e.g., outliers may be predicted at more than 50% error), the error rate over all the patterns cannot necessarily be reduced to zero. But if we assume a significant percentage of the patterns are predicted with less than 50% average error, gains in generalization will be achieved. A key as sumption of Hansen and Salamon's analysis is that the classifiers combined should be independent in their pro duction of errors. Krogh and Vedelsby (1995) expanded on this notion to show that the error for an ensemble is related to the generalization error of the the classi fiers plus how much disagreement there is between the different classifiers.
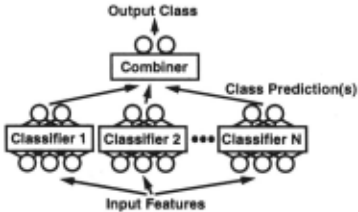
Thus much research on selecting appropriate classi fiers to combine has focused on selecting classifiers that are accurate in the predictions, but differ in where they are accurate. Methods for approaching this problem in clude using different classification methods, training on subsets of the data set, training on different sets of input features, and using different subsets of the training set for training the classifiers [Breiman, 1996; Drucker et al., 1994; Hansen and Salamon, 1990; Hashem et al., 1994; Krogh and Vedelsby, 1995; Maclin and Shavlik, 1995).
In the present application, SEQUEL combined classi fiers that were trained using different input features (see Section 6).
The second aspect of creating an ensemble is the choice of the function for combining the predictions of the component classifiers [Kearns and Seung, 1995]. Ex amples of combination functions include voting schemes [Hansen and Salamon, 1990), simple averages [Lincoln and Skrzypek, 1989), weighted average schemes [Perrone and Cooper, 1994; Rogova, 1994), and schemes for train ing combiners [Rost and Sander, 1993; Wolpert, 1992; Zhang et al., 1992]. Clemen (1989) demonstrated that in the absence of knowledge concerning a specific prob lem, almost any reasonable method, including the simple ones such as voting or using a weighted average, will re sult in an effective ensemble.
SEQUEL applies a sequence of classifiers starting with its "best" individual classifier. Each classifier is allowed to operate only if its predictions are above a certain threshold, otherwise the decision is left to the remain der of the classifiers. If none of the classifiers can reach a competent decision, the default method of using the simple average of all the classifiers' predictions is applied (see Section 3) .
SEQUEL can also be thought of as being related to the hierarchical mixture of experts approach [Jacobs et al., 1991; Jordan and Jacobs, 1994; Nowlan and Hin ton, 1990). In a . mixture of experts approach a group of sub-classifiers is trained so that each sub-classifier will become an "expert" on a different portion of the input space. Our approach differs in that our training mecha nism is simpler (each classifier simply trains on the entire problem) but as a result our component classifiers may have significant overlap in their expertise. On the other hand, in our approach we use the overall average to pre dict difficult cases, which may be better than trying to train an "expert" for these cases.
The method implemented in SEQUEL has an intu itive justification and empirical results from real world datasets show considerable improvement relative to both any individual classifier as well as to an ensemble con structed from the simple average of all classifiers.
3 The Sequence Learner
SEQUEL implements a method for combining the predic tions of k classifiers trained on n examples. The method assumes that each classifier fk produces a probability es timate so that fk(x) gives the probability that x is an instance of a target concept C. Each classifier's thresh old (Tk) is: the probability given to the negative example with the highest probability. 1 A classifier is considered competent for an example x if fk ( x) 2: Tk .
Each classifier's confidence score is the number of pos itive training examples x : fk(x) 2: Tk, divided by the total number of training examples in the region above the threshold. A classifier's score can be thought of as the probability of making a correct decision for those examples where the classifier is competent.
The classifier with the highest confidence score will la bel some part of the training data as "sure instances of concept C" (the part of the training data that has been given a probability of at least Tk) · To determine the next classifier in the sequence all of the "sure" examples la beled by the first classifier are removed and the classifier with the highest confidence score for the remaining ex amples is chosen as the most confident classifier. This process is then repeated until the best classifier's confi dence score is less than a predetermined threshold (we are currently using a threshold of 0.5).
The output from this method is a list of classifiers and their corresponding thresholds to be applied in order,
and a default method to apply on samples that cannot be labeled by the sequence. In our experiments, the default method is the simple average of all the classifiers.
For each new sample, apply the the first classifier in the sequence and see if it gives a probability that lies above its threshold. If so, assign that probability to the sample, otherwise leave it to the second classifier. If the second classifier gives the sample a probability that lies above its threshold then multiply that probability with the first classifier's threshold and let the product be the output of the combined classifier. If the second best classifier cannot decide, give it to the third best and so on until there are no more classifiers in the sequence. It is important that the ordering between the classifiers is maintained. Therefore, prediction f*( x ) that is pro duced by the best classifier (with index kx) is multiplied by the product of the thresholds of all previous classi fiers.
1 This holds under the condition that there exists a positive example with higher probability, otherwise the threshold will be equal to the probability given to the positive example with the highest probability.
This maintains the ordering but has the effect that we can no longer think of the numbers as probabilities.
4 The Domain
SEQUEL has been applied to the problem of identifying small volcanos in SAR (synthetic aperture radar) images of Venus collected by the Magellan spacecraft [Saunders, 1992]. This problem is of interest because it is impor tant scientifically and because the huge volume of data and the high dimensionality of the data (images) make this problem very difficult . The use of an ensemble of different classifiers is further motivated by the fact that no existing system has yet been able to do a satisfactory mapping of the approximately 10 6 small volcanos in the images.
Venus is of special interest to scientists because in ge ological terms Venus is very similar to Earth, so a better understanding of Venus will provide us with information about Earth. Volcanos are interesting because they are a widespread feature of the surface of Venus and because they are detectable in the Magellan images. Volcanos are also interesting, because if a mapping of all of the volcanos covering the surface of Venus existed, scien tists would be able to infer geological properties from the number, clustering, size, etc. of the volcanos.
The Magellan spacecraft transmitted back to Earth approximately 30.000 SAR (synthetic aperture radar)
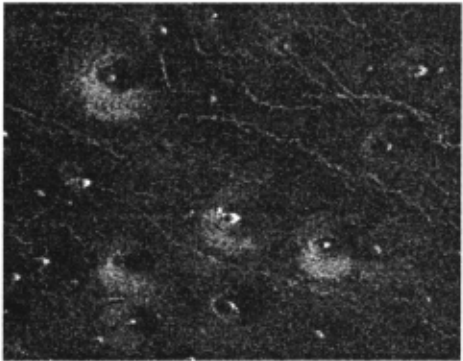
images covering 98% of the Venusian surface. This pro duced more data than had been produced from all pre vious space probes combined. The SAR images are 1024 by 1024 pixel images with a resolution of 75m per pixel. Figure 2 contains a sample of part of an image from the Magellan SAR dataset . The very volume of the data set makes the problem of labeling all of the volcanos on Venus infeasible for humans.
Even with computer classification, the amount of data in the dataset is extremely large. The J ARtool system [Burl et al., 1994; 1996] which was developed by JPL, is an automatic tool developed for this classification pro cess. JARtool is trained by first filtering the data in a pre-pass method called the Focus Of Attention (FOA) . The FOA is a simple method for selecting particular sized sub-areas (generally small squares) of the image based on their responses to a matched filter. This model has two positive effects: (1) it greatly reduces the num ber of data points to consider in later stages; and (2) it causes each candidate volcano to be roughly "centered" in the sub-image. The first effect is very important since even when a relatively small sub-image (say 15 pixels by 15 pixels) is used to recognize volcanos, the resulting sub-image still has a large number of features (225 pixel values in this case) . The major disadvantage of using the FOA model is that by pre-selecting a small number of sub-images from the original image the resulting set of sub-images may not include all of the volcanos labeled by the experts.
Once the FOA model has been applied the problem of volcano detection is one of determining which of the sub-regions of the image (also called regions of interest) returned by the FOA actually contain volcanos.
The original J ARtool method controlled for the high dimensional space using the principal-component analy sis method discussed below to extract a reduced set of features. After the dimensionality reduction step, the resulting features were then used to train a Gaussian classification method (QDA or Quadratic Discrimination Analysis) to distinguish between actual volcanos and non volcanos. JARtool's performance is comparable to that of the single best classifier shown in Figures 4 and 5.
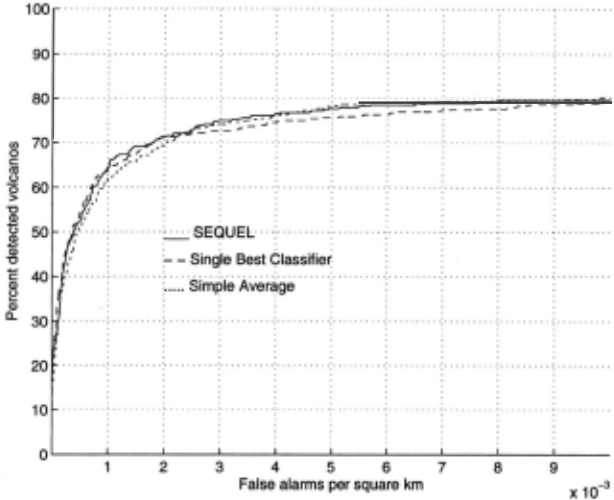
Note that due to the use of the FOA model the resulting classifier has an upper limit in its accuracy that is less than 100%, since some of the actual volcanos are left out.
5 Feature Engineering
To create a set of classifiers for our ensemble that per form differently on different portions of the data set we varied the set of features used to create the classifiers.
To produce a volcano detector our algorithm must be able to label a set of small images as being either vol canos or not volcanos. Since these sub-images consist of a large number of pixels, the resulting input space has high dimensionality, and the set of possible features be comes immense. Thus, all the component classifiers use principal component analysis (PCA) [Fukunaga, 1990; Jolloffe, 1986] to reduce the high dimensional feature space that the examples are drawn from.
PCA has been widely used in statistical data analysis, image processing and pattern recognition. For example, Turk and Pentland used it for face recognition (1991). PCA provides the highest eigenvalue eigenvectors of the data covariance matrix to be used as the new features . In this way the high-dimensional feature space can be projected down onto a more tractable sub-space of less dimensionality.
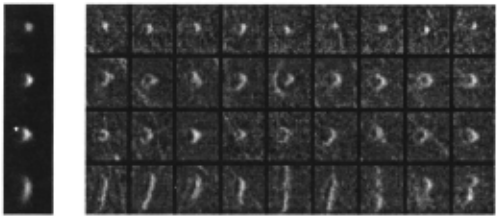
One weakness with the scheme proposed in JARtool is the fact that it is based on the assumption that all vol canos look enough alike to be selected by a single filter in the FOA step and to be classified by a single clas sifier. In practice, there exists a variety of subtypes of volcanos, each with its own visual characteristics. Figure 3 shows some different types of volcanos. The vol canos in each row on the right hand side of the figure are taken from different clusters. Instead of training one sin gle classifier to distinguish between typical volcanos and non-volcanos, we trained a collection of different classi fiers (each with its own particular set of features) and then created an ensemble of all the classifiers. In order to do so we first used k-means clustering to partition the volcanos in the training data into a number of clusters. The volcano images of each such cluster were then an alyzed with principal component analysis to produce a set of features that best describe the volcanos of each cluster.
6 Experiments
We started out by examining a set of 38 images that have been labeled and examined in previous work [Burl et al., 1996]. We used these images as a means for eval uating which combinations of features and classification methods to use. These images contain 453 volcanos, 383 of which are recognized by the FOA model. The FOA model also produces 9920 sub-images that match the fil ter but are not volcanos. To produce classifiers for these images we divided the images up into six sets and per formed six-fold cross-validation on each of these sets (i.e., using the volcanos/non-volcanos of each set as a fold).
We began our study by focusing on selecting an initial feature representation. We then performed experiments on the preliminary set of 38 images varying the number of clusters, the size, the scaling of the sub-images, and the number of principal components used by the classitier. Parameter sensitivity tests indicated the selection of the following combinations: 15 and 30 principal compo nents, 1 and 4 clusters, and a scaling factor (controlling the size of the sub-image) of 2, 3, and 4. We also added an additional feature based on knowledge of the domain, a line filter value that notes the presence of lines in the image - these lines can easily distract the FOA model. All in all this produced 12 different classifiers.
Once we had chosen the different combinations of fea tures and classifiers we intended to use in our ensemble based on experiments with the first dataset, we then tested our method on another set of 56 labeled images separate from the original set of 38 images.
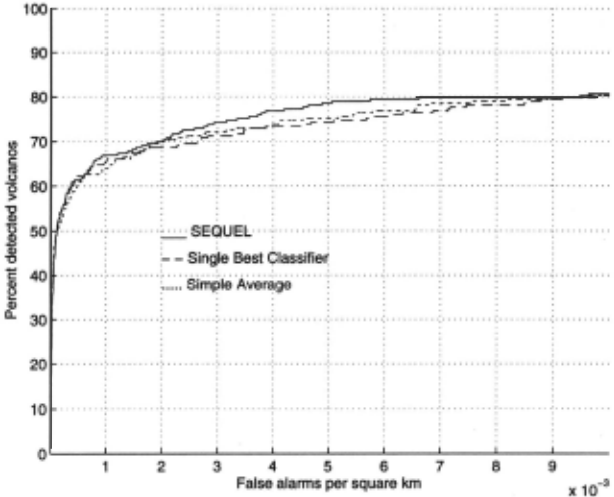
For all of our results we show a curve with the per centage of detected true positives relative to the number of detected false positives per km 2 . This is done by suc cessively lowering the threshold for predicting a volcano and determining how many true volcanos are included versus how many "false positive" volcanos are included (i.e., as the threshold lowers more of the actual volcanos are included, but more "false positives" may appear) .
SEQUEL produced results which are shown in Figure 4. The resulting classifier outperforms the original J ARtool method [Burl et al., 1994; 1996] and even outperforms any individual classifier and an ensemble constructed from the average of all classifiers. Of course, these re sults are for a dataset where we have performed signif icant exploration to select input features, etc. so it is not surprising that we perform well. To test our method further we trained the same 12 classifiers on the original 38 images, created a sequence of classifiers, and applied it to the set of 56 new images. The results from these ex periments are shown in Figure 5. In this experiment too
(but more surprisingly), SEQUEL outperforms the best single classifier, the simple average ensemble as well as the original JARtool (JARtools performance is equiva lent to the best single participating classifier).
7 Conclusions
We have presented a new method for creating an en semble of classifiers that is based on an estimation of each classifier's competence. Output from the method is a sequence consisting of either individual classifiers or combinations of classifiers together with a threshold for each member of the sequence.
The advantage of this approach is that we do not have to settle on a particular classification method, but can combine multiple methods to produce a classifier that outperforms any individual classification method. To produce our ensemble we made use of domain knowl edge (in this case, a set of preliminary data) in forming our ensemble. SEQUEL implements a function for com bining the component classifiers that takes advantage of the abilities of each of the component classifiers.
The result of our approach is a method for combining classifiers in an ensemble that is simple and that outper forms any single participating classifier. FUrthermore, the constructed ensemble constitutes the best known classifier to date, for this difficult domain, an achieve ment worth mentioning, since several man-years have already been spent to produce a good classifier for this domain [Burl et al., 1994; 1996]. Under these circum stances, even an increase in accuracy as little as 3 or 4 % can be considered a great success.
Acknowledgments
This work was performed by the Jet Propulsion Labora tory, California Institute of Technology, under contract with the National Aeronautics and Space Administra tion (NASA). The work was partially supported by a grant from the Swedish Research Council for Engineer ing Sciences (L. Asker) and by a NASA/ ASEE Summer Faculty Fellowship (R. Maclin) . We would like to thank M. Burl, P. Smyth, and U. Fayyad for their assistance with the Volcano dataset. We would also like to thank A. Gray, J . Roden, M. Thrmon, E. Mjolsness, J. Gratch, S. Minton and D. Wolpert for useful discussions that helped develop the ideas presented in this paper.
@inproceedings{ijcai1997p124,
  title     = {Ensembles as a Sequence of Classifiers},
  author    = {Asker, Lars and Maclin, Richard},
  booktitle = {Proceedings of the Fifteenth International Joint Conference on
               Artificial Intelligence, {IJCAI-97}},
  publisher = {International Joint Conferences on Artificial Intelligence},
  editor    = {Martha E. Pollack},
  pages     = {860--864},
  year      = {1997},
  note      = {Learning},
  url       = {https://ijcai.org/proceedings/1997/124},
}
TY - CPAPER TI - Ensembles as a Sequence of Classifiers AU - Asker, Lars AU - Maclin, Richard T2 - Proceedings of the Fifteenth International Joint Conference on Artificial Intelligence, IJCAI-97 PB - International Joint Conferences on Artificial Intelligence PY - 1997 SP - 860 EP - 864 UR - https://ijcai.org/proceedings/1997/124 ER -Copied
Machine-readable versions of this paper, for tools and AI agents:





