
Organization of Hierarchical Perceptual Sounds: Music Scene Analysis with Autonomous Processing Modules and a Quantitative Information Integration Mechanism
Proceedings of the Fourteenth International Joint Conference on Artificial Intelligence. Action and Perception. Pages 158-163.
© 1995 International Joint Conferences on Artificial Intelligence
Abstract
We propose a process model for hierarchical perceptual sound organization, which recognizes perceptual sounds included in incoming sound signals. We consider perceptual sound organization as a scene analysis problem in the auditory domain. Our model consists of multiple processing modules and a hypothesis network for quantitative integration of multiple sources of information. When input information for each processing module is available, the module rises to process it and asynchronously writes output information to the hypothesis network. On the hypothesis network, individual information is integrated and an optimal internal model of perceptual sounds is automatically constructed. Based on the model, a music scene analysis system has been developed for acoustic signals of ensemble music, which recognizes rhythm, chords, and source-separated musical notes. Experimental results show that our method has permitted autonomous, stable and effective information integration to construct the internal model of hierarchical perceptual sounds.
- [Bregman, 1990] Bregman A. S. Auditory Scene Analy• sis. MIT Press, 1990.
- [Brown and Cooke, 1992] Brown G. J. and Cooke M. A Computational Model of Auditory Scene Analysis. In Proceedings of International Conference on Spo• ken Language Processing, pages 523-526, 1992.
- [Brown and Cooke, 1994] Brown G. J. and Cooke M. Perceptual Grouping of Musical Sounds: A Com• putational Model. Journal of New Music Research, 23(1):107-132, 1994.
- [Chafe et al., 1985] Chafe C., Kashima J ., Mont• Reynaud B., and Smith J. Techniques for Note Identification in Polyphonic Music. In Proceedings of the 1985 International Computer Music Confer• ence, pages 399-405, 1985.
- [Cooke et al., 1993] Cooke M.P., Brown G. J., Crawford M. D . and Green P. D. Computational auditory scene analysis: Listening to several things at once. Endeavour, 17(4):186--190, 1993.
- [Desain and Honing, 1989] Desain P. and Honing H . Quantization of Musical Time: A Connectionist Approach. Computer Music Journal, 13(3):56-66, 1989.
- [Handel, 1989] Handel S. Listening. MIT Press, 1989.
- [Kashino and Tanaka, 1993] Kashino K. and Tanaka H . A Sound Source Separation System with the Abil• ity of Automatic Tone Modeling. In Proceedings of the 1993 International Computer Music Confer• ence, pages 248-255, 1993.
- [Lesser et al., 1993] Lesser V., Nawab S. H., Gallastegi I. and Klassner F. IPUS: An Architecture for Inte- grated Signal Processing and Signal Interpretation in Complex Environments. In Proceedings of the 11th National Conference on Artificial Intelligence, pages 249-255, 1993.
- [Mellinger, 1991] Mellinger D. K. Event Formation and Separation of Musical Sound. Ph.D. Thesis, Depart• ment of Music, Stanford University, 1991.
- [Mont•Reynaud, 1985] Mont•Reynaud B. Problem• Solving Strategies in a Music Transcription System. In Proceedings of the 1985 International Joint Con• ference on Artificial Intelligence, pages 916--918, 1985. IJCAI
- [Nakatani et al., 1994] Nakatani T., Okuno H. G., and Kawabata T. Auditory Stream Segregation in Au• ditory Scene Analysis with a Multi•Agent System. In Proceedings of the 12th National Conference on Artificial Intelligence, pages 100-107, 1994.
- [Oppenheim and Nawab, 1992] Oppenheim A. V. and Nawab S. H. (eds.). Symbolic and Knowledge•Based Signal Processing. Prentice Hall, 1992.
- [Pearl, 1986] Pearl J. Fusion, Propagation, and Struc• turing in Belief Networks. Artificial Intelligence, 29(3):241-288, 1986.
- Roads C. Research in Music and Artificial Intelligence. ACM Computing Surveys, 17(2):163- 190, 1985.
- [Rosenthal, 1992] Rosenthal D. Machine Rhythm: Com• puter Emulation of Human Rhythm Perception.
References were extracted automatically from the PDF and may contain errors.
Full text extracted automatically from the PDF; figures, tables and equations may differ. The PDF is the version of record.
1 Introduction
Over the past years, a number of approaches have been taken on machine vision: both theoretical and experi mental efforts on feature extraction, shape restoration, stereo vision, knowledge-based vision and other tech niques have been accumulated. On the other hand, re search on machine audition, or computer systems to un derstand acoustic information, has been so far focused mainly on spoken language understanding. However, one of the requirements to an intelligent system is to possess the ability of recognition of various events in a given en vironment. Specifically, understanding not only visual information or speech but also various acoustic informa tion would play an essential role for an intelligent system which works in the real world.
On recognition or understanding of non-speech acous tic signals, several pioneering works can been found in the literature. For example, environmental sound recognition systems and auditory stream segregation sys tems have been developed [Oppenheim and Nawab, 1992; Lesser et al., 1993; Nakatani et al., 1994], as well as mu sic transcription systems and music sound source separa tion systems [Roads, 1985; Mellinger, 1991; Kashino and Tanaka, 1993; Brown and Cooke, 1994]. Here we con sider two aspects: flexibility of processing and hierarchy of perceptual sounds.
· Currently at NTT Basic Research Laboratories.
First, we note that the flexibility of existing systems has been rather limited when compared with human au ditory abilities. For example, automatic music transcrip tion systems which can deal with given ensemble mu sic played by multiple music instruments have not yet realized, although several studies have been conducted [Mont-Reynaud, 1985; Chafe et al., 1985].
Regarding flexibility of auditory functions in humans, recent progress in physiological and psychological acous tics has offered significant information. Especially, the property of information integration in the human au~i tory system has been highlighted, as demonstrated m the "auditory restoration" phenomena [Handel, 1989]. To achieve flexibility, machine audition systems must have this property, since sound source separation, a sub problem of sound understanding, is an inverse problem in general formalization and cannot be properly solved without such information as memories of sound or mod els of the external world, as well as given sensory data.
Using the blackboard architecture, information inte gration for sound understanding has already been real ized [Oppenheim and Nawab, 1992; Lesser et al., 1993; Cooke et al., 1993]. However, it is still necessary to con sider a quantitative and theoretical background in infor mation integration.
Second we should consider the basic problem of sound understa~ding, "what is a single sound", noting ~he distinction between a perceptual sound and a physical sound. A perceptual sound in our terminology is a clus ter of acoustic energy which humans hear as one sound, while a physical sound means an actual vibration of.me dia. For example, when one listens to ensemble mus1c of several instruments through one loudspeaker, there is a single physical sound source while we hear ~ultiple.per ceptual sounds. As discussed in the followmg sectwns, an essential property of perceptual sound is its hierar chical structure.
With these points as background, we provide a novel process model of hierarchical perceptual sound organiza tion with a quantitative information integration mecha nism. Our model is based on probability theory and characterized by its autonomous behavior and theoreti cally proved stability.
2 Problem Description
2.1 Perceptual Sound Organization
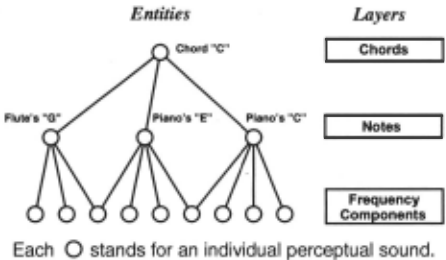
An essential problem of perceptual sound organization is a clustering of acoustic energy to create such clusters that humans hear as one sound entity. Here it is impor tant to note that humans recognize various sounds in a hierarchical structure in order to properly grasp and un derstand the external world. That is, a perceptual sound is structured in both spatial and temporal hierarchy. For example, when one waits for a person to meet standing in a busy street, the waiting person sometimes hears a whole traffic noise as one entity, while sometimes hears a noise of one specific car as one entity. If he or she directs attention to the specific car's sound, an engine noise of the car or a frictional sound from the road surface and the tires of the car can be heard separately as one entity.
Figure 1 shows an example of snapshot of perceptual sounds for music. Note that there is not only spatial structure as shown in this figure but also temporal clus ters of perceptual sounds, typically melodies or chord progression, though the temporal structure of perceptual sounds has not been depicted in Figure 1 for simplicity of the figure.
The problem of perceptual sound organization can be decomposed into the following sub problems:
- Extraction of frequency components with an acous tic energy representation.
- Clustering of frequency components into perceptual sounds.
- Recognition of relations between the clustered per ceptual sounds and building a hierarchical and sym bolic representation of acoustic entities.
Note that we consider the problem as extraction of symbolic representation from flat energy data, while most approaches toward "auditory scene analysis" have so far considered their problem as restoration of target sound signals[Nakatani et al., 1994; Brown and Cooke, 1992]. In the computer vision field, the scene analysis problem has been considered as extration of symbolic representation from bitmap images and clearly distin guished from the image restoration problem which ad dresses recovery of target images from noise or intru swns.
2.2 Music Scene Analysis
Here we have chosen music as an example of applica ble domain of perceptual sound organization. We use the term music scene analysis in the sense of perceptual sound organization in music. Specifically, music scene analysis refers to recognition of frequency components, notes, chords and rhythm of performed music.
In the following sections, we first introduce general configuration of the music scene analysis system. We then focus our discussion on hierarchical integration of multiple sources of information, which is an essential problem in perceptual sound organization. Then behav ior of the system and results of the performance evalu ation are provided, followed by discussions and conclu SlOns.
3 System Description
Figure 2 illustrates our process model OPTIMA (Orga nized Processing toward Intelligent Music Scene Analysis). Input of the model is assumed to be monaural music sig nals. The model creates hypotheses of frequency com ponents, musical notes, chords, and rhythm. As a con sequence of probability propagation of hypotheses, the optimal (here we use the term "optimal" in the sense of "maximum likelihood") set of hypotheses is obtained and outputted as a score-like display, MIDI (Musical Instru ment Digital Interface) data, or re-synthesized source separated sound signals.
OPTIMA consists of three blocks: (A) preprocessing block, (B) main processing block, and (C) knowledge sources. In the preprocessing block, first the frequency analysis is performed and a sound spectrogram is ob tained. An example of sound spectrograms is shown in Figure 3.
With this acoustic energy representation, frequency components are extracted. This process corresponds to the first sub problem discussed in the previous section. In the case of complicated spectrum patterns, it is dif ficult to recognize onset time and offset time solely by bottom-up information. Thus the system creates several terminal point candidates for each extracted component, which are displayed in Figure 4 as :white circles.
With Rosenthal's rhythm recognition method [Rosen thal, 1992] and Desain's quantization method [Desain and Honing, 1989], rhythm information is extracted for precise extraction of frequency components and recog nition of onset/offset time. Based on the integration of beat probabilities and termination probabilities of ter minal point candidates, the candidates were fixed their status: continuous or terminated, and consequently pro cessing scopes are formed. Here a processing scope is a group of frequency components whose onset times are close. The processing scope is utilized as a basic time clock for succeeding main processes of OPTIMA, as dis cussed later. Examples of the formed processing scopes are shown in Figure 4 (Bottom panel).
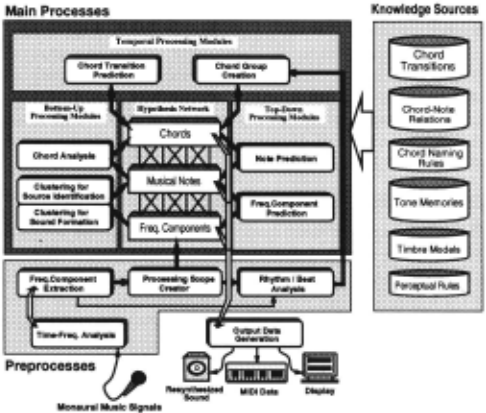
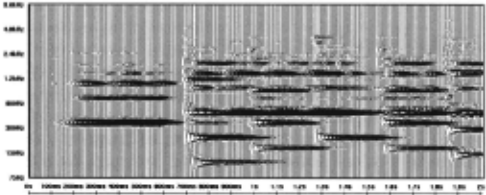
Figure 3: An example of spectrograms
When each processing scope is created in the prepro cessing block, it is passed to the main processing block, as shown in Figure 2. The main block has a hypothesis network with three layers corresponding to levels of ab straction: (1) frequency components, (2) musical notes and (3) chords. Each layer encodes multiple hypotheses. That is, OPTIMA holds an internal model of the exter nal acoustic entities as a probability distribution in the hierarchical hypothesis space.
Multiple processing modules are arranged around the hypothesis network. The modules are categorized into three blocks: (a) bottom-up processing modules to trans fer information from a lower level to a higher level, (b) top-down processing modules to transfer information from a higher level to a lower level, and (c) temporal pro cessing modules to transfer information along the time axis. The processing modules consult knowledge sources Top Extracted frequency components (dis played as lines) with terminal point candi dates (white circles). Radius of each circle corresponds to the estimated probability of termination. Ordinate: frequency, ab scissa: time.
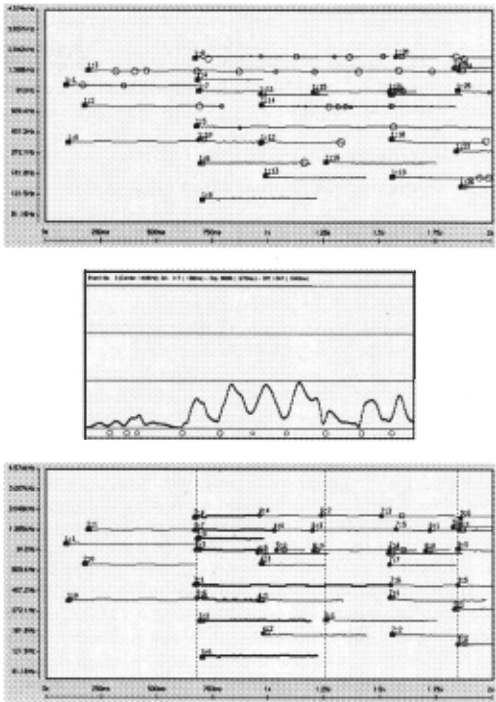
Middle
Bottom
- Terminal point candidates for the com ponent "1:3" in the top panel with time power plane display, showing the difficulty of finding where a component terminates or starts only by bottom-up information. Ordinate: power, abscissa: time.
- Processing scopes with the label "Scope Id:Component-Id", formed with rhythm information. Vertical dotted lines show rhythm information extracted by the sys tem. As an example, Scope No.3 is high lighted. Ordinate: frequency, abscissa: time.
(Source: the beginning of a two part chamber ensemble "Auld Lang Syne", performed by a piano and a flute)
Figure 4: Examples of frequency components and processing scopes
if necessary. The following sections discuss the informa tion integration at the hypothesis network and behavior of each processing module.
4 Information Integration by the Hypothesis Network
For information integration in the hypothesis network, we require a method to propagate impacts of new in formation through the network. We employ Pearl's Bayesian network method [Pearl, 1986], which can fuse and propagate new information represented by proba bilities through the network using two separate links (.\ link and 1r-link) if the network is a singly connected (e.g. tree-structured) graph.
Figure 5 shows our application of the hypothesis net work. As shown in the previous section, the network has three layers: (1) C(Component)-level, (2) N(Note) level, and (3) S(Chord)-level. The link between the C-level node and the N-level node is the S(Single) Link, which corresponds to one processing scope. The link between the S-level and the N-level becomes the M(Multiple)-Link, as a consequence of temporal integra tion: multiple notes along time axis may form a single chord. The S-level nodes are connected along time by the T(Temporal)-Link, which encodes chord progression.
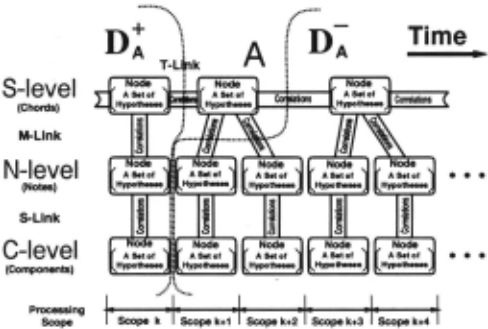
To discuss information integration scheme, assume we wish to find the belief (BEL) induced on the Node A in Figure 5, for example. Letting DA. stand for the data contained in the tree rooted at A and D~ for the data contained in the rest of the network, we have
where A is a probability vector: A= (a1,a2,···,aM)· Using Bayes' theorem and assuming independence of hy potheses
we have
where a is a normalization constant.
Substituting as .\(A) = P(DA.IA) and 1r(A) = P(AID~), Equation (3) can be written as
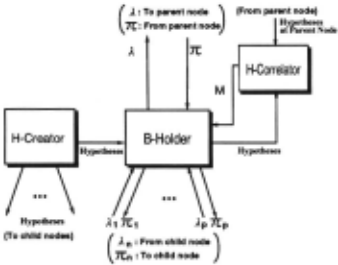
Given conditional probabilities P(ChildiParent) be tween any two adjacent nodes, .\(A) can be derived from .\(Children of A) and 1r(A) from 1r(Parent of A) [Pearl, 1986] . This derivation is considered as propagation of diagnostic ( ,\) or causal ( 1r) support to A.
A minimum set of processing modules required in each node of the network is shown in Figure 6. B-Holder holds the belief (BEL) and passes new information as .\ and 1r messages to the adjacent B-Holders. In our OP TIMA model, B-Roiders are embedded in the hypoth esis network and not explicitly drawn in Figure 2. H Creator creates the hypotheses with initial probabilities. H-Correlator is for evaluating conditional probabilities P(Node11Node2 ), where Node2 is a parent of Node1, which are required in the information propagation pro cess.
Note that the local computations required by the up dating scheme are efficient: the order of computational requirement is (1) linear to the number of nodes and (2) square to the number of hypotheses in each node. In addition, not only instabilities or indefinite relaxations have been avoided by two-parameter system ( 1r and .\), but also the order of provision of information does not affect the status of the network (probability values) after the propagation process. These properties of the hypoth esis network support integration of multiple sources of in formation derived from autonomous processing modules. The following section shows how the processing modules work to create instances of the hypothesis network.
5 System Behavior
Based on the OPTIMA process model , a music scene analysis system has been implemented. The total amount of codes is approximately 60,000 lines (1.6 MByte) in C, except for the graphical user interface codes. Each processing module communicates with other modules through the TCP /IP socket interface, which en ables us to install any modules in remote computers.
In our implementation, the frequency analysis module and the frequency component prediction module have been installed on a parallel computer (Fujitsu APlOOO) to achieve high processing speed, while the other part of the system was developed on workstations. This sec tion discusses configuration of knowledge sources and the behavior of processing modules in the main processing block in Figure 2.
5.1 Knowledge sources
Six types of knowledge sources are utilized in OPTIMA. The chord transition dictionary holds statistical in formation of chord progression, under the N-gram as sumption (typically we use N=3); that is, we currently assume that the length of Markov chain of chords is three, for simplicity. Since each S-level node has N gram hypotheses, one can note that the independence condition stated by Equation (2) is satisfied even in S level nodes. We have constructed this dictionary based on statistical analysis of 206 traditional songs (all west ern tonal music), which are popular in Japan and other countries.
In the chord-note relation database, probabilities of notes which can be played under a given chord are stored. This information is also obtained by statistical analysis of the 2365 chords. A part of the stored data is shown in Table 1.
The chord naming rules, based on a music theory, are used to recognize chord when hypotheses of played notes are given.
Table 1: Examples of the chord-note relation knowledge
Conditional probabilities P(N otel Chord) obtained by statistical analysis of printed music.
| Given chord (3 examples) | |||
|---|---|---|---|
| Note | A | A7 | Am |
| A A# B c C# D D# E F F# G G# | .983 ± .023 .000 ± .000 .150 ± .064 .008 ± .016 .850 ± .064 .025 ± .028 .067 ± .045 .842 ± .065 .017 ± .023 .125 ± .059 .025 ± .028 .075 ± .047 | .852 ± .074 .023 ± .031 .364 ± .101 .023 ± .031 .818 ± .081 .057 ± .048 .023 ± .031 .545 ± .104 .023 ± .031 .148 ± .074 .773 ± .088 .045 ± .044 | 1.00 ± .000 .030 ± .058 .091 ± .098 .848 ± .122 .000 ± .000 .182 ± .132 .030 ± .058 .909 ± .098 .000 ± .000 .000 ± .000 .121 ± .111 .000 ± .000 |
The tone memory is a repository of frequency com ponents data of a single note played by various musi cal instruments. Currently it maintains notes played by five instruments (clarinet, flute, piano, trumpet, and vi olin) at different expressions (forte, medium, piano), frequency range, and durations. We recorded those sound samples at a professional music studio.
The timbre models are formed in the feature space of the timbre. We first selected 43 parameters for musical timbre, such as onset gradient of the frequency compo nents and deviations of frequency modulations, and then reduced the number of parameters to eleven by the prin cipal component analysis. This eleven-dimension feature space, where at least timbres of above mentioned five in struments are completely separated with each other, is used as a timbre model information.
Finally, the perceptual rules describes the human auditory characteristics of sound separation[Bregman, 1990]. Currently, the harmonicity rules and the onset timing rules are employed[Kashino and Tanaka, 1993] .
5.2 Bottom-up processing modules
There are two bottom-up processing modules in OP TIMA: NHC (Note Hypothesis Creator) and CHC (Chord Hypothesis Creator). NHC is a H-Creator for the note layer, and performs the clustering for sound formation and the clustering for source identification to create note hypotheses. It uses the perceptual rules for the clustering for sound formation, and the timbre mod els for discrimination analysis of timbres to identify the sound source of each note. CHC is a H-Creator for the chord layer, which creates chord hypotheses when note hypotheses are given. It refers to chord naming rules in the knowledge sources.
5.3 Top-down processing modules
FCP (Frequency Component Predictor) and NP (Note Predictor) are the top-down processing modules. FCP is a H-Correlator between the note layer and the fre quency component layer, and evaluates conditional prob abilities between hypotheses of the two layers, consulting tone memories. NP is a H-Correlator between the chord layer and the note layer, to provide a matrix of condi tional probabilities between those two layers. NP uses the stored knowledge of chord-note relations.
5.4 Temporal processing modules
There are also temporal processing modules: CTP (Chord Transition Predictor) and CGC (Chord Group Creator). CTP is a H-Correlator between the two ad jacent chord layers, which estimates the transition prob ability of two N-grams (not the transition probability of two chords) , using the chord transition knowledge source. CGC decides the M-Link between the chord layers and the note layers. In each processing scope, CGC receives chord hypotheses and note hypotheses. Based on rhythm information extracted in the prepro cessing stage, it tries to find how many successive scopes correspond to one node in the chord layer, to create M Link instances. Thus the M-Link structure is formed dynamically as the processing progresses.
6 Evaluation
We have performed a series of evaluation tests on the sys tem: frequency component level tests, note level tests, chord level tests, and tests using sample song perfor mances. In this section, a part of the results will be presented.
6.1 Note Level Benchmark Tests
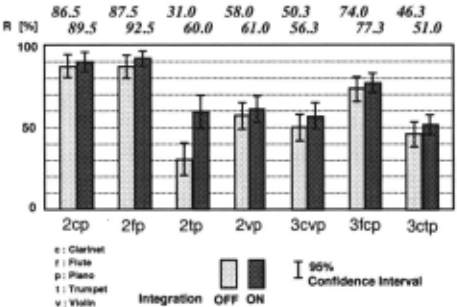
An example of the experimental results for the N-level evaluation is displayed in Figure 7, which shows the ef fect of information integration to the note recognition rates. In Figure 7, tests have been performed in two ways: perceptual sound organization (1) without any in formation integration and (2) with information integra tion at the N-level. In the former case, the best note hy pothesis produced by the bottom-up processing (NHC) is just viewed as the answer on the system, while in the latter case the tone memory information given by FCP is integrated. In both cases, we used two kinds of ran dom note patterns: a two simultaneous note pattern and a three simultaneous note pattern. Both patterns were composed by a computer and performed by a MIDI sam pler using digitized acoustic signals (16bit , 44.1kHz) of natural musical instruments (clarinet, flute, piano, trum pet , and violin) . The recognition rate was defined as
where right is the number of correctly identified and correctly source-separated notes, wrong is the number of spuriously recognized (surplus) notes and incorrectly identified notes, and total is the number of notes in the input . Since it is sometimes difficult to distinguish sur plus notes from incorrectly identified notes, both are in cluded together in wrong. Scale factor 1/2 is for nor malizing R: when the number of output notes is the same as the number of input notes, R becomes 0 [%] if all the notes are incorrectly identified and 100 [%] if all the notes are correctly identified by this normalization. The results in Figure 7 indicate that integration of tone memory information has significantly improved the note recognition rates of the system.
6.2 Chord Level Benchmark Tests
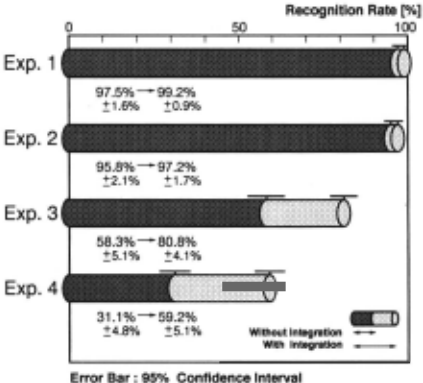
Another example of the experimental results shows the efficacy of S-level information integration for the chord recognition rates (Figure 8). In this test , we chose a sample song with chord transition of 18 chords. Based on this chord transition pattern, test note groups were composed. To these 18 test note groups, noise (random addition or removal of the note) was added in four ways: (Exp.1) one noise note in one chord among 18 chords, (Exp.2) two noise notes in one chord among 18 chords, (Exp.3) one noise note in each of 18 chords, (Exp.4) two noise notes in each of 18 chords. Figure 8 displays significant improvement of chord recognition rates by our information integration scheme.
Error Bar : 95% Confidence Interval
Figure 8: Results of benchmark tests for chord recognition
6.3 Evaluation Using a Sample Music
In addition to the benchmark tests by artificial test data, we have evaluated the system using music sound signals. Figure 9 shows the note and chord recognition rates for a sample song: a three part chamber ensemble of "Auld Lang Syne" performed by a sampler using acoustic sig nals of a flute, clarinet and piano. Figure 9 clearly shows that information integration is effective not only in a test data but also in a music performance.
7 Related Work
Based on the physiological and psychological findings such as the ones Bregman has summarized [Bregman, 1990], Brown and Cooke developed a computational au ditory scene analysis system [Brown and Cooke, 1992]. However, it was basically a bottom-up based system, and effective integration of information was not considered. From a viewpoint of information integration, Lesser et al. proposed IPUS, an acoustic signal understanding sys tem based on the blackboard architecture[Lesser et al., 1993], and recently Cooke et al. have also considered a blackboard-based auditory scene analysis system[Cooke et al., 1993]. The blackboard architecture used in those systems requires global control knowledge and tends to result in a system with complex control rules. By con. trast, our model only needs the local computations and consequently supports a simple control strategy with theoretically proved stability. Recently Nakatani et al. reported their studies based on a multi·agent scheme [Nakatani et al., 1994]. Our model can be viewed as a quantitative version of a multi·agent approach which uses probability theory.
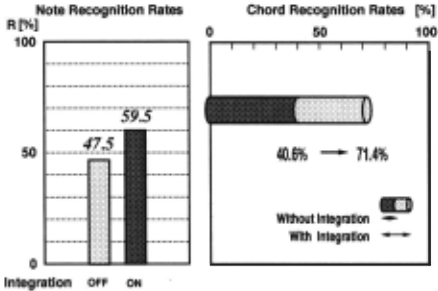
Figure 9: Note and chord recognition rates for a sample music
8 Conclusion
We have proposed a method of hierarchical organization of perceptual sound, and described a configuration and behavior of the process model. Based on the model, a music scene analysis system has been developed. Specif· ically, our employment of a hypothesis network has per· mitted autonomous, stable and efficient integration of multiple sources of information.
The experimental results show that the integration of chord information and tone memory information signifi· cantly improves the recognition accuracy for perceptual sounds, in comparison with a conventional bottom·up based processing. Here we have focused on the mech· anism of information integration and left out detailed discussions on optimality of the output of each process· ing module. We are planning to clarify theoretical limits of the accuracy of each processing module, and to con· duct further experiments to evaluate systematically the advantages and disadvantages of information integration mechanism of the proposed model.
@inproceedings{ijcai1995p21,
  title     = {Organization of Hierarchical Perceptual Sounds: Music Scene Analysis with Autonomous Processing Modules and a Quantitative Information Integration Mechanism},
  author    = {Kashino, Kunio and Nakadai, Kazuhiro and Kinoshita, Tomoyoshi and Tanaka, Hidehiko},
  booktitle = {Proceedings of the Fourteenth International Joint Conference on
               Artificial Intelligence, {IJCAI-95}},
  publisher = {International Joint Conferences on Artificial Intelligence},
  editor    = {Chris S. Mellish},
  pages     = {158--163},
  year      = {1995},
  note      = {Action and Perception},
  url       = {https://ijcai.org/proceedings/1995/21},
}
TY - CPAPER TI - Organization of Hierarchical Perceptual Sounds: Music Scene Analysis with Autonomous Processing Modules and a Quantitative Information Integration Mechanism AU - Kashino, Kunio AU - Nakadai, Kazuhiro AU - Kinoshita, Tomoyoshi AU - Tanaka, Hidehiko T2 - Proceedings of the Fourteenth International Joint Conference on Artificial Intelligence, IJCAI-95 PB - International Joint Conferences on Artificial Intelligence PY - 1995 SP - 158 EP - 163 UR - https://ijcai.org/proceedings/1995/21 ER -Copied
Machine-readable versions of this paper, for tools and AI agents:





