
A RANSAC-Based Approach to Model Fitting and Its Application to Finding Cylinders in Range Data
Proceedings of the Seventh International Joint Conference on Artificial Intelligence. Vision: 3-d. Pages 637-642.
© 1981 International Joint Conferences on Artificial Intelligence
Abstract
General principles for filling models to data containing "gross" errors in addition to "measurement" errors are presented . A filling technique is described and illustrated by its application lo the problem of locating cylinders in range data ; lwo key steps in this process are filling ellipses lo partial data and filling lines to sets of three-dimensional points . The technique is specifically designed lo filter out gross errors before applying a smoothing procedure to compute a precise model. Such a technique is particularly applicable to computer vision tasks because the data in these tasks are often produced by local computations that are inherently unreliable.
- R.C . Bolles and M.A. Fischler, "A RANSAC-Based Approach to Model Filling and Its Application to Find- ing Cylinders in Range Data," SRI Technote 235 (March 1981).
- G.J. Agin and T.O. Binford, "Computer Description of Curved Objects," Proceedings of JJCAI-73 , pp . 629-640 (August 1973). IJCAI
- R. Nevalia and T.O. Binford , "Structured Descriptions of Complex Objects, " Proceedings of /JCAI-73 , pp. 841 -647 (August 1973). IJCAI
- M. Oshima and Y. Shirai, "Representation of Curved Objects Using Three-Dimensional Information," Proceedings of the Second. USA-JAPAN Camputer Canference , pp. 108-112 (1975).
- R.J . Popplestone, C.M. Brown, A.P. Ambler, and G.F. Crawford, "Forming Models of Plane-and-Cylinder Faceted Bodies from Light Stripes," Proceedings of /JCA!-75 , pp. 664-666 (September 1975).
- B.!. Soroka, "Understanding Objects From Slices: Extracting Generalised Cylinder Descriptions From Serial Sections, " Ph.D. Thesis , University of Kansas (March 1979).
- S. Tsuji and F. Matsumoto, "Detection of Ellipses by a Modified Hough Transformation," IEEE 'l'ransactians an Computers , Vol . C-27, No . 8, pp. 777-761 761s
References were extracted automatically from the PDF and may contain errors.
Full text extracted automatically from the PDF; figures, tables and equations may differ. The PDF is the version of record.
A RANSAC-BASED APPROACH TO MODEL FITTING AND ITS APPIJCATION TO FINDING CYLINDERS IN RANGE DATA *
Robert C BoUes Martm. A. Fischler
SRI lnlerational, 333 Ravenswood Avenue , Menlo Park, CA 94025
General principles for filling models to data containing "gross" errors in addition to "measurement" errors are presented. A filling technique is described and illustrated by its application lo the problem of locating cylinders in range data; lwo key steps in this process are filling ellipses lo partial data and filling lines to sets of three-dimensional points. The technique is specifically designed lo filter out gross errors before applying a smoothing procedure to compute a precise model. Such a technique is particularly applicable to computer vision tasks because the data in these tasks are often produced by local computations that are inherently unreliable.
I INTRODUCTION
A common problem in computer vision is the fitting of an analytic model, such as a curve or surface, to data con taining two types of errors: "measurement" errors and "gross" errors (i.e ., classification errors) . Measurement errors can often be adequately modeled as small, normally distributed deviations from the model to be filled, whereas gross errors arc relatively large and unpredictable. An example of this kind of problem is the titling of a plane to a set of points. most of which belong to the plane, but some of which are from other surfaces in the scene .
A program lo p~rform such filling must include tech niques lo:
- Filter out gross errors
- Smooth out measurement errors
- Evaluate proposed fils
- Incorporate a priori constraints.
The traditional least-squares filling technique [ 1} is basi cally a computationally convenient smoothing procedure that computes the optimum fit (with respect to a squared error metric) for tasks in which the errors are normally distributed. The technique is limited to linear models and linear constraints (i.e ., the models and constraints are linear in the set of unknown parameters); it has no built-in mechanism to tllter out gross errors; and il provides only a single number as the basis for evaluating a til. Therefore, by itself, least squares adequately performs only one of the four operations listed above.
Least squares, or any linear smoothing technique, can be applied to a nonlinear problem by iteratively apY-lying it to locally linearized subspaces of the search space l2.3}. To do so, it is necessary to start with a good initial estimate of the model parameters and to formulate a linear approxima tion, of the search space in a neighborhood containing a proposed set of parameter values. This iterative approach is one of the best ways to fit nonlinear models, even though it is essentially a hill-climbing technique, which implies that it may not converge or find the global optimum. Obviously, other techniques do exist for global optimization, but they arc often less general, and almos t always much more expensive computationally.
· The work reported herein was supported by lhe National Science Foundation under grants DAR792224 B and ECS-79-17028.
Many heuristics based on the iterative application of a smoothing technique have been proposed to filter out gross errors. The basic theme of these heuristics is to use all the data to derive a set of model parameters, locate the datum that is farthest from the instantiated model, assume that it is a gross error, delete it, and iterate this process until the maximum deviation of the data from the currently instan tiated model is less than some threshold, or until there is no longer sufficient data to proceed. Even though it is easy to show that a single gross error can cause these heuristics to fail , in practice they have been quite useful, successfully deleting gross errors when only a few such errors exist. Our contention is, however, that smoothing is not an appropriate technique to apply to an "unverified" data set, especially when the data set may contain a large percen tage of gross errors (say 20 percent or more). In this paper we present a two-step fitting procedure that employs a tlltering techniCJUe, which we call Random Sample Con sensus (RANSAC) [ 4}, specifically designed to handle data sets containing a large number of gross errors.
Our basic approach is the following :
- Compute initial estimates of the model parameters and eliminate gross errors .
- Compute an improved tl.t by applying a smoothing technique, such as least squares, to the filtered data.
The first step involves two tasks that arc so intimately related that it is impossible to separate them: computing a "reasonable" estimate of the parameters inherently implies an evaluation of each point's validity, and evaluating a point's consistency with a model requires an instantiated model and thus an estimate of the model parameters. One might further note that the tlltering task can be viewed as a restatement of the classical partitioning problem for scene analysis.
In the remainder of this paper we describe how to use RANSAC to perform Step 1, brietl.y describe how to use an iterative least-squares approach for Step 2, present our ideas on how to evaluate a proposed fit, and then illustrate these ideas by showing how they can be applied to find cylinders in range data.
D YILTERING AND COMPUTING D1JI1AL cmliATES
The philosophy of the RANSAC tlltering technique is opposite to that of conventional smoothing techniques. Rather than using as much of the data as possible to obtain an initial solution and then attempting to eliminate the invalid data points, RANSAC uses as small an initial data set as is feasible and enlarges this set with consistent data when possible. For example, given the task of fitting a circle to a set of two-dimensional points, the RANSAC approach would be to select a set of three points (since three points are required to determine a circle) , compute the implied circle, and count the number of points close enough to that circle to suggest their compatibility with it (i.e ., their devi ations are small enough to be measurement errors). H there are enough compatible points . RANSAC passes the parameters of the circle and the set of mutually consistent points to a smoothing technique to compute an improved estimate for the parameters. It there are not enough com patible points, another triple of points is selected and tested. This process is repeated until a sutliciently large set of compatible points is found or until some predeter mined number of trials is made.
Given a specific task, the following elements must be present before using RANSAC:
- The minimum number of data points required to instantiate a model.
- A procedure to compute a model from the minimum number of points.
- The expected magnitude of the measurement errors.
- The minimum number of compatible points required to suggest a valid instance of the model.
- The number of trials to be made before giving up.
The number of points that define a model is generally small. Three points define a plane; four correspondences define an one-to-one mapping between two planes; and five points define a conic section. The maximum error allowed for compatible points is generally somewhat larger than the expected measurement error because the initial model parameters are determined by points that are also in error.
The basic requirement for the threshold on the number of compatible points is that it should be large enough to avoid accidental alignment. For example, if the task is to fit planes to a set of data points that may be from two or three different planes, the threshold should be set high enough to avoid accepting planes defined by points from distinct planes that just happen to be coplanar. Task-dependent considerations may be needed to deter mine this threshold. Fortunately, in most tasks the avail able number of points associated with each valid instance of a model is generally much larger than the number of points that might accidentally be consistent with an incorrect instance . Thus, in practice, establishing a reason able threshold for distinguishing between valid and "accidental" fits poses no problem.
Given an estimate of the probability that a datum is a gross error (based on physical considerations associated with the data acquisition process and semantic or contex tual considerations), it is possible to estimate the number of trials required to select a sample of a certain size that contains no sross errors. A set of formulas for this task is derived In [4J.
W APPLYIN�~ lEAST-SQUARe:; nx:HNJQUE
If the unknown parameters in a model are linearly related, the best least-squares solution for the parameters can be directly computed f 1). If the parameters are not linearly related, the least-squares solution to the linear problem can be embedded in an iterative solution to the nonlinear problem. The idea is to approximate the surface about the estimated parameter values by a hyperplane, solve that linear problem, and iterate until the desired pre cision has been achieved. If the hyperplane is determined by the partial derivatives of the function relating the parameters, this approach is similar to a multidimensional Newton-Raphson method. (See [2) or [3) for a more detailed description of this approach.)
The advantages of this approach are that it has qua dratic convergence (when it converges), the data can be weighted according to their measured precision, and the parameters can be constrained to lie within specific ranges. The disadvantages are that an initial set of parameter values is required, the method may not converge, and it may not converge to the global optimum. We have used this method to fit curves, surfaces, and correspondences, and have had very little trouble with the method not converging or converging to the wrong values unless the solution was undcrdetcrmined or the data contained several gross errors.
IV EVALUATING ~FIT
Given a set of data and a proposed (hypothesized) model. how does one decide whether or not the· model is an accurate description of the data? It is difficult to think of a more pervasive question. Most of statistics, and much of the methodology of science, revolves around ways to answer this question; a full treatment of the issues involved in model evaluation are well beyond the scope of this paper. We limit our discussion here to justifying the particular approach we have adopted.
The approach we employ is based on the following viewpoint :
If one subtracts the predictions of a proposed model from the experimentally measured values, then the residuals should be independent (uncorrelated) . To the extent that the measure ments have a natural spatial or temporal order ing, the sequence of residuals should have the characteristics of "white noise."
What we are saying is that AU. of our ability to predict the experimentally measured values should be embedded in the proposed model. If the residuals show any significant degree of correlation, then a more effective/accurate model can be constructed to explain the given experimen tal data. In a more important sense. the existence of correlated residuals can indicate an invalid model or faulty data.
As a consequence of the above viewpoint, and to limit the required computational burden, we have selected the following statistics to evaluate (i.e .. compare, accept, or reject) the quality of the fit of a proposed model to a set of experimental data:
Error-Tolerance-Test: The percentage of residuals that lies within a context-dependent tolerance band (this is the basic RANSAC evaluation metric) .
Sign-Test: The ratio of positive to negative residuals (ignoring very small values).
Run-Length-Test: The length of the longest sequence of monotonically increasing or decreasing residuals (allowing for a small amount of hysterisis) .
The error tolerance test (based on problem-dependent parameters) provides the primary basis for accepting or rejecting a model [ 4). The sign and run-length tests are perfectly general in that they require no problem dependent information, but are obviously weaker and thus can provide only secondary evaluation criteria.
The sign test assumes that the signs of the residuals are determined by independent Bernulli trials with equal probabilities of positive or negative excursions. The stan dard deviation of the absolute difference between the number of positive residuals and the expected number of positive residuals (for a large number of trials, n) is .5v'7i. . Thus, if D is the absolute difference between the number of positive . and negative residuals, we can reject the hypothesis that the proposed model is unbiased at a 95 percent level of confidence when D>2v'7i. ·
The run-length test assumes that the signs of the differences between sequentially taken measurements are determined by independent Bernulli trials with equal pro babilities of pos1t1ve and negative increments. It can be shown that with confidence level b, we can reject the hypothesis that the sequence of residuals is uncorrelated when the longest run exceeds r, where :
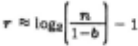
Thus, for (b =.9'>) we have r ~ 3.32+log2n .
V f'INDING CYUNDERS IN RANGJo: DATA
We recenlly started a project to investigate ways of recognizing industrial parts jumbled together in a pile . Since we arc restricting our attention to industrial tasks, we generally know the universe of parts the system is likely to sec, and we can control the environment to simplify data acquisition. In particular, we believe that range sensors will soon be economical for such an environment. Therefore, one aspect of our research is to develop techniques for using a part model to quickly and reliably locate occurrences of the part in a combination of range and Intensity data.
The first task we have set for ourselves is to find cylinders (with a known diameter) in range data. The data for this experiment are gathered, one slice at a time , from a simple, structured-light range sensor as diagramed in Figure 1 (see [5] for a more detailed description of the data acquisition system) . Several computer vision programs locate cylinders in range data [6,7,8,9,10] , but they are computationally expensive and arc untried in complex domains . Intuitively, knowing .the diameter of the cylinder significantly reduces the complexity of the problem. The question is how to use the known diameter to increase the speed and reliability of locating cylinders.
Since the intersection of a plane and a cylinder is an ellipse (in the plane) whose minor diameter is equal to the diameter of the cylinder, our idea is to fit ellipses con strained to have the proper minor diameters to all curved segments along the intersection line , find clusters of simi lar ellipses by histogramming the orientations and major diameters of the ellipses, and then use RANSAC to partition the clusters into groups of ellipses belonging to individual cylinders . The histogramming can be done quickly. There fore , the viability of such an approach depends on the speed and precision of ( 1) fitting ellipses with a known diameter to partial data, and (2) "RANSACing" lines to sets of three-dimensional points (to find the cylinder axes) . In this section we describe the application of the general curve-fitting principles discussed in previous sections to these two problems.
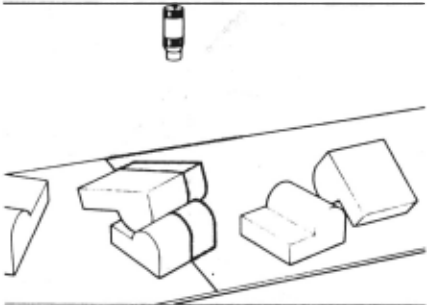
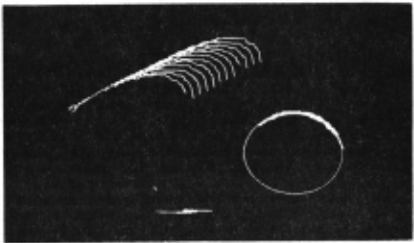
Figure 2 shows the intersection of the light plane with a simple scene containing two cylindrical castings; Figure 3 shows a composite picture formed from 12 slices of those two castings. The cylinder-finding program first classifies the segments. of the intersection into one of three types according to their curvature and length -- straight lines, circular arcs, and elliptical arcs - and then tries to fit cir cles to the cirular arcs and ellipses to the elliptical arcs. The circular arcs are treated separately because the ellipse titter has trouble converging on them. Since a circle does not have a distinct orientation, almost all values of the ellipse's orientation parameter are equal, causing the itera tive procedure to wander.
Figure 2 The intersection of the light plane and two cylindrical castings
Figure 3 Twelve slices along the two castings shown in Figure 2
The arcs look circular more often than one might think. The ratio of the minor diameter of the intersection ellipse to its major diameter is equal to the cosine of the angle between the axis of the cylinder and the normal to the plane of light. Therefore, at 30 degrees this ratio is .866, which corresponds to an ellipse that is only slighlly elongated. Since the available range data cover only approximately one third of each ellipse, this elongation is not enough to reject a circular model. Thus, circles can generally tit the intersections from cylinders within this 3(}-degree interval.
A. 1l!:Y!!& Dlipees
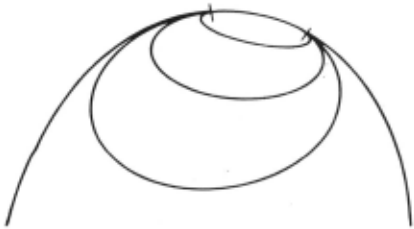
AB shown in Figure 4, points along a small portion of an ellipse do not adequately define it. Knowing the length of the minor diameter, however, significantly reduces the number of possible matches. The question is how to use the minor diameter to fit ellipses to such short segments.
In our particular task the data presented to the ellipse fitter are generally free of gross errors because the process that segments the Intersection line into line segments, cir cular arcs, and elliptical arcs works quite well. The data contain measurement errors due to quantization errors, calibration errors, and noise, but the lack of gross errors Implies that a global smoothing technique Is appropriate. However, since the parameters of an ellipse are not linearly related, an iterative fitting procedure is required, and to start such a procedure requires initial parameter esti mates . We have experimented with three methods for com puting initial estimates of an ellipse's parameters:
Linear-Least-Squares: First, use a least-squares tech nique to til a general second-order curve of the form:
~+bXY+cy2+dX+eY+J =0
to all the data, then determine whether or not the result is an ellipse with approximately the right minor diame ter . lf so. use the parameters of the ellipse as the initial parameter values; i[ not, try another method.
Construction: Firs t , use two sets of parallel chords to estimate the center of the ellipse; then use the known minor diameter and a theorem about cen tral right angles to estimate the major diameter; and finally use the positions of the extrema to estimate the orientation.
RANSAC: Iteratively select sets of five points, compute the general second-order curve that passes through them, and then determine whether or not the result is an ellips·e that has approximately the right minor diameter and comes close to a sufficiently large number of the points . If so, use the parameter values; if not, try another set of five points.
Since the parameters of an ellipse with a known diameter are not linearly related, it is not possible to directly apply a least-squares technique to all the data and produce a solu tion. However, since the coefficients of a general second order equation, which may represent an ellipse, a hyper bola, or a parabola, are linearly related, we can solve for them in hopes thatthc result is an ellipse of the right size .
The form of the second-order curve used in the linear least-squares method was chosen because its coefficients could be directly computed from a list of points on the curve. It is not a completely general second-order curve because the leading coefficient is set to 1, which implies that the curve cannot be a parabola with its axis parallel to the x-axis . But this limitation does not affect us because we are looking only lor ellipses .
In theory, the points along an arc in the data from a cylinder form an ellipse; however, in practice, measure ment errors perturb the points . These perturbations, although relatively small , can dramatically affect the curve produced by the least-squares technique because the data cover such a small section of the ellipse. These perturba tions may even change the curve from an ellipse to a para bola or hyperbola. The better the data, the less likely these abrupt changes.
In the construction method we use two facts about ellipses that are illustrated in Figure 5. The first fact is that a line through the centers of two parallel chords passes thro~h the center of the ellipse. (This result , which we derived (5], is a generalization of the fact that a line joming two points on a ellipse with the same slope passes through the center of the ellipse. This latter fact has been used by Tsuji et al. to locate elli(>ses, but it requires them to be almost completely visible l11 ).) Two sets of paralle l chords uniquely determine the center of the ellipse.
Having found the center of the ellipse, we use the second fact, which states that the sides of a right angle whose vertex is at the center of the ellipse are related by the formula shown in Figure 5, where R is a constant for the ellipse. (This fact was also used by Tsuji et al. to separate concentric ellipses [ 11 ).) We construct a right angle at the center and use the length of the minor diameter to com pute the length of the major diameter. To determine the orientation, we first find the points on the arc that are closest to the center and farthest from the center, use the lengths of the major and minor diameters to verify that they are extrema, and then compute the orientation from one or more of them.
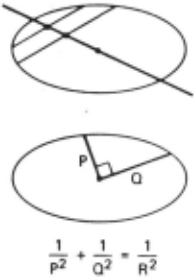
- (a) A line through the centers of parallel chords passes through the center of the ellipse.
- (b) The sides of a central right angle are related in a specific way.
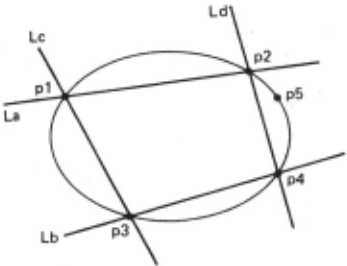
Figure 6 A simple way to compute the conic sec tion through nve points
The parallel chord method for estimating the center of the ellipse is the least reliable step in this method, being particularly susceptible to noise when the visible arc is a relatively straight section of the ellipse. This is because small perturbations can significantly change the positions ot the parallel chords. Thus, this method probably should be considered only when the high curvature portions of the ellipse are visible.
In the RANSAC method of estimating ellipse parame ters, the general second-order curves to be tested are directly computed from sets of five points. For each set, four lines are constructed as shown in Figure 6. The coefficients of the quadratic in X and Y are computed by evaluating the linear equation:
where:
at the fifth point and solving for >... This computation is a fast and accurate way to compute the conic section deter mined by five points . However, it too is sensitive to small perturbations of the points. For example, given the points:
97.76806, 12.60560
65.21025, 45.48765
29.67267, 57.26032
.0000000, 60.00000
-29.67267, 57.26032
which are on the ellipse :
,
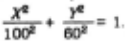
Incrementing the Y coordinate of the third point by 1.0 changes the fitted curve from an ellipse to a hyperbola. To overcome this sensitivity, sets of five points are tried until the implied ellipse fits the data well. Tl)us, while all the methods for obtaining an initial estimate of the ellipse parameters are sensitive to noise , RANSAC is the only approach that gives one the option of trading search time for an acceptable solution.
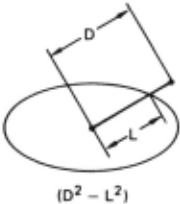
Given initial estimates of the ellipse parameters from one of these three methods, we use an iterative least squares technique to improve the estimates . The quantity to be minimized is shown in Figure 7. This metric is used instead of the perpendicular distance to the ellipse because it is significantly easier to compute (see [5] for the exact formula used and its partial derivatives) .
B. RANSA.Cin.g Lines
Given a set of similar ellipses, we partition it into sub sets that correspond to individual cylinders by locating groups of ellipses whose cPnters lie along three-dimensional lines (which are the axes of the cylinders) . In this task lhc data may contain gross errors because there are two or more parallel cylinders in the data or because the grouping procedure included an incorrect ellipse . RANSAC is used to find the axes . A pair of centers is selected; the line passing through them is computed, and the number of other centers lying within the expected measurement error of that line are determined. If the number of compatible centers is larger than some threshold, that subset of points is used to hypothesize a cylinder; otherwise, another pair of centers is selected.
C. AnEulnple
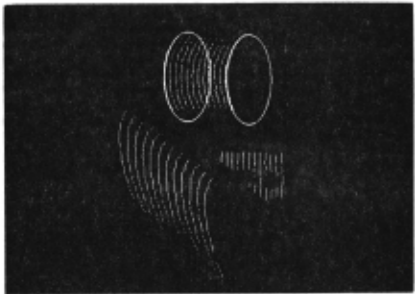
Figure 6 shows a set of 12 slices taken from the two cylinders in Figure 2. The arcs at the top of the picture are almost circular in the plane of light because the cylinder is almost perpendicular to that plane. The program fits cir cles with the appropriate diameter to these arcs after they have been transformed into the plane of light. Two of these circles are shown in Figure 6. They appear as ellipses in the picture because they have been transformed back into the image plane of the camera that took the data. Figure 9 shows the same data, but from a point on the axis of the cylinder associated with the circular intersections. Notice the set of elliptical arcs from the cylinder lying on top of the located one .
Figures 10 through 12 illustrate the process of finding a cylinder from a set of elliptical intersections. Ellipses are fitted to the arcs arter they have been transformed from the image plane into the plane of light. Figure 10 shows the initial ellipses produced by the procedures to estimate the ellipse parameters. Figure 11 shows the ellipses produced by fixing the length of the minor diameter and iteratively improving the initial estimates. And finally, Figure 12 shows the ellipses produced after histogramming and identifying a set of ellipses that corresponds to one cylinder. For this fit the orientations and major diameters of the ellipses were set to the averages of the parameters for all ellipses associated with the cylinder .
D. DiBCuslli.on
The intersection of the plane of light and an object is a relatively thin line, but since there is some thickness, it appears as a line several pixels wide in an image. Which points in the image should be defined to be on the plane? For simplicity, most range acquisition systems that use a projected light plane have selected one point in each row of the image (e.g., see (9]). Usually they choose the middle pixel of the first long run of pixels that are "on." However, since the images are perspective images, there may be more than one valid intersection per row. More impor tantly, when the intersection line is horizontal in the image, the row centers are completely wrong (see Figure 13). Since some of the most important data for our task are obtained from horizontal or almost horizontal intersec tions, we apply a thinning algorithm (see [ 12]) to produce a center line that is independent of the intersection's orien tation in the image . This cente~ line still may not lie in the light plane, but it is close, and to first order it is indepen dent of the camera's focus and the threshold used to pro duce the binary picture.
As mentioned in the discussion about how to evaluate a fit, an error in the fit can be due to an incorrect model as well as to inaccurate parameter values. We have used this principle to check our range data. The data shown in Fig ure 14 were taken from two cylinders perpendicular to the plane of light. The intersections should be circles whose diameters equal the diameters of the cylinders. However, as can be seen in Figure 14 and as confirmed by our evalua tion criteria, the data contain a slight systematic tlattening that cannot be accounted for by the circular models. We have not determined why this occurs.
Our approach to finding cylinders applies task dependent knowledge (i.e., tht~ known diameter of the cylinder) at the time the program fits ellipses. It does not use the position of one elliptical section to help find the next one. The fact that cylinders occupy a continuous volume In space that leads to sets of similar ellipses is used later in the histogramming step. This decision raises an important question of when to apply contextual knowledge . When the data are good, it is computationally effective to find the ellipses independently and perform a global histo gramming. If the data are degraded, the volume model of a cylinder would have to be used earlier.
'VI CQNCI.UDING Rfl!IIARKS
We have presented a conceptually new way to approach the problem of fitting a model to data containing gross errors -- a fundamental problem in science. Although we have concentrated on the problems of finding lines, ellipses, and cylinders, our approach to tilting is applicable to most problems in which the data may contain gross errors. It is robust in the sense that any gross errors are filtered from the data before a smoothing technique, such as least squares, is applied. It is slow compared to a single application of a smoothing technique, but Its results are unaffected by gross errors.
We briefly described the application of this approach to the problem of locating cylinders with a known diameter in range data. We used it in two different tasks: estimating Figure 10 The initial ellipses for the elliplical arcs Figure 12 The final ellipses ellipse parameters and locating groups of ellipses that belong to different cylinders. In the first task the full power of RANSAC was not required except when the data had not been correctly segmented. In the second task the basic use of RANSAC was to perform a segmentation. i.e., partition a set of points. We believe that the RANSAC para digm provides a general way to perform partitioning and we plan to investigate its properties when applied in this way.
Figure 11 The iteratively improved ellipses
We also presented the basis for an approach to evaluat ing a fit that is independent or the method used to produce the til. We plan to investigate ways of making this evalua Uon procedure an integral component of our filling lech mques.
- [ 1] F.A. Graybill, An Jntrod:u.ctian to Linear Statistical Models, Volume I, McGraw-Hill Book Company, 1961.
- D.B. Gennery, "Least-Squares Stereo-Camera Calibra tion," Stanford A. I. Project internal memo ( 1975).
- (3] R.C. Bolles, "Verification Vision within a Programmable Assembl.)l System," Ph. D. Thesis, Stanford A. I. Memo No. 295 (December 1976).
- (4] M.A. Fischler and R.C. Bolles, "Random Sample Con sensus: A Paradigm for Model Fitting with Applications to Image Analysis and Automated Cartography," to appear in the Communication.~ of the ACM (1961) .
- R.C. Bolles and M.A. Fischler, "A RANSAC-Based Approach to Model Filling and Its Application to Find ing Cylinders in Range Data," SRI Technote 235 (March 1981).
- (6] G.J. Agin and T.O. Binford, "Computer Description of Curved Objects," Proceedings of JJCAI- 73 , pp. 629-640 (August 1973).
- R. Nevalia and T.O. Binford, "Structured Descriptions of Complex Objects," Proceedings of /JCAI- 73 , pp. 841-647 (August 1973).
- (6] M. Oshima and Y. Shirai, "Representation of Curved Objects Using Three-Dimensional Information," Proceedings of the Second. USA- JAPAN Camputer Canference , pp. 108-112 (1975).
- (9] R.J . Popplestone, C.M. Brown, A.P. Ambler, and G.F. Crawford, "Forming Models of Plane-and-Cylinder Faceted Bodies from Light Stripes," Proceedings of /JCA!- 75 , pp. 664-666 (September 1975).
- B.!. Soroka, "Understanding Objects From Slices: Extracting Generalised Cylinder Descriptions From Serial Sections," Ph.D. Thesis , University of Kansas (March 1979).
- S. Tsuji and F. Matsumoto, "Detection of Ellipses by a Modified Hough Transformation," IEEE 'l'ransactians an Computers , Vol . C- 27, No . 8, pp. 777-761 761s
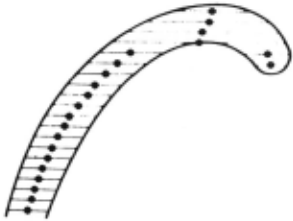
Figure 14 Circles fit to two "circular" arcs
@inproceedings{ijcai1981p119,
  title     = {A RANSAC-Based Approach to Model Fitting and Its Application to Finding Cylinders in Range Data},
  author    = {Bolles, Robert C. and Fischler, Martin A.},
  booktitle = {Proceedings of the Seventh International Joint Conference on
               Artificial Intelligence, {IJCAI-81}},
  publisher = {International Joint Conferences on Artificial Intelligence},
  editor    = {Patrick J. Hayes},
  pages     = {637--642},
  year      = {1981},
  month     = {8},
  note      = {Vision: 3-d},
  url       = {https://ijcai.org/proceedings/1981/119},
}
TY - CPAPER TI - A RANSAC-Based Approach to Model Fitting and Its Application to Finding Cylinders in Range Data AU - Bolles, Robert C. AU - Fischler, Martin A. T2 - Proceedings of the Seventh International Joint Conference on Artificial Intelligence, IJCAI-81 PB - International Joint Conferences on Artificial Intelligence PY - 1981 SP - 637 EP - 642 UR - https://ijcai.org/proceedings/1981/119 ER -Copied
Machine-readable versions of this paper, for tools and AI agents:





