
Computer Description of Curved Objects
Proceedings of the Third International Joint Conference on Artificial Intelligence. Perception for Robots. Pages 629-639.
Abstract
A ranging system, consisting of a laser, computer-controlled optical deflection assembly, and TV camera, obtains threedimensional images of curved, solid objects. The object is segmented into parts by grouping parallel traces obtained from the ranging system. Making use of the property of generalized translational invariance, the parts are described in terms of generalized cylinders, consisting of a space curve, or axis, and a circular cross section function on this axis. DESCRIPTIVE PHRASES: Computer vision, three-dimensional imaging, recognition of curved objects.
- Agin, Gerald J., "Representation and Description of Curved Objects," Ph.D. thesis, Stanford University, 1972.
- Binford, T. 0., and Agin, G. J., "Description of Curved Objects," in preparation.
- Horn, B. K. P., "Shape from Shading: A Method for Finding the Shape of a Smooth Opaque Object from One View," Ph.D. thesis, MIT I 1972.
- Krakaur, L., Ph.D. thesis, MIT, 1970.
- Nevatia, R. K., and Binford, T. 0., "Structured Descriptions of Complex Objects," submitted for Third IJCAI, 1973. IJCAI
- Shirai, Y., and Suwa, M., "Recognition of Polyhedrons with a Range Finder," Second IJCAI I 1971. IJCAI
- Sobel, I., "Camera Models and Machine Perception," Stanford Artificial Intelligence Memo AIM-121, May, 1970.
- Will, P. M., and Pennington, K. S., "Grid Coding: A Preprocessing Technique for Robot and Machine Vision," Second IJCAI, 1 971 . IJCAI
References were extracted automatically from the PDF and may contain errors.
Full text extracted automatically from the PDF; figures, tables and equations may differ. The PDF is the version of record.
Introduction
This paper describes some research recently undertaken at the Artificial Intelligence Laboratory at Stanford University, to lay a foundation for the recognition of curved, three-dimensional objects. It summarizes portions of a Ph.D. thesis completed in 19721
Recognition of curved objects is a very new field. The only prior work ~e are aware of are the work of B. K. P. Horn and of N. Krakaur4. Horn was able to reconstruct depth contours of a surface from a two dimensional image, bas~d on assumptions about the reflectivity characteristics of the surface, and knowledge of lighting conditions. Krakaur was able to distinguish among several kinds of fruit by analyzing the connectivity and structure of brightness contours in a two-dimensional image. Neither of these projects attempted to solve the general problem of recognizing, describing, or modelling curved, three-dimensional objects.
Generalized cylinders and generalized translational invariance have been described by Agin1·, and a fuller exposition is in preparation2. We shall briefly describe
them here.
A generalized cylinder consists of a space curve, or axis, and a cross section function defined on this axis. Given a simple object, its description may be determined by locating
* Employed by IBM Corporation, Endicott,
New York, at the time this research was undertaken.
COMPUTER DESCRIPTION OF CURVED OBJECTS
Gerald J. Agin *
Stanford Research Institute Menlo Park, California
Thomas 0. Binford Stanford University Stanford, California
an axis such that the object's cross section (normal to the axis) varies in a uniform manner along the axis. The cross section is thus "translationally invariant" under some operation which transforms one cross section shape into another. Descriptions of complex objects may be built up by "cutting and pasting" the descriptions of its constituent parts.
These concepts provide a natural, intuitive wa~ of representing solid objects. The pr~mitives of such a model represent portions of solid objects, instead of surfaces or appearances. The method allows segmentation of a complex object into parts easily represented, and a hierarchical approach to the description of objects. Generalized translational invariance is synthetic in nature; that is, given a model in terms of generalized cylinders, the contours of the object may be uniquely s ynthesized. The inverse process, t he generation of a model to represent a given real object, does not yield a unique answer. While the property of generalized translational invariance may be used to find an axis and cross section function for a well-defined segment, the segmentation of an ob j ect into parts, and determining the relationship of the parts relative to each other is a probl em which must be solved by heuristic techniques.
The first part of this paper describes a system whereby a laser and a telev ision camera obtain range information about an actual object or scene, and expla ins t he low level processing to extract useful information. The second part shows how this three-dimensional image is analyzed to s egment an object into parts, and to obtain descriptions of these parts in terms of generalized cylinders.
~ Laser Ranging System
The ranging system may be briefly described as a laser which projects a bar of l i ght on a scene to be scanned, and a television camera which detects the bar of light as it illuminates the scene. A calibration procedure determines the relative position of the laser with respect to the TV camera, so that depth information may be derived from the video image. A general view of the apparatus may be seen in Figure 1 .
Other researchers have used similar systems. Shirai and Suwa6 subst i tuted a slide projector and conventional optics for our laser system. Although the ir system and ours were independently designed, the hardware configurations are rather similar. Will and Pennington8 used a slide projector to project on the scene, not a single bar of light, but a grid of parallel bars. Using their system, they were able to calculate the normal direction to flat faces of polyhedra, but lacking unique identification of individual bars in the image, were unable to extract any absolute or relative depth information directly.
Hardware
We use a Helium-Neon laser, emitting about 35 milliwatts of red light at a wavelength of 6328 Angstroms. Calculations based on limiting sensitivity of the vidicon tube and the optical parameters of the system indicate an output of 10 milliwatts to be the minimum for this application. Our 35 milliwatts appears to be adequate, provided adequate control is maintained of beam focussing and of optical filtering at the camera.
Since the laser is not portable, a periscope and auxiliary mirror allow flexibility in positioning objects and apparatus on the table. (See Figure 1.)
The laser deflection assembly performs three operations on the laser beam: focussing, diverging, and scanning. A view of the assembly is shown in Figure 2. The assembly is mounted on a stand which allows an arbitrary position and orientation for flexibility in setup.
A lens of 500 millimeters focal length perfoms focussing of the beam, narrowing it to about 2 millimeters where it illuminates the scene.
The cylindrical lens diverges the shape of the beam from a spot of light to a bar of light (actually, an elongated ellipse.) The lens is a short piece of glass rod, with a focal length of approximately 4 milli meters. Its effect is to magnify the beam in one direction only (perpendicular to the axis of the rod) to produce a bar or plane of light. A stepper motor may rotate the cylindrical lens (under computer control) to vary the orientation of the bar of light.
A front-surface mirror is mounted on the shaft of another stepper motor, through a gear reduction head. This arrangement can scan the plane of light across the scene on the table, with a resolution of 1728 motor steps per revolution of the output shaft.
An interference filter is sometimes placed behind the lens of the TV camera to screen out ambient illumination, and allow light of the laser's wavelength to pass. A filter with a bandpass of 8.6 Angstroms, and a transmission of about 55 percent at 6328 Angstroms, allows operation of the system in daylight. But because of difficulties in mounting the filter on the camera, usually operation is in a darkened room without any filter.
Operation
Figure 3 is the image of a Barbie* doll in normal and laser illumination. The tabletop has been covered with a dark cloth, to suppress the background of the picture (the tabletop.) The laser bar of light may be seen illuminating the doll, from the right shoulder to the left knee.
The usual mode of operation is to position the bar of light at one edge of the scene, read the TV camera, and process the data obtained for storage on disk. The rotating mirror is then moved, and the process is repeated until the beam has been scanned across the entire scene and the data stored. The cylindrical lens is then rotated 90 degrees and the scene scanned again, resulting in an overlapping grid of laser lines covering the scene.
To scan a typical scene usually requires between five and ten minutes of elapsed time. This time includes some initial setup, user interaction, a one-second settling time each time the rotating mirror is stepped, and computer processing of the image for disk storage.
Line Detection and Thinning
The television input routine returns an array of four bit brightness samples, packed nine to a 36-bit PDP-10 word. To reduce the gross amount of data, this array is searched for nonzero brightness samples. The samples detected are stored on disk, with the raster coordinates and the bright ness value packed in one word per sample. For a typical frame of television data, this results in a net data compression of about 20 to one. Figure 4 plots the nonzero samples detected in one frame from the Barbie doll of Figure 3.
Because the lines thus detected are usually broader than desirable, the centerline is located by making horizontal and vertical "slices" through the array of points. The center of each contiguous set of points along each slice is computed, and retained as the center of the trace.
For each set of contiguous data points from one frame of TV inputs, the program locates the end points, then finds . the shortest path through the data points linking the ends. The points along this path are retained in an ordered list. All other points in the contiguous group are rejected. Also, the program will not retain any segment containing three or fewer points.
Figure 5 shows the points of Figure 4 after thinning and linking. Because of a gap in the data, two independent groups were identified.
* Registered trademark of Mattel, Inc, 5150 w. Rosencrans, Hawthorne, Calif. 90250.
Curve Fitting and Segmentation
The ordered list of points found by the linking operation should be sufficient for the shape analysis phase of our programs. But, because at an earlier time in the course of this research we had been interested in locating corners and edges of objects, and because corners and edges may turn out to be important in the future, segmentation and curve fitting are carried out on the laser lines. Although curve fitting is time consuming, and introduces some additional error into the data, the processing of curves by the shapes analysis program is more efficient than the processing of points along the curve.
Curve fitting is described in detail in Reference [1]. The method amounts to attempting to fit either a straight line or a second-order curve to an ordered list of points. If no curve can be fit, the line is segmented, in recursive fashion, until a curve can be fit. The method is good at locating corners in a line, and gives a good fit, with a small number of segments, to almost any data.
Figure 6 is a composite of 100 laser traces covering the Barbie doll, after curve fitting. Near the lower right corner we see two lines where the black cloth on the tabletop failed to completely suppress the background. The short horizontal line in the lower right corner is due to errors in the TV input hardware. A few of the shorter line segments, notably around the wrists and ankles, have been lost, because the point linking routine did not find enough points to consider significant.
Calibration and Depth Determination
To convert two-dimensional points, lines, or curves in the TV image to three-dimensional coordinates requires knowing the physical position of the laser with respect to the TV camera. Calibration -is accomplished in two phases: camera calibration and laser calibration.
camera calibration involves establishing a correspondence between points on the tabletop and points in the TV image. The procedure we use follows the ess,ntial details of the method described by Sobel · Laser lines are projected on the tabletop, and their positions are manually measured with respect to a coordinate system relative to the tabletop. A relaxation method obtains values for the parameters of camera position, orientation, and magnification which predict most accurately the position of the laser traces in their TV images.
Laser calibration is based on minimization of "matching errors." Where two laser traces, arising from different orientations of the cylindrical lens, cross in the image of a scene, different determinations of depth may be obtained for the two lines. The amount of mismatch in depth will be dependent on how accurately we know the position and orientation of the laser deflection assembly.
A relaxation algorithm finds the values of the laser position and orientation parameters which result in the best depth match of crossing points. The image of virtually any scene may be used, although a scene with flat-faced solids will generally introduce the least amount of noise into the data.
The laser calibration data amounts to a set of constants to be used in an algorithm for calculating the homogeneous coordinates of the laser plane of light. Once this plane is known, a system of equations may be solved to yield a collineation matrix, C, such that the physical coordinates of any point on the image of the scan line is given by:
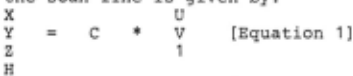
where u and v are the raster coordinates (in the TV image) of the point, and X/H, Y/H, and Z/H give its physical coordinates.
Analysis indicates that the average absolute error in position measured by our methods will not be greater than 0.050 inch. Absolute errors in position would be important only if an object were to be grasped, say, by a mechanical arm without any visual servoing. A far more important figure is relative accuracy, or resolution. For two points located near one another, the average error in the relative position of one with respect to the other will not be more than 0.010 inch.
Advantages and Disadvantages
The availability of three-dimensional information about solid objects increases the power of analysis and recognition pr~grarns immensely. For example, Shirai and Suwa have used depth inf.ormation to analyze and recognize right prisms, with some relatively unsophisticated plane-detection routines. Our experimental work on shape analysis would not be possible without depth information from which to form models.
However, the means by which we acquire this depth information is cumbersome and time-consuming. The requirement of ten minutes to scan a scene, and several more minutes for low level processing would be prohibitive in many applications. Monochromaticity of the light source imposes restrictions on the hue of objects to be scanned. And the use of lasers can create a safety hazard when used in an uncontrolled environment.
Our shape analysis programs do not depend, except in some minor ways, on the method of obtaining depth information. The use of laser triangulation may be regarded as an interim measure, until more sophisticated techniques become available. Grid coding, two camera stereo, or time-of-flight measurement of light could conceivably, with further development, provide the advantages of three dimensional imaging without the disadvantages of the present method.
Shape Analysis
A prerequisite to the recognition of curved objects is the ability to trace and recognize the primitives of which its models are composed. We have a set of programs which do essentially that. A preliminary analysis of the scene results in hypotheses being generated about possible axes for generalized cylinders. A cylinder-tracing routine explores in the suggested direction, and if it succeeds in finding a cylinder, the cylinder is extended until a gross change
in cross section diameter is sensed.
The hypothesis-testing mode of operation makes the cylinder tracing routines ideally suited for use by high level analysis routines. Based on relationships of parts to one another, and as-yet unanalyzed portions of a scene, a high level routine might postulate the existence of skeletal pieces, which the cylinder tracer would be then called upon to verify or reject. This capability is presently utilized only in a primitive fashion, but the potential exists for the more general use.
The cylinder tracer operates in an iterative fashion. Starting with some estimate of the axis and diameter of a cylinder segment, cross sections are found perpendicular to this axis. The centers of the new cross sections will, hopefully, represent an improved axis assumption. For well-defined cylinders, the method is usually convergent. If the analysis diverges, the original axis hypothesis must be rejected by the calling program.
Our routines are presently limited in that circular cross sections are the only cross sections it considers. There has also been no attempt to parametrize the space curves of the axes of generalized cylinders. A generalized cylinder is represented in the program as a sequence of points along its axis, and a linear radius function of the form:
RADIUS (n) RADIUS (0) + M * n
[Equation 2)
where RADIUS (0) and M are parameters of the function, and n corresponds to the order of points along the axis.
Preliminary Grouping
A preliminary grouping of laser traces generates hypotheses for verification by t he cylinder tracer. This grouping of scan line s i s carried out in TV coordinates, before applying the calibration data to convert to three dimensions.
The basic method of preliminary grouping i s to link together line segments from consecutive laser scans on the basis of whether or not they are roughly parallel in their TV image. A set of segments linked together is a "group." checks are made for gross changes in the lengths of segments making up the group, and groups divided at
discontinuities.
All groupings are extracted simultaneously in a single pass through the data structure. Figure 7 shows the groups extracted from the image of Figure 6. The midpoints of the segments of Figure 7 will be transformed into three dimensions and passed to the cylinder tracer as cylinder hypotheses. A rough estimate of each cross section is required for the cross section finder. This initial estimate is computed from the average length of the line segments of the group, multiplied by the sine of the angle between the line segments and the line joining their midpoints.
(The preliminary grouping is one place in our programs where we depend on the format of the input data. If another ranging apparatus were substituted, the outlines made by depth discontinuities could provide similar information.)
The Cylinder Tracer
To illustrate the operation of the cylinder tracer, we make use of the laser image of a cone. Figure 8 shows an initial hypothesis of the axis of the cone. The approximate outline of the cone is sketched for clarity.
Improving on a cylinder hypothesis may be logically broken down into six steps. The steps will be briefly listed, then eah discussed in detail later. The steps are:
- For each point on the axis, determine a cross section plane normal to the axis direction.
- For each plane determined in Step 1, call the cross section finder to locate points on the surface of the object in the vicinity of the plane.
- From the points obtained in Step 2, obtain an estimate of the diameter of the cylinder at that point. (Figure 9 shows the diameters estimated for the cone, drawn in perspective on their respective planes.
- Calculate a linear (conical) radius function for the cylinder.
- Fit circles of radii predicted by the radius function to the surface points found in Step 2 . (Figure 10 shows the new circles fit to the cone.)
- Fixups are made, if necessary.
Cross Section Planes
Planes must be established perpendicular to the axis direction, on which to describe cross sections. A quadratic smoothing function is applied locally, to five consecutive points, to estimate the tangent to the axis. The desired cross section plane passes through a point on the axis, perpendicular to the local tangent.
Locating Cross Section Points
The cross section finder locates points on the surface of an object in the vicinity of a plane passing through the object. To do this, two auxiliary planes are introduced, parallel to and on either side of the cross section plane. (The distance between the cross section plane and the auxiliary planes is controlled by the distance between consecutive points on the axis.) Now the data base is searched to find curve segments from the laser data which cross or lie between the auxiliary planes. For those curve segments, the intersection of the segment with the auxiliary planes, are calculated. These points are transformed into a two dimensional coordinate system on the cross section plane, and entered into a list of points found.
Since one plane may cut a complex object (or a group of objects) at several places, it is necessary to separate the points corresponding to the cylinder we are interested in, from those that may belong to another part of the scene. This requires an estimate of the center and the radius of the circular cross section we are to find. The transformed cross section points are linked together into groups on the basis of proximity. A threshold, GAP, determines the maximum distance between neighboring points in the same group. The mean distance of each group from the estimated center is computed. All groups having a mean distance greater than the estimated radius are then rejected.
The separation of relevant cross section points from irrelevant ones is the most error-prone portions of our method. If too large a value for GAP is specified, extra neous data points could be linked into good data; if too small a value is specified, good data might be thrown away. A default value for GAP is determined by the mean distance between consecutive laser traces in a scene, but this threshold may be modified by the cylinder tracer during fixups, as explained below.
Radius Estimation
An initial radius estimate has enabled the cross section finder to locate cross section points. These points are now used to improve on the original estimate.
The radius of a cylinder may be estimated from the extent of the surface which is visible and illuminated, and the known positions of the laser and the TV camera.
Figure 11 shows a normal cross section of a cylinder, and the projections (on the normal plane) of the lines of sight from the laser and from the TV camera. The portion of the surface from A counterclockwise to C will be illuminated (at one time or another) by the laser ~ The portion counterclockwise from B to D is visible to the TV camera. But since the portion from C to D is not illuminated at any time, only the portion from B to c will be detected.
Let the angle between the projections of the lines of sight to the TV and to the laser be called phi. The length of the line BC is given by the relationship: BC = 2 R cos (phi/ 2) [Equation 3] which may be solved for the radius, R.
We note that the accuracy of this estimate will depend on whether or not the surface is actually a circular cylinder, on the perpendicularity of the cross section plane to the actual axis, on the laser illumination being bright enough to perceive near point C in Figure 11, and, to a small degree, on the cross section being small compared to the distance to the laser and the TV camera. No attempt has been made to quantify the errors introduced, but the results given by this method seem to agree reasonably with the dimensions of actual objects.
Refitting Circles
A linear least squares fit determines the coefficients RADIUS (0) and M of Equation 2. Then for each cross section plane, circles of radius given by the radius function are fitted to the points found by the cross section finder. A steepest descent algorithm, augmented by Newton's method, finds the center coordinates which minimize the mean square distance of the surface points from the circle.
Fixups
With a well-defined cylinder or cone to trace, and in the absence of other nearby surfaces, the method of cylinder tracing usually converges rapidly. But when an error is made in fitting one cross section, the error must be detected and corrected, or subsequent applications of the cylinder tracer to the axis estimate will diverge to an incorrect or meaningless answer. Several types of error are checked, and corrected where possible.
The ends of the cylinder are checked first. The ends are suceptible to error because gross cross section changes frequently occur there. If the diameter of the end cross section does not agree (within a certain limit) with that predicted by the radius function, Equation 2, or if the axis is found to make a sharp bend at the end, the end point and cross section are deleted from the cylinder.
For all other points on the axis, the diameter of the cross section is compared with that predicted by the radius function. The angle made by that point and its two adjacent points is also checked; an error exists if this angle is less than 90 degrees. If an error is detected, a new cross section plane is specified midway between the adjacent axis points. The parameter GAP, which controls cross section separation (see "Locating Cross Section Points " above,) is either increased or decreased, depending on the relative sizes of the predicted and estimated diameters. The new cross section data replaces the old, and the radius function is recomputed.
Extending the Cylinder
Usually an initial axis estimate includes only a short section of a longer piece that may be conveniently described as a generalized cylinder. Extending the cylinder finds the longest piece that may be conveniently described, and aids in segmentation of complex objects by locating gross changes in cross section diameter of an object.
Extension is from one end at a time. From one end, the axis is extended a fixed distance, and a single new cross section added to the cylinder description . The radius is estimated from the cross section points, and a circle of diameter predicted by the radius function, Equation 2, is fitted to the cross section points. As long as the extension is compatible with the rest of the cylinder, additional extensions are made.
Incompatibility may be signalled either by a sharp bend in the axis as a result of the extension, or by disagreement between the measured and predicted radii. When disagreement is detected, the radius function is recomputed, new circles fit on every cross section plane of the axis, and the extension attempted again. If the disagreement persists, the entire cylinder estimate obtained up to this point is reprocessed by the cylinder tracer, and the extension attempted once again. If the attempt again fails, the extension is terminated.
Termination is usually because the generalized cylinder ends at that point, or because the cylinder meets or joins another portion of a complex object. On the cone of Figure 10, extension was made from the top and from the bottom. Figure 12 shows the complete analysis of the cone after extension from both ends.
Typical Operation
The usual mode of operation of the programs described here require some small amount of manual direction. In the preliminary grouping phase, all initial cylinder groupings are made in a single pass. Then the operator must specify which hypotheses are to be processed, and decide whether the analysis converged or diverged. Iteration control · in cylinder tracing and extending are entirely automatic.
The groups detected in the preliminary grouping phase are ranked according to their likelihood of representing well-defined generalized cylinders. This ranking is calculated from the number of consecutive laser scans making up the grouping, and the length-to-width ratio of the group. Thus, long, thin groups are ranked higher than short, wide groups. The operator of the program specifies the groups to be analyzed in the order of this ranking, except that a group which substantially overlaps a group already successfully analyzed will be skipped.
It is the job of the cylinder tracing subroutine to iteratively improve on cylinder assumptions passed to it. In the complete analysis of a cylinder segment, the cylinder tracer will be called at least four times, and in some cases, as many as ten times before an analysis is complete. It is on the basis of these iterations that the operator must decide success or failure of the analysis. It would be desirable to automate this decision process.
Convergence or divergence of shape analysis is usually easy for a human operator to decide. Probably, considerations as to whether or not the results agree with what is expected have some bearing on a human operator's judgment. But it has been our experience that those analyses which are judged divergent have some properties in common. In these cases, the fixups applied by the cylinder tracer to the ends of the cylinder usually delete several axis points from both ends, yielding cylinder segments shorter than what were originally postulated. The axis points of convergent analyses lie along a reasonably well-defined path, while the axis points of divergent analyses tend to be scattered. It should not be difficult to design a computer subroutine to detect divergence on this basis.
Some Results
Our routines tend to do well on objects describable as a single generalized cylinder, and on portions of complex objects which possess considerable elongation. They give marginal results in the neighborhood of joints between parts of complex objects, and where nearby parts confuse the cross section finder.
In order to represent an unbiased picture of the capabilities and limitations of our program, the results presented here were all obtained with a single version of the analysis program. Some improvement in the results might have been expected by adjusting parameters to give the best results for each particular picture; for each image shown here, we have at least once obtained a better analysis. But the results presented here were obtained in a single evening, with no adjustments between one picture and the next.
Figure 13 is the processed image of a snake made of modelling clay. From an initial axis estimate comprising perhaps the middle third of the figure, the complete analysis of Figure 14 was obtained by extension of the ends. Similar results have been obtained for other simple objects, such as rings, cones, etc.
A toy horse is depicted in Figure 15. (Because of an error in the setup of the laser, part of the head is missing from the image.) Figure 16 shows that the analysis was able to identify seven generalized cylinders, comprising the body, the neck, the tail, and the four legs. Figure 17 is a different view of the same analysis which shows the neck, body, and tail to better advantage. Both left legs are partially occluded by the shadows of the right legs. For reasons that are presently unclear, the analysis of the body failed to stop at the rear legs, but continued to the tail. The cylinder tracer usually does poorly on very thin cylinders, but in this case, all four legs were identified satisfactorily. Some indication of this difficulty may be seen in the bend of the axis of the right foreleg.
Analysis of the baby doll shown in Figure 18 resulted in the description of Figure 19. The program failed to make a segmentation between the right leg of the doll, and its body. This is probably the same sort of error as that which caused the body of the horse to extend toward the rear. The cylinder extender continued the analysis of the right leg to include the foot. Separation between the right arm and the body has been maintained, even though the parts are close enough to possibly cause confusion of the cross section finder. The head is not very
well described.
The analysis of the Barbie doll (Figure 6) is shown in Figure 20. The description of the body is poor, because of its non cylindrical shape, and because the presence of the left arm nearby confused the cross section finder. There is little separation between the legs in Figure 6, but the program found both knees where the separation is greatest. In analyzing the right calf, separation between the legs was small enough to cause the cross section finder to regard both legs together as a single cylinder. This cylinder was extended upward toward the body, overlapping the previous analyses of the knees. The short cylinder incompletely representing the left arm is evidence of difficulty with thin cylinders, mentioned above in connection with the horse.
Time and Core Requirements
The program which performs shape analysis, including preliminary grouping, cylinder tracing, cylinder extending, and iteration control, requires between 42 and 56 K (36 bit words) on the PDP-10 ·computer. This includes between 3 and 17 K of data arrays, 11 K of display buffers, and 7 K for an interactive debugging package. Simple figures such as the snake may be processed in about one minute of computer time. The horse and the two dolls each required between five
and seven minutes.
Further Research
Further research will be necessary before the techniques we have described will be able to recognize complete objects.
One of the major deficiencies of our program is the fact that the cross section finder is so easily confused by nearby points. Consideration of the outli~ objects and their parts will greatly aid in the separation of cross sections. The outlines are easily inferred from abrupt depth discontinuities in an image, corresponding to the ends o·f segments traced by the line linking routines. R. K. Nevatia and T. 0. Binford are currently persuing this approach5.
A much more difficult capability to implement is the ability to determine the relationships of parts of an object to each other. This would necessarily require analysis of surface continuity between parts, and would probably depend on global characteristics, as determined from its outline. Based on its knowledge of the world, such a routine should be able to postulate the existence of missing or hidden segments. Once the relationship of parts to the whole can be determined, recognition can be performed to distinguish among members of a known class of objects.
Research on non-circular cross sections, separation of objects from each other and from the background, and dealing with the different kinds of occlusion, are also necessary.
Acknowledgements
The authors would like to express their appreciation to Dr. A. L. Schawlow for the generous loan of a laser, to Victor Scheinman for the design and assembly of the laser deflection apparatus, to Richard Underwood for the numerical routines for use in curve fitting, and to Bruce g. Baumgart, R. K. Nevatia, and J. M. Tenenbaum for their comments and suggestions.
@inproceedings{ijcai1973p78,
  title     = {Computer Description of Curved Objects},
  author    = {Agin, Gerald J. and Binford, Thomas O.},
  booktitle = {Proceedings of the Third International Joint Conference on
               Artificial Intelligence, {IJCAI-73}},
  publisher = {International Joint Conferences on Artificial Intelligence},
  editor    = {Nils J. Nilsson},
  pages     = {629--639},
  year      = {1973},
  month     = {8},
  note      = {Perception for Robots},
  url       = {https://ijcai.org/proceedings/1973/78},
}
TY - CPAPER TI - Computer Description of Curved Objects AU - Agin, Gerald J. AU - Binford, Thomas O. T2 - Proceedings of the Third International Joint Conference on Artificial Intelligence, IJCAI-73 PB - International Joint Conferences on Artificial Intelligence PY - 1973 SP - 629 EP - 639 UR - https://ijcai.org/proceedings/1973/78 ER -Copied
Machine-readable versions of this paper, for tools and AI agents:





