
Detection of Homogeneous Regions by Structural Analysis
Proceedings of the Third International Joint Conference on Artificial Intelligence. Computer Vision. Pages 564-570.
© 1973 International Joint Conferences on Artificial Intelligence
Abstract
A method is proposed for partitioning input scenes into regions in which selected picture properties are regarded as uniform. In this procedure, usual statistical methods of inspecting average gray levels are not used , but the uniformity of complex picture properties such as shapes, sizes or arrangements of subpatterns in the pictures is examined by a structural analysis . The analyzing process is controlled by a supervisor which gives the order of changing the depth of interest in each picture property, and successive partitioning of the pictures is made toward an in t erpretable goal partition.
- Roberts, L. G. "Machine Perception of Three Dimensional Solids" Optical and Elec-
References were extracted automatically from the PDF and may contain errors.
Full text extracted automatically from the PDF; figures, tables and equations may differ. The PDF is the version of record.
DETECTION OF HOMOGENEOUS REGIONS BY STRUCTURAL ANALYSIS
Fumiaki Tomita, Masahiko Yachidat and Saburo Tsuji Department of Control Engineering, Osaka University Toyonaka, Osaka, Japan t On leave to Cordinated Science Laboratory University of Illinois, Urbana, Illinois
Abstrac t
A method is proposed for partitioning input scenes into regions in which selected picture properties are regarded as uniform. In this procedure, usual statistical methods of in specting average gray levels are not used , but the uniformity of complex picture proper ties such as shapes, sizes or arrangements of subpatterns in the pictures is examined by a structural analysis . The analyzing process is controlled by a supervisor which gives the order of changing the depth of interest in each picture property, and successive parti tioning of the pictures is made toward an in t erpretable goal partition.
Introduct ion
In recent years , many interesting papers on automat ic scene analysis systems have been published for the recognition or identifi cation of t hree dimensional objects . Most of their methods transform digitized pictures ' in t o line drawings, which are then analyzed and matched to one of models of the objects. The importance of the transformation is wide ly known , because the success of the recogni tion procedures highly depends on the correct ness of t he line drawings . Roberts is t he first man who applied a local edge operat or to find points where abrupt change in gray levels seems to occure. He then fitted straight lines to these points, and extracted the line drawings from the input pictures. 1 His technique_ has been improved to find better edge detectors and line finders.
Brice and Fenneman proposed another elegant method for t he t ransformation of gray scale pictures into line drawings by breaking the digitized pictures into a t omic regions of uni form gray scale, which are joined into regions by a pair of heuristics. 2 The procedure is successful to a class of input pictures, and each region obtained by these heuristics coin cides with that human eyes perceive as one homogeneous region. Colors in the pictures are also important for visual perception and one can utilize color information instead of brightness to find uniform color regions. 3
These approaches , however , assume that each plane of the objects and background has almost uniform brightness or color, and con siderable modification is necessary if one wishes to apply the procedures to objec t s on which some patterns or tex t ures are observed. Texture can be studied on two levels : sta tistical and s t ructural. 4 Rosenfeld showed the applicability of t he statistical methods to texture discrimina t ion, and defined the text ure edge, a generalized edge, as a series of points where abrupt change in the avera~e values of local picture properties occure. ·6 Several types of local edge detectors were proposed which compare the average gray levels in pairs of nonoverlapping neighbourhoods of various sizes.
This paper describes a generalized method for dividing the input s cene into regions, which are useful to describe the scene in a compact form. In this procedure, statist ica l inspections of the neighbourhoods of indi vidual points are not used, but a structural analysis is applied for examining the uni formities of complex picture properties such as sizes, shapes or arrangements cif sub pat t erns. The analyzing process is controll ed by a supervisor which gives the order of changing the dep t h of int erest in each pic ture property , and successive partitioning of the picture is made toward an interpretable goal partition.
Region Detection
Homo~eneous Regions
0 serving a scene in which many objects are covered by pa tterns or textures, a human being can easily recogni ze each object if it has a different pattern or texture on it f rom those of adjacent ones. In other words, hu man visual systems pay their attention to some picture properties, and find a region such that these properties of the subregions or elements in it are considered to be almost uniform. These selected picture properties and t he allowable limits of their nonuniform ities in a region are not same in all cases . Suppose a human being sees a newspaper. I f he has no interest in reading it, he may r e gard it as a sheet of paper having almost same texture. Of course he can recognize each character or discriminate difference between each atomic region of the texture, when his interest in reading is deep enough to decrease the threshold value for -discrimi nating regions.
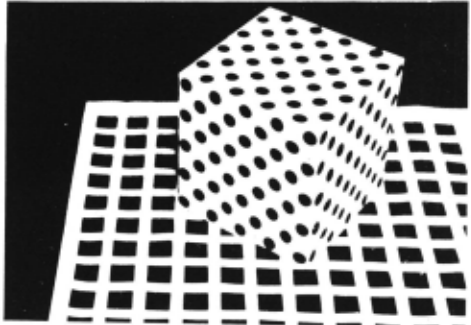
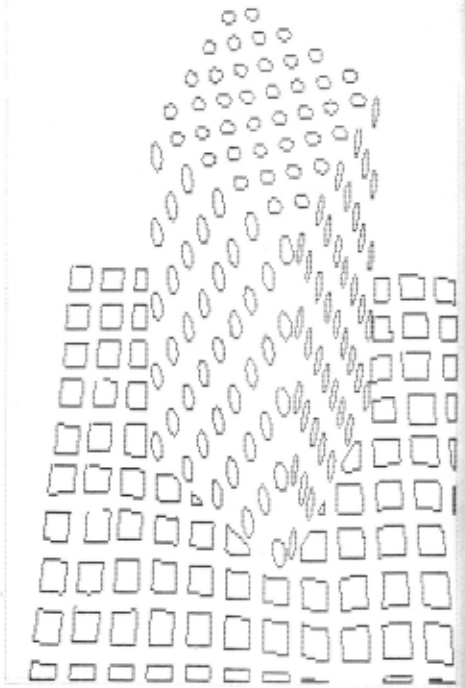
In this paper, a me t hod is proposed for finding regions in the complex scenes which contain many objects and backgrounds on which different textures or patterns are observed . A simple example is shown in Fig.l
···········
---------- Fig.l An Example of Input Pictures.
which_includes a cube and a plane covered by two different patterns. We intend to describe more complex scenes having much information in term~ of regions in which some picture pro perties are regarded as uniform. Statisti ~al methods for finding the abrupt changes In the average gray levels seem to be inade quate for our purpose, because these ap proaches are not useful to distinguish dif ferences between patterns of complex struc tures. Thus a structural analysis on homo geneities of several picture properties such ~s shap:s or sizes of atomic regions in the Input picture, as well as their relations is used to find the regions.- '
Picture Pro~erties
Beforeescibing the procedures for exam inin~ the uniformity in the region, we must clarify what picture properties are used for the analysis. In this paper, the atomic re gion is defined as a connected set of pic ture elements having almost same gray level or color. A preprocessor of the system finds these atomic regions in the digitized pic ture from a TV camera, and sends to the homo geneity analyzer the information of these atomic regions characterized by their average gray levels and colors, as well as their boundaries written in chain coding. There are many atomic ~e~ions in 'an input picture, therefore an efficient representation of their characteristics is needed in order to save memory space and computing time. Sev eral picture descriptors of the atomic re gio~ ~re selected. They are shape, size, position, color and average gray level de scriptors, although last two are not used ~n the partitioning_process. Area and per Imeter of each atomic region are specified by the size descriptor, and the position de scriptor gives the two dimensional cordinate at the center of gravity of the atomic re gion.
Because of the limitaion in the resolu tion of the TV camera, accurate shape of the atomic region is not available, and the shape descriptor must be selected in such a way that it gives coarse information of the shape and it is not sensitive to sampling noises in the process of digitizing picture. A set of ijth order moment M .. seems to sat tisfy these conditions. A cb~bination of M 20 , M 02 , M 21 , M 12 ~nd M 71 i~ adopted as the snape aescrlptor, since a series of experi ments shows that it is adequate for detect ing shape differences of small size domains.
Another type of picture properties used for the analysis is relation between two atomic region~ or regions. For simplicity, only the density descriptors are used for re presenting the relation between atomic re gions in a group. Let define the distance between two atomic regions as the distance between their centers of gravity. An atomic region A in a given set 8 has a density de scriptor D whose value is the minimum dis tance from~ A to other atomic regions in 8.
Regions
Examining the similarities of the pic ture properties by comparing the values of these descriptors, the system will classify the atomic regions into sets 8 1 , 8 2 , .·. , 8n
;-6-----,
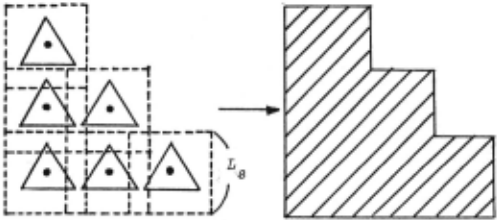
which are candidates for the regions. The re gion R covered by m elements in the set 8 is defined as follows. Let denote the maximum value of the density descriptors in 8 by L . R is a connected area covered by squares 8 whose length of edge is L and centers are located at centers of grafity of all members of 8 ( Fig.2 ) . Sometimes there are plural regions whose elements belong to one set 8.
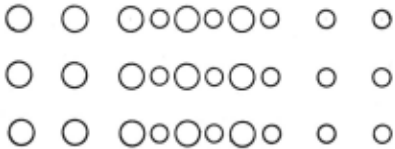
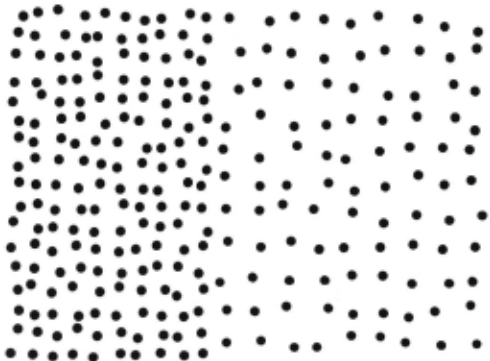
The analyzer also examines a relation be tween regions. Fig.3 shows a simple example in which there exist two classes of atomic regions. Let R and R be regions covered b~ small dots a~d larg8 dots,respectively., Since common area of R 1 (\ R of two regions has considerable size, it sgems reasonable for the analyzer to regard t~ese ar~as as three regions R 1 (I R 2 , R 1 rl '# 2 and ~ (\ R instead of two. 1 2
Therefore the system checks whether each region has any overlapped part or not, but neglect ones whose size is less than a cer tain threshold value.
Structural Analysis
Structural Analysis
Fig.4 shows an overall diagram of the scene analyzer. Output of a standard vidi con camera is transmitted to an analog to digital converter which produces one of 64x64, 128xl28 or 256x256 digitized pic tures with 64 gray levels. A preprocessor searches in the digitized picture for the atomic regions. We consider that color information is more useful to our purpose, however only gray level information is used in th: ex~eriments. In this paper, an as sumption IS made that each atomic region has a ~lear outline. Thus we put little emphasis on the process of finding the atomic r---------------------, regions, and usual procedures are used for de tecting the contours of the connected areas in which gray level of each point is lower tlian the threhold value decided by the gray level histogram. 7 Fig.S shows the result for the input scene of Fig.l which is digitized in a 256 x256 array.
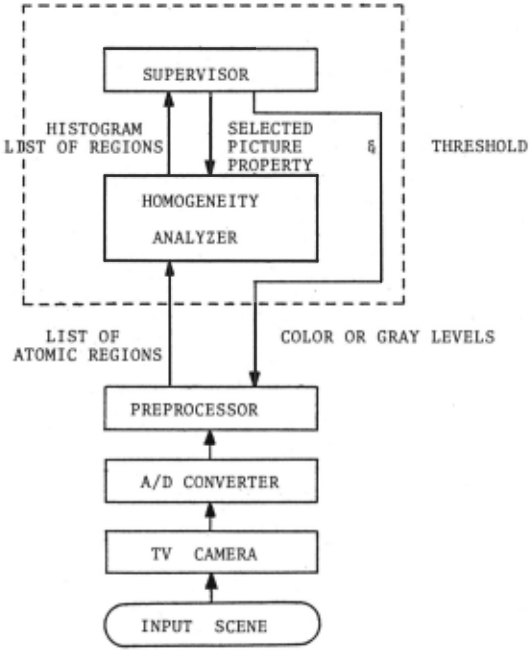
A list of these atomic regions with their boundaries described in chain coding is sent to the homogeneity analyzer. The analyzer divides the same input scene in different ways depending on the depth of interest in particular picture property. Since we intend to apply the descriptions of the scene in terms of regions to automatic recognition or identification of objects, successive parti tion must be made in heuristic ways to find an interpretable goal partition whose struc ture matches one of combined models of the objects. Therefore the system is provided for a supervisor which receive the informa tion from the analyzer, and then plans the se quence of partitioning which is sent back to the analyzer.
Homofeneit~ Test
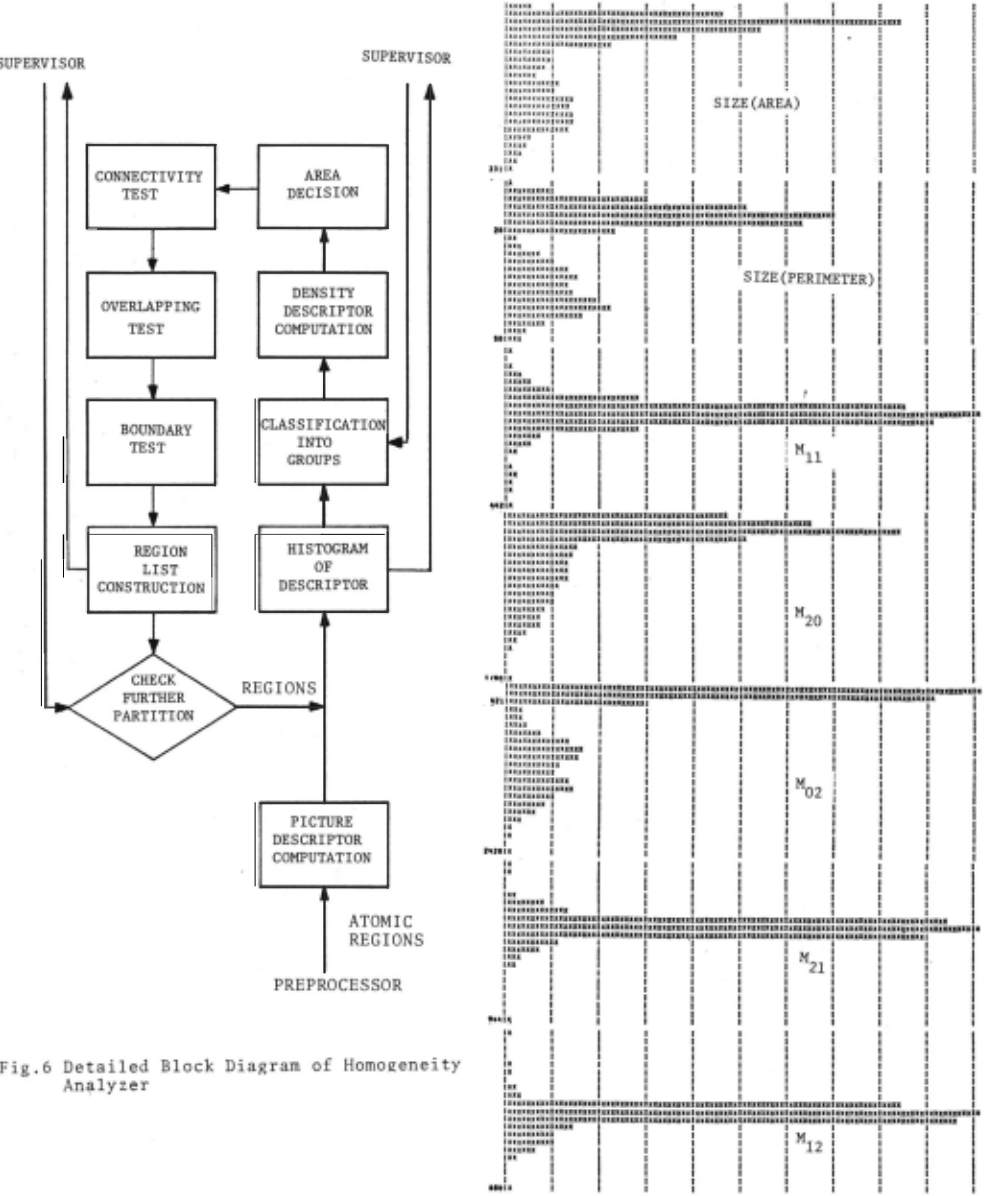
deta1led block diagram of the homoge enity analyzer is shown in Fig.6. First of all, the picture descriptors are evaluated and their list is constructed. Secondly, histograms of values of the descriptors are computed and small fluctuations in them are suppressed by a filter which smoothes the small peaks standing close to each other. These frequency distributions are examined by the supervisor to select the most pro mising descriptor for classifying the atomic regions into groups. We consider that a de scriptor is promising to initial partition ing if the atomic regions are definitely classified into a few groups by it. Choos ing the descriptors whose histograms have deep valleys between prominent peaks, the supervisor sets thresholds at the bottoms of the valleys. Since validity of classifying the members in the valleys by thresholding is ambiguous, the descriptor having the minimum number of such members is selected by the supervisor. Fig.7 shows the histo grams of the descriptors of the input scene of Fig.l, and the perimeter term of the size descriptor is selected for the first stage partitioning.
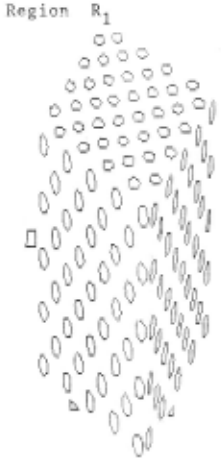
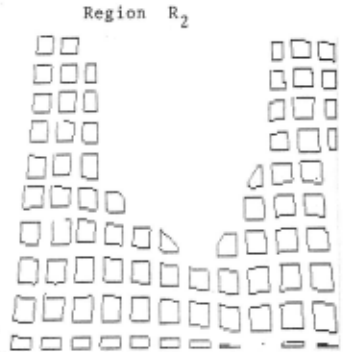
Next the density descriptors of members in each group are evaluated. If some mem bers have the density descriptors whose val ues are larger than a predetermined thresh old value, they are regarded as isolated atomic regions and are excluded from the groups. Thus the first stage partitioning has groups s 1 , s 2 , ·. · , s as candidates for regions. As mentione~ in the previous section, the areas covered by these groups are decided, and then their connectivity and overlapping are examined to decide regions. If a connected area of region candi dates has less than f i ve members, the ana lyzer does not regard it as a region and re gisters its members in a group of isolated atomic regions. Next, a boundary test is done to check whether any atomic regions in the group of isolated elements are located between two regions or surrounded by a re gion. They are joined to the region i f only one region touches them. However they are left in the isolated member's group i f two regions touch them, because we cannot find any simple methods for finding which region is more adequate for merging them. Fig.8 shows the results for cassifying into regions by the size descriptors . . There gions R and R correspond to the cube and the pla~e, respective l y. Small size atomic regions at the boundary of the picture are not classified into region candidates of R 2 , but the boundary test joins them to R .
The regions described by their botlndaries and elements are sent to the supervisor which fitts straight lines to the boundaries to get a line drawing. If any part of the line drawing does not match the structure of the models, the supervisor considers the result of the partition is not successful and fur ther partitioning is done. There are three methods to change the partition: 1) deeper partitioning, 2) modified partitioning after changing threshold values, 3) new partition ing by another descriptor. In our experi ments only deeper partioning is programmed, then the iterative partitionings are termi nated when any matched part of the regions to the model structures is found or no fur ther partitioning is possible. Satisfactory results are obtained for simple input scenes, however other type modifications are necessa ry for complex inputs.
Regions R 1 , R 2 , ··· found by the first stage partitioning are processed independent ly to obtain deeper partition R 11 , R 1 2 , ·.· , R~ 1 , R 22 , ···· The procedures are same as tnose Of the first stage. Fig.9 shows the
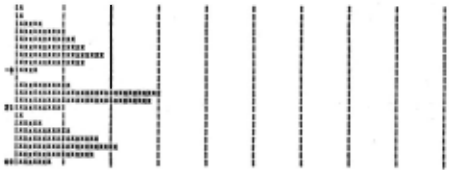
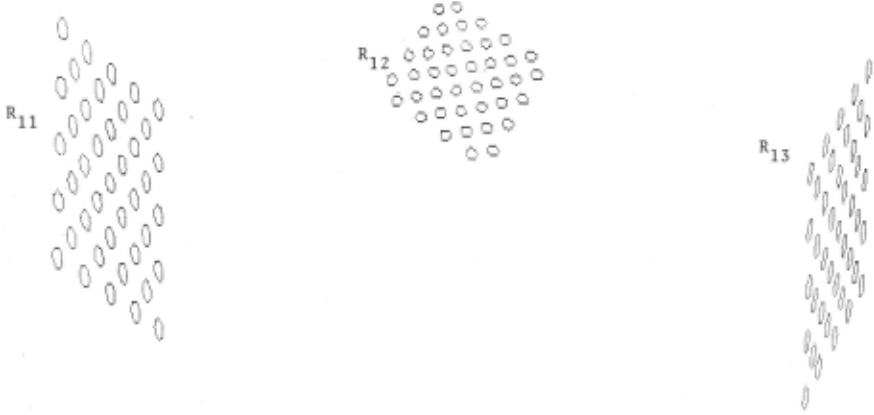
histogram of M 11 in R 1 (cube) in which three groups are observed. It must be noted that M 11 of Fig.? has not any deep valley. That is, the successive procedures can detect finer difference between members having a almost same feature, if the previous parti tion is adequate. The results of partition ing R 1 into three regions R 11 , R 12 , R 13 which correspond to three planes of the cube, are shown in Fig. 10. Two small triangles and a square at the boundary of R in Fig.8 are classified into the isolated ~ember's group and eliminated from the regions. The histograms of descriptors in R 2 have no deep valleys., and further partitioning is not R and R have same picture properties , but at~ sepat~ted by the connectivity test. (Fig. 13)
R 2 is divided into R 27 , R 22 by examin ing M 12 , and then the density descriptors are checked for further partition. There are four regions R 211 R 221 , R 212 ~n~ ~ 222 , however the overl appl~g test J01ns tWO re gions R 2 J 2 and R 222 and.obtain~ a regi~n R 23 .
Anotner example of 1nput p1ctures 1s shown in Fig.l5. The atomic regions in this example are randomly arranged. Some of the histograms of the picture descrip tors are shown in Fig.l6. Testing these data the supervisor finds that the density de~crip tors are applicable to partitioning.
possible .
The scene analyzer is programmed i n FORTRAN, and total cpu time of a medium size computer HITAC8350 (196kbytes 1.8 ~sec me mory) for the analysis of Fig.l is 5 minutes 25 seconds.
Experimental Results
Exper1ments for several input pictures are done to check the validity of the method. Fig.ll shows an example in which six regions exist. The system classifies it into two re gions R 1 and R 2 by the size descriptors. The results are illustrated in Fig.l2. R 1 is further divided into three regions R 11 , R 12 and R 13 by the density descriptors.
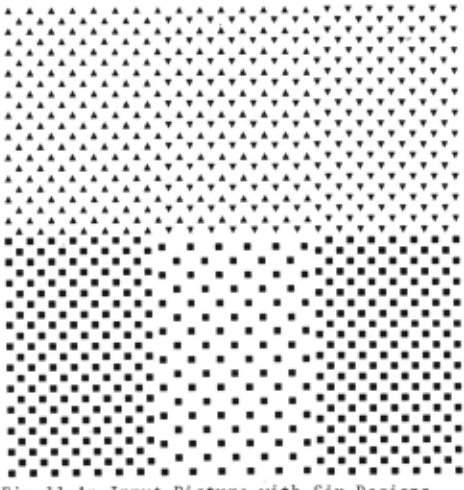
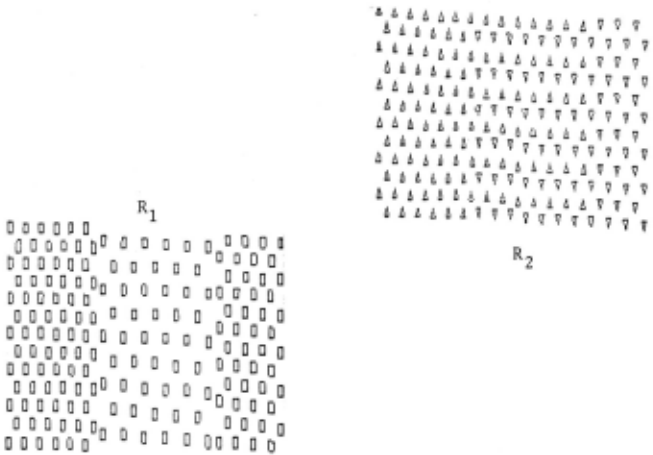
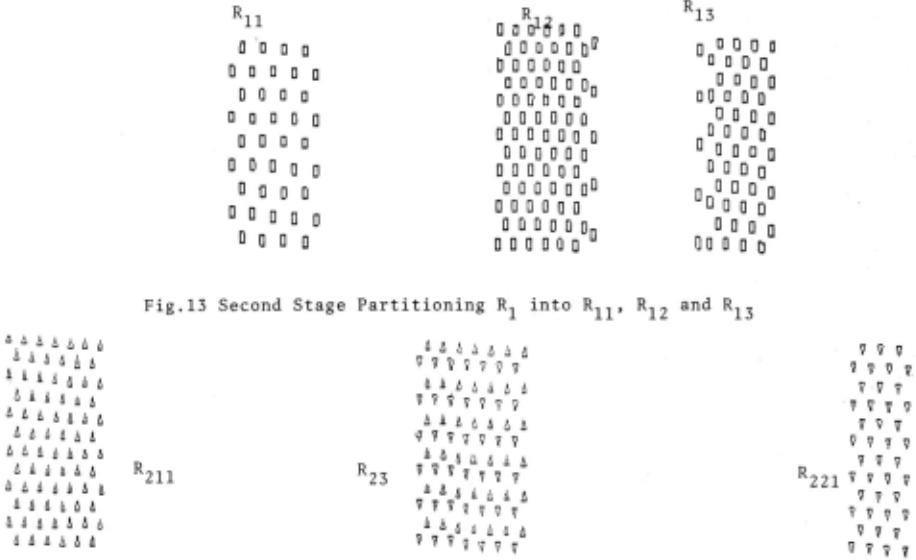
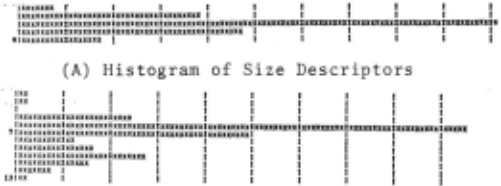
Fig.l6 Some of Histograms of the Picture De scriptors of Atomic Regions in Fig.lS
Fig.l7 shows the results of classifying the atomic regions into two sets S and S in which several isolated region tandidates exist. Examining the boundary test, the system merges them into regions, and obtains two regions R 1 and R 2 shown in Fig.l7.
Discussion
In this paper a method is proposed for detecting the regions in which some picture properties are al~ost uniform. We use a structural analysis on the picture proper ties instead of usual stochastic methods, and we find it is useful when the structure of patterns or textures in the picture are complex. However, an assumption that dis crimination of the elementary subpatterns or grains in the oicture is easy, is nece ssary. Applicability of the simple thresh olding based on the histogram of brightness is shown if the boundaries of elementary grains have sharp edges. The heuristics by Brice et al. would give better results when average gray levels in atomic regions distri bute in wide range, and this average gray level information might be used in the par titioning process. 2 Color information sePms to be more useful than gray level informa tion.
The method proposed in this paper would be applicable to detecting iterative struc tures of artificially constructed objects or recognizjng objects covered by almost re gular subpatterns. Computing time of the partitioning is rather long because any at tempt is mad~ to save it, and we consider some programming effort could decrease it considerably.
Since the job of the supervisor is simple one which iterates partitioning unitil it finds matched structure of regions to the models, future study is necessary to make the sup~rvisor powerful, especially to find better heuristics to modify the depth of interest in particular picture property.
Acknowledgement
The authors wish to express their hearty thanks to members of Bionics Research Section of Electrotechnical Laboratory for their kind support.
@inproceedings{ijcai1973p70,
  title     = {Detection of Homogeneous Regions by Structural Analysis},
  author    = {Tomita, Fumiaki and Yachida, Masahiko and Tsuji, Saburo},
  booktitle = {Proceedings of the Third International Joint Conference on
               Artificial Intelligence, {IJCAI-73}},
  publisher = {International Joint Conferences on Artificial Intelligence},
  editor    = {Nils J. Nilsson},
  pages     = {564--570},
  year      = {1973},
  month     = {8},
  note      = {Computer Vision},
  url       = {https://ijcai.org/proceedings/1973/70},
}
TY - CPAPER TI - Detection of Homogeneous Regions by Structural Analysis AU - Tomita, Fumiaki AU - Yachida, Masahiko AU - Tsuji, Saburo T2 - Proceedings of the Third International Joint Conference on Artificial Intelligence, IJCAI-73 PB - International Joint Conferences on Artificial Intelligence PY - 1973 SP - 564 EP - 570 UR - https://ijcai.org/proceedings/1973/70 ER -Copied
Machine-readable versions of this paper, for tools and AI agents:
 Welcome
 Future Conferences
 AI Journal Division
 IJCAI Proceedings
 About IJCAI
 IJCAI Awards