
Computer Description of Textured Surfaces
Proceedings of the Third International Joint Conference on Artificial Intelligence. Computer Vision. Pages 572-578.
© 1973 International Joint Conferences on Artificial Intelligence
Abstract
This work deals with computer analysis of textured surfaces. Descriptions of textures are formalized from natural language descriptions. Local texture descriptions are obtained from the directional and non-directional com ponents of the Fourier transform power spectrum. Ana lytic expressions are derived for orientation, contrast, size, spacing, and in periodic cases, the locations of texture elements. The local descriptions are defined over windows of varying sizes.
- Bajcsy, R., "Computer Identification of Textured Visual Scene," AIM-173, Artificial Intelligence Project, Stanford University, Stanford, Calif- ornia, 1972.
- Beck, J., "Perceptual Grouping Produced by Line- figures," Perception and Psychophysics 2, 1967, 491-495.
- Binford, T., "A Visual Processor," Internal Re- port, Cambridge, Mass., MAC, MIT, 1970.
- Brice, C. R. and Pennema, C. L., "Scene Analysis Using Regions," Artificial Intelligence, 1, (1970), No. 3.
- Hawkins, . J. K., "Textural Properties for Pattern Recognition" in B. S. Lipkin (Ed.) Picture Processing and Psychopictorics, New York: Acad. Press, 1970.
- Hueckel, M. H., "An Operator Which Locates Edges in Digitized Pictures," Journal of ACM, 18, (1971), 113-125.
- Julesz, B. "Visual Pattern Discrimination," IRE TRANS. IT-8, (Feb., 1962), 84-92. -
- Rosenfeld, A. and Thurston, M., "Edge and Curve Detection for Visual Scene Analysis," IEEE Trans. on Computers, C-20 (1971), No. s:-- 9.
- Rosenfeld, A., "Automatic Recognition of Basic Terrain Types from Aerial Photographs , " Photogram. Eng. 28, (March, 1962), 639-646.
- Rosenfeld, A., "Picture Processing by Computer," Computing Surveys, Vol. 1, No. 3, (September, 1969).
- Rosenfeld, A. , "Progress in Picture Processing: 1969-1971," Technical Report TR-176, University of Maryland, (January, 1972).
- Rosenfeld, A. , "Picture Processing: 1972," Tech- nical Report TR-217, University of Maryland, (January, 1973).
- Lendaris, G. and Stanley, G., "Diffraction-Pattern Sampling for Automatic Pattern Recognition," Proceedings of the IEEE, Vol. 58, No. 2, (Feb- ruary, 1970). FIGURE 1 •I: I• FI GURE 2
References were extracted automatically from the PDF and may contain errors.
Full text extracted automatically from the PDF; figures, tables and equations may differ. The PDF is the version of record.
Introduction
My purpose is to present a new technique for com puter description of textured surfaces. Although I use outdoor scenes, involving grass, water, forest, and the like as a starting point of intuition, tex tured surfaces generally appear in almost every sort of scene and, therefore, I will also show some ex amples of isolated and artificial textures.
This study is motivated by a wide range of prac tical applications. The agricultural survey and ana lysis of earth resources by means of satellite pic tures is one such example. The social benefits of computer-controlled cars using computer vision, as described by John McCarthy , is another. Industrial robots will soon acquire vision, too. Texture syn thesis, to ·which I feel our techniques are also ap plicable, is useful in computer-aided design and com puter-aided art. Interpretation of scanning electron microscope pictures, e.g., for metallurgy, may also be
of interest.
· A primary problem in texture is how we perceive a textured surface as a uniform structure in a non trivial way . Intuitively speaking, there are many levels on which one can perceive texture. In one sit uation we may look at the pattern created on a wall and call that a "texture." In another situation we may have a closer look at the same wall from the same distance, but in this case see texture of the indi vidual bricks and ignore the texture given by the overall architectural structure of the bricks. We want to characterize textures in terms of a compact symbolic representation.
We follow a structural description of textured regions in terms of texture elements and their spatial relationships. In turn, textured regions can also be texture elements in a larger structure, etc.
Texture elements cannot be determined in iso lation. They are recognized through their similarity relationships, although the measure of a similarity may vary considerably. For example, in a texture of pebbles the size similarity may be important even though the sizes vary significantly. Still, there is uniformity within a factor of 10 or so. Similarities of other properties such as contrast, shape and spa tial distributions may also be only approximate.
Ruzena Bajcsy
University of Pennsylvania Philadelphia, Pennsylvania
Texture Descriptions
The problem of texture r:cognition ha~ §eiB r£ti~ already in early computer vis~on research. ' ' ' '
The best review paper about the current stat~ of texture extraction technology is that of Hawkins. Ac cording to him, there are four types of approaches that have been taken toward texture classification : (1) spatial frequency content; (2) gray level content; (3) local shape content ; and (4) higher order measures. Al l of these approaches are pattern classification techniques. These techniques are not satisfactory for a description of real textures for the following rea sons:
(1) pattern classification techniques have concentrated on linear decision procedures and domain independent formulations. In this method the principle of contin uity based on local similarity relationships of some features is missing; however, in real scenes this fac t is very important. Take, as an example, a grassy field. Usually, grass appears as a lineary horizontal texture, e.g., horizontal ·parallel lines. However, when the wind blows, some of the grass stalks change direction away from the horizontal lines. Although this change of directionality is continuous and thus detectable, pattern recognition methods would miss it. (2) in pattern recognition approaches, context appears as a set of numerical coefficients in a linear func tion and in the choice of features. Better models ex ist, in terms of context dependent decision trees, which provide a flexible description of the object in the scene. The description is not a simple name of a class to which the object belongs, but rather a des cription of the object's parts, attributes, and rela tionships.
In fact, structural description of a texture is the main theme in our work. In other words, our work involves the description of texture elements (their shape, size, orientation, etc.) and relational fea tures (spatial organization , texture gradient, and the like).
In practical implementations we can describe only simple relationships in spatial organization among the elements, e.g., linear, bilinear, periodic, regular but aperiodic, symmetric. Likewise, shape descriptors of the elements must be relatively simple (straight lines, dots, blob-like). One may question the effec ~iveness of simple relationships and their descriptors; ~t is reasonable to think that a more complex des cription of texture elements and their relationships is necessary for adequate description 2f textures. However, the psychological experiments indicate that human differentiation of textures depends heavily on a few simple descriptors, such as contrast and dir ec tion ality, and ignores even curvature in making texture groupings. Although we cannot estimate the computa tional complexity of descriptors, we have an intuitive feeling that in terms of time or in terms of complex ity of wiring for parallel systems, simple descriptors, such as directionality, are clearly preferred.
Procedures for Texture Descriptors
Basically, there are two domains from which one can derive texture descriptors: the spatial and the Fourier domain. Yet, some features are more visible in one domain than in the other. For example, the lo~ cal properties, such as the shape of a texture element, are grumbled in the Fourier domain while they are pre served in the spatial domain; a similar situation ex ists in the spatial shift among elements. On the other hand, the global organization of texture elements is expressed more succinctly in the Fourier domain than in the spatial domain , We shall describe below the procedures of feature extraction in each respective domain.
Texture descriptors derived in the spatial domain
Since descriptors refer to properties of objects (texture elements) represented in the image space, it is natural to look for operators acting directly in the spatial domain. Several low level operators have to be combined into a procedure to obtain the desired texture description. A skeleton of such a process u sually consists of: procedures isolating the image elements, geometric description of image elements, and clustering of element~ based on proximity and their spatial organization. A set of simple descriptors has been ~uggested and implemented by Rosenfeld and Thurston. They use, in parallel, several local aver aging operators applied in different directions and on various sizes of windows. Though this method finds some texture boundaries, the operators are too trivial for handling a wide class of real textures. Besides, they do not provide any description of a texture, ra ther they only detect the texture differences.
In the process of isolating the image elements the most important features are the following topolo gical properties: connectivity, continuity, and prox imity. These properties, applied to b4ightness or color, are used in all region finders. Here, the al gorithm is based on grouping all adjacent points with similar brightness and/or color. Discontinuity is th~ ~ basic property to be used in edge and line operators.~ Current edge and line operators are designed for de tecting discontinuities between two large homogeneous regions and they do not operate satisfactorily on small regions. The textured elements that one finds in outdoor scenes are too small in size and too large in number to be processed usefully by any of the above operators.
After completing the isolating of image elements - figures, we shall describe them. We select those descriptors which enable clustering, i.e. based on proximity, those which will find the nearby elements. In passing, I want to emphasize that color and bright ness are among the most important descriptors in nat ural scenes. Image elements cannot be taken separ ately from their background. In fact, the common background of the elements is a strong clue for their clustering. The relationship between the background and color is expressed in terms of contrast·,. and, therefore, it can be used as another descriptor.
Since the shape of a two or three-dimensional ob ject in a general situation could be extremely compli cated, we cannot hope and, in fact, we do not ~~nt to describe it in detail. Instead, complex shapes are decomposed into simpler ones which are hopefully eas ier to describe; the size of the texture elements must also be simplified to correspond with the shapes. A typical example is a tree which may be decomposed into its trunk and crown, the trunk being geometrically lin ear, the crown being blob-like. In shape analysis of outdoor scenes; we find directionality among the most useful features.
Finally, we describe the spatial organization of texture elements. This amounts to the description of a new structure formed by the texture elements. Here, the main problem is to recognize the whole as composed of texture elements. For example, the dots could form a straight line or a random dot pattern; straight lines with the same direction form parallel lines, etc .
Limitations of Spatial Doma2E_Procedures Despite the importance of descriptors derived in the spatial domain, we shall not use them in this work for the fol lowing reason. Currently available edge finders and region finders are tailored for large homogeneous re gions. In natural scenes, textured areas are composed of small texture elements. Even to the extent that the boundaries of small regions are determined, the data structures require unreasonably large memory, since the boundary descriptions are no longer economical. The next steps - description of elements and clustering el ements of similar direction, size, color, or brightness - seem prohibitively time consuming and difficult for grass, pebbles, sand, etc.
Texture descriptors derived i n the Fourier domain
Why do we suggest to use the Fourier domain rather than the spatial domain? An effective texture operator must have certain virtues. It should describe the spa tial distribution of texture elements, and it should characterize the shape and the size of the texture elements.
From the elementary properties of the Fourier op erator, it follows that any real periodic function has a symmetric Fourier image with respect to the origin. An equally well-known but somewhat more interesting fact is that the power spectrum is invariant with re spect to translation in the spatial domain, but not with respect to rotation. A trivial consiquence of this property is that the directionality of a pattern in the picture is preserved in the power spectrum, but the phase of the transform is not.
If a function is periodic, partially periodic, of almost periodic, then its Fourier transform provides a more concise representation of the image, and the re lational feature derived from the Fourier image forms a good description of periodic or almost periodic pat perns. For example, take an image of a texture com posed of several parallel lines. Its power spectrum will have only one line. In addition, the power spec trum will contain the information about the width of the line and the number of lines occurring in the image.
The fact that directio.nality is preserved in the power spectr~m allows us to infer some gross shape properties. ~e are able to distinguish directional and non-directio"!a1. coMponents o"' texture. For this reason, it is useful to transform the power spectrum from a cartesian coordinate system <r,~>. Then in each direction , one can regard P(r,~) as a one-dimensional function P~(r). Similarly, for each frequency r, P (~ is a one-dlmensional funct-ion. In addition, if we in tegrate along direction~· we obtain
and similarly, integration W/2 along radius produces
where W is the window size.
Thus, the description of the texture depends in this method on the form of the pair of functions <P(r), P((l)) >.
The taxonomy of textures that we can describe by using the properties of functions P(r), P(~) is dis played in Flowchar t l .
Examples of Texture Descriptions Using Fourier Techniques
An example of a monodirectional texture is the texture of wood, shown in Fig. 1. In this figure, the upper left picture shows the original texture divided into four windows to show more than one sample of the same texture. The picture in the upper right corner is the resynthesized texture, produced according to the description. As one can see from these pictures, the description is monodirectional texture and, there fore, in the resynthesized version, the non-direction al components are filtered out. The picture in the lower left corner shows the power spectrum of the ori ginal texture.
An example of bidirectional texture is a piece of canvas displayed in Fig. 2. In this figure, just like in the previous one, the upper left picture shows the original texture divided into four windows. The pic ture in the upper right corner is the power spectrum of the original texture. The pictures in the lower part of the figure are separated and resynthesized to two monodirectionat textures, produced according to their description. An example of a noisy (pepper and salt) and blob-like texture are shown in Figures 3 (the sand) and 4 (the blob), respectively.
Now we shall study a further possible interpre tation of function P(r). Consider a monodirectional pattern that appears as a one-dimensional (in the par ticular direction) square wave function F(x). Denote the replicative symbol by w(x) and the wave form by f(x). We can represent a periodic texture F(x) as a convolution of basic waveform f(x) and a periodic func tion w (x).
Thus, F(x) = f(x) * w(x).
The Fourier transform of F(x) is
Applying the window function of the width w, the oper ation appears as a convolution in the Fourier domain.
w w
It is clear that we can measure "V· I in the power spectrum from the function P(r), for every direction ality and window size w. Consequently, we can esti mate (how well, depends on the brightness function) the wavelength l, as before and, in addition, the size of the smallest element, v. The quantities v and l will be parameters associated with each description.
Examples of functions P(~) and P(r) of texture samples will be presented next. The size of samples is 32 x 32 points. The points on the y-axis have the corresponding values of the functions P(~) and P(r), respectively. The points (on the x-axis) in the~ graph for function P(~) represent the value (x-1) 16 (for x = 1, 2, ... , 16). The points (on the xaiis) in the graph for function P(r) have just the ac tual values of frequency f · · 1, ·.· , 16.
Each pair of functions <P(~),P(r)> will be des cribed by some parameters, listed in a table. Below is the list of the parameters and their description.
NAME; The natural language names of the texture sam ples.
DESCRIPTOR: A hypothetical description of the sample according some criteria (thresholds) applied on functions <P(~, P(r)>.
MAX P (~) : The maximal value of P ( ~).
<lfuax: Is such ~that P(<!Jnax) = max P(~).
WIDTH: The distance between ~l' q> 2 , where ~l «~>max
< ~ 2 and P(~ 1 ) = MIN P(cp), the left side with re spect to P(cpmax).
P(~ 2 ) = MIN P(~) (the right side with respect to P(<llnax) ·
- DIR: If the descriptor is a directional, first perform a fan filtering in such a way that the fan filter is centered in cp and then find MAX P(n,m~ z P(n , m ) an~thus compute DIR = arctg max max max -n--- If the descriptor is non-directional then juitx
find
MAX P(n,m) = P(nmax' mmax) and compute ·DIR as above.
RO: Is the wavelength computed from the maximal point energy? RO = window size/ n2 + m2 max max
M is the mean value of function P(~).
v
is the variance of P(~).
MAX P(r): is the maximal value of P(r).
rmax is such r that P(rmax) =MAX P(r).
WIDTH r: is the distance between the center of P(r) and the threshold value of the envelope of P(r).
is the mean value of P(r). M: r
vr: is the variance of P(r).
v: is the element size equal to window size/width r
of the envelope.
l: is the spacing between elements, equal to window size/frequency of the first peak.
In the case of bidirectional texture, a pair of values is listed for the following parameters: MAX P(cp), cpmax' width~, DIR and RO.
The texture names are on the top of each picture displaying the corresponding function P(cp) and P(r). The actual samples of texture - wood, canvas, circle, and sand - are in Figures 1, 2, 3, and 4.
In Fig. 5 we display a sample of grass. The upper left window in Fig. 5 is the original sample; the upper right window is its corresponding power spectrum; the lower left window is the power spectrum after a high pass filter; and the lower right window is the resyn thesized original picture after the high pass filter.
This example is presented to demonstrate the ne cessity for separating the slow changes from the real texture pattern. The rationale for this is that most of the objects (texture elements) tend to have the same reflectively and the lighting varies smoothly. Thus shading in the Fourier domain generates a low frequency component.
Functions P(cp) and P(r) of textures grass, wood, and canvas are displayed in Figs. 6a, 7, and Sa, re spectively. To consider the main directionality and, thus, to be able to determine l and v, we display the filtered alternative in Fig. 6b for grass, Fig. 8b and 8c for canvas (for one directionality). The table of
their corresponding parameters is Table 1.
Comments: First of all, notice that grass is described as bidirectional, contrary to what would be expected. The reason is that even after high pass filtering, there is still significant slow change left, (wave length = 16) which forms the second peak. One needs to know more about the scene (its illumination, continui ty, context) in order to remove this kind of slow change·. It is impossible without further knowledge a-
DENOTE N THE NUMBER OF DISTINGUISHED PEAKS OF FUNCTION P(<j>)
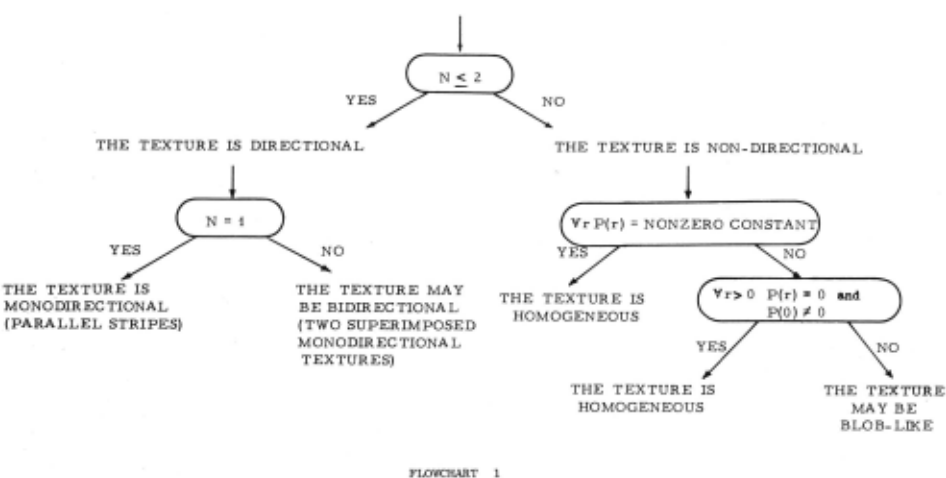
TABLE 1
| NAME DESCRIPTOR | GRASS BIDIRECTIONAL | WOOD MONODIRECTIONAL | CANVAS BIDIRECTIONAL |
|---|---|---|---|
| MAX P(q>) | <8.35, 7.5> | 64 | <108, 80> |
| 'Pmax | <5, 13> | 14 | <1, 9> |
| WIDTH II' | <6, 4> | 5 | <4, 2> |
| DIR | <0.463, 2.03> | 2.55 | <1.57. 0> |
| RO | <14.31, 16> | 8.87 | <16, 8> |
| M cp | 4.76 | 32.84 | 49.3 |
| v II' | 0.534 | 3.76 | 5.46 |
| MAX P(r) | 5.62 | 44.8 | 120.34 |
| v | 4 | 3 | 4 |
| WIDTH r | 16 | 16 | 9 |
| M r | 4.52 | 31.46 | 47.14 |
| v r | 0.324 | 2.54 | 7.64 |
| l | <8, 16> | 10 | <16, 8> |
| l max | 8 | 8 | |
| V for MAX DIR | 1 | 1 | 1.8 |
bout the area to handle this situation appropriately, because the same component (wavelength= 16), which in the case of grass is undesirable, is in the case of the canvas texture an essential part of its descrip tion.
Function P·(r) in the cases cif grass and wood shows similarities, which suggests that both of these textures have some noisy irregular backgrounds. On the other hand the canvas texture displays significant peaks in low frequency and decreasing power in higher frequencies.
For more detailed analysis of P(r), one has to separate the djfferent directionalities. This is what we have followed up in Figures 6b, 8b and 8c.
The last two examples of texture of blobs and sand demonstrate the differences between nondirection a! textures. In Fig. 9 and 10 are functions P(~) and P(r) of samples of texture recorded in Fig. 4 and Fig. 3, respectively. Table 2 contains their corresponding parameters.
The P(~) is a flat function in both textures as is expected. P(r) in the case of blobs has one signi ficant peak; whereas, in the case of sand, P(r) is ap proximately flat.
| NAME DESCRIPTOR | TABLE 2 BLOBS BLOB-LIKE | SAND NOISY |
|---|---|---|
| MAX p (cp) | 82.26 | 73.74 |
| cpmax | 13 | 13 |
| WIDTH~ | 3 | 3 |
| DIR | 2.35 | 2.35 |
| RO | 11.31 | 5 |
| ~ | 60.2 | 52.8 |
| vcp | 2. 72 | 2.48 |
| MAX p (r) | 120.46 | 75.8 |
| v max | 3 | 6 |
| WIDTH r | 6 | 12 |
| Mr | 61.70 | 54.4 |
| Vr | 6.52 | 3.18 |
| cp | 10 | 5 |
| v | 2.6 | 1.3 |
We must make some comments about the differences between continuous and finite discrete Fourier trans forms. The continuous Fourier transform exists for every function with finite energy, while the finite discrete Fourier transform exists for any function. Our interpretations will be based on the continuous transform and the actual computations on the discrete transform (fast Fourier transform). The discrete transform is really a Fourier series. A continuous Fourier transform is rotationally invariant (except for windowing effects), while a descrete transform has distinguished axes along the coordinate axis and the diagonals. Thus, a directional image has a continuous Fourier transform in a very narrow band transform only for directions along the preferred axis. There is a corresponding difficulty in defining fan filters which we have not succeeded in solving.
One should make a note of a fairly important though elementary mathematical fact: namely, that the Fourier transform does not preserve functional re striction. More specifically, if g(x,y)/W denotes the restriciton of the image function g(x,y) to a window W (so that g(x,y) is truncated outside W), then
F[g(x,y)[Wl = F[g(x,y)J[w is true for every W only when g(x,y) is periodic with period equal to the size of W. Thus a Fourier image of a truncated function, truncated outside a window, will in general depend also on the part of the function g(x,y) whose domain is outside W. What this means practically is that certain texture elements could be ,split in half by windowing, and, as a consequence, an improper interpretation would be derived. This problem can be partly compensated for by overlapping windowing.
Conclusion
In this paper we have presented procedures for de scribing textured surfaces by operating in the Fourier domain of the image. Although the directionalf§Y in the Fourier domain has already been recognized , it has not been used in texture descriptions. The novelty of this method is that it recognizes some gross shape features (monodirectional, bidirectional, nondirec tional, etc.) of textures in the Fourier domain. In addition to the frequency properties, we are also able to make some estimates about the size of texture ele ments. The descriptions are symbolic. They are asso ciated with a list of parameters (with corresponding numerical values.) that are used at a higher level in the hypothesis-verification process. The data struc ture of texture descriptors is flexible and is expected to change during the hypothesis-verification activity. We are aware of several weaknesses inherent in this method. For instance, human perception tends to dis count smooth changes in shading; yet the Fourier trans form reflects not only the edges but also the slow changes. We are accustomed to regarding images in terms of homogeneous regions with sharp boundaries and to describing elements by brightness and color contrast and outline shape. In the Fourier domain, these become jumbled in a way that is only approximately resolved by our heuristics; thus, they are not always usefully described.
In addition, the texture elements (their shape) and their organization are also jumbled together in the Fourier domain. For instance, dots and small segments of lines organized in parallel-lined fashion will be described equally as monodirectional texture and, therefore, not in full detail. For more detail, one has to apply the spatial, local operators.
To sum it up, there are several possible texture operators, such as statistical and Fourier operators, interval analysis, and others. Some operators are bet ter than others. Thus, the Fourier operators are very efficient for linear perodic textures as well as for linear regular but not periodic textures. Take grassy fields, waves in the water, etc. They are also useful for random dot patterns as long as the question is only the recognition of random organization vers.us regular organization (Example the sand texture). However, Fourier operator will fail to recognize the differences in more detailed shapes of texture elements. For ex ample, it will not distinguish texture made of "capital A" and triangles (6) of the same size and organization. Here more local operators are necessary. So the spa tial technique, being more local and therefore more ac curate in some sense, can complement the Fourier tech nique. Which operator is used where should be deter mined by higher level program.
Acknowledgements
Tom Binford and John McCarthy have commented crit ically and helpfully on an earlier draft of the mater ial. I wish to express my thanks also to the reviewers of this paper for their constructive criticism. Most of the work on this paper was carried out when the au thor was at the Artificial Intelligence project, Stanford University, Stanford, California. Final prepara tion of the paper was supported in part by the Ad·~ vanced Research Projects Agency of the Office of the Secretary of Defense under Contract No. SD-183.
@inproceedings{ijcai1973p71,
  title     = {Computer Description of Textured Surfaces},
  author    = {Bajcsy, Ruzena},
  booktitle = {Proceedings of the Third International Joint Conference on
               Artificial Intelligence, {IJCAI-73}},
  publisher = {International Joint Conferences on Artificial Intelligence},
  editor    = {Nils J. Nilsson},
  pages     = {572--578},
  year      = {1973},
  month     = {8},
  note      = {Computer Vision},
  url       = {https://ijcai.org/proceedings/1973/71},
}
TY - CPAPER TI - Computer Description of Textured Surfaces AU - Bajcsy, Ruzena T2 - Proceedings of the Third International Joint Conference on Artificial Intelligence, IJCAI-73 PB - International Joint Conferences on Artificial Intelligence PY - 1973 SP - 572 EP - 578 UR - https://ijcai.org/proceedings/1973/71 ER -Copied
Machine-readable versions of this paper, for tools and AI agents:





