
PhysTrans: A Physics-Aware Transferable Framework for Global Cold-Start Photovoltaic Forecasting
Proceedings of the Thirty-Fifth International Joint Conference on Artificial Intelligence. AI and Social Good. Pages 7464-7473.
https://doi.org/10.24963/ijcai.2026/830
Keywords
- Humans and AI: Humans and AI
- Multidisciplinary Topics and Applications: Multidisciplinary Topics and Applications
- Machine Learning: Machine Learning
Abstract
With the rapid expansion of photovoltaic (PV) power generation worldwide, PV systems have become key to global energy construction. Accurate PV forecasting is essential for safe grid operation and renewable energy integration. However, most existing models rely heavily on site-specific historical data and perform poorly when deployed in cold-start scenarios of newly built power plants. We propose PhysTrans, a physics-aware transferable framework for cold-start PV forecasting. Firstly, we design a physics-constrained residual network that utilizes a clear-sky module for better physical consistency. Furthermore, we propose a dynamic cloud cropping method to obtain the cloud information of shaded PV stations by fitting the angle of the sun offsets. To fuse the asymmetric data, a query-based asymmetric fusion mechanism is introduced to achieve high-precision alignment of multi-modal data. We conduct experiments on global datasets, and the results show that the PhysTrans outperforms state-of-the-art models with a 13.2% decrease in MAE in the single-site task, and also outperforms existing migration models with an average decrease in MAE of 12.7% in the cross-sites task. Our work advances reliable and transferable PV forecasting for early-stage grid integration and contributes to SDG 7 (Affordable and Clean Energy) and SDG 13 (Climate Action), in line with the Leave No One Behind principle.
- [Ahmad et al., 2025] Hadiqa Ahmad, Muhammad Yaqub, and Seung Hwan Lee. Global trends in carbon neutral- ity: a scientometric review on energy transition challenges, practices, policies, and opportunities. Environment, Devel- opment and Sustainability, pages 1-26, 2025.
- [Amaral et al., 2025] Tito G Amaral, Armando Cordeiro, and Vitor Fernao Pires. Artificial vision in renewable pho- tovoltaic systems: a review and vision of specific applica- tions and technologies. 2025.
- [Bak et al., 2025] Seongho Bak, Sowon Choi, Donguk Yang, Doyoon Kim, Heeseon Rho, and Kyoobin Lee. Transfer learning for photovoltaic power forecasting across regions using large-scale datasets. IEEE access, 2025.
- [Bashyal et al., 2025] Atit Bashyal, Chidambar Prabhakar Bangre, Tina Boroukhian, and Hendro Wicaksono. Un- supervised domain adaptation framework for photovoltaic power forecasting using variational auto-encoders. Ap- plied Energy, 400:126606, 2025.
- [Chala and Al Alshaikh, 2023] Girma T Chala and Shamsa M Al Alshaikh. Solar photovoltaic energy as a promising enhanced share of clean energy sources in the future-a comprehensive review. Energies, 16(24):7919, 2023.
- [Chala et al., 2025] Girma T Chala, Shaharin A Sulaiman, and Xuecheng Chen. A study on the performance of soiled solar photovoltaic panels at different tilt angles in al seeb, oman. Energies, 18(2):301, 2025.
- [Dave and Vajpai, 2026] Ronak Dave and Jayashri Vajpai. A review on solar power generation forecasting methods. Transactions of the Indian National Academy of Engineer- ing, pages 1-24, 2026.
- [De La Peña et al., 2022] Lizette De La Peña, Ru Guo, Xi- aojing Cao, Xiaojing Ni, and Wei Zhang. Accelerating the energy transition to achieve carbon neutrality. Resources, Conservation and Recycling, 177:105957, 2022.
- [Dimd et al., 2022] Berhane Darsene Dimd, Steve Völler, Umit Cali, and Ole-Morten Midtgård. A review of ma- chine learning-based photovoltaic output power forecast- ing: Nordic context. IEEE Access, 10:26404-26425, 2022.
- [Fonou et al., 2024] Husserl Djouodjinang Fonou, Armand Fopah-Lele, Lena Dzifa Mensah, Rahimat Oyiza Yakubu, and David Ato Quansah. Global status and prospects for hybrid hydrogen-natural gas systems for power plants in sub-saharan africa. Clean Energy, 8(6):63-81, 2024.
- [Gupta and Singh, 2021] Priya Gupta and Rhythm Singh. Pv power forecasting based on data-driven models: a re- view. International Journal of Sustainable Engineering, 14(6):1733-1755, 2021.
- [Howlader, 2025] Abdus Salam Howlader. Machine learn- ing applications in renewable energy: Predictive analytics for solar cell performance optimization and energy yield forecasting. American Journal of Scholarly Research and Innovation, 4(01):392-427, 2025.
- [Joshi et al., 2025] Pratik Joshi, Anand B Rao, and Rangan Banerjee. Review of solar pv deployment trends, policy instruments, and growth projections in china, the united states, and india. Renewable and Sustainable Energy Re- views, 213:115436, 2025.
- [Kim et al., 2025] Minjoong Kim, Hyeonwoo Kim, and Ji- hoon Moon. Beginner-friendly review of research on r- based energy forecasting: Insights from text mining. Elec- tronics (2079-9292), 14(17), 2025.
- [Kumar et al., 2025] Rohit Kumar, Sudhansu Kumar Mishra, Amit Kumar Sahoo, Subrat Kumar Swain, Ram Sha- ran Bajpai, Aymen Flah, Mishari Metab Almalki, Habib Kraiem, and Mohamed F Elnaggar. Data driven prediction based reliability assessment of solar energy systems incor- porating uncertainties for generation planning. Scientific Reports, 15(1):9335, 2025.
- [Liu and Du, 2023] Zhuoqun Liu and Yang Du. Evolution towards dispatchable pv using forecasting, storage, and curtailment: A review. Electric Power Systems Research, 223:109554, 2023.
- [Luo et al., 2022] Xing Luo, Dongxiao Zhang, and Xu Zhu. Combining transfer learning and constrained long short- term memory for power generation forecasting of newly- constructed photovoltaic plants. Renewable energy, 185:1062-1077, 2022.
- [Luo et al., 2023] Tongtong Luo, Zhiyuan Tang, Junyong Liu, and Bo Zhou. A review of transfer learning ap- proaches for load, solar and wind power predictions. In 2023 Panda Forum on Power and Energy (PandaFPE), pages 1580-1584. IEEE, 2023.
- [Luo et al., 2025] Wenxiang Luo, Yang Shen, Zewen Li, and Fangming Deng. Distributed photovoltaic short-term power prediction based on personalized federated multi- task learning. Energies, 18(7):1796, 2025.
- [Mao et al., 2023] Hongzhi Mao, Xie Chen, Yongqiang Luo, Jie Deng, Zhiyong Tian, Jinghua Yu, Yimin Xiao, and Jianhua Fan. Advances and prospects on estimating so- lar photovoltaic installation capacity and potential based on satellite and aerial images. Renewable and Sustainable Energy Reviews, 179:113276, 2023.
- [Miraftabzadeh et al., 2023] Seyed Mahdi Miraftabzadeh, Cristian Giovanni Colombo, Michela Longo, and Federica Foiadelli. A day-ahead photovoltaic power prediction via transfer learning and deep neural networks. Forecasting, 5(1):213-228, 2023.
- [Pan et al., 2024] Chen Pan, Yuqiao Liu, Yeonjae Oh, and Changgyoon Lim. Short-term photovoltaic power fore- casting using pv data and sky images in an auto cross modal correlation attention multimodal framework. En- ergies, 17(24):6378, 2024.
- [Patel, 2025] Pratikkumar Dilipkumar Patel. Artificial intel- ligence in datacenters: Optimizing performance, power, and thermal management. Journal of Computer Science and Technology Studies, 7(4):952-963, 2025.
- [Qin et al., 2022] Jun Qin, Hou Jiang, Ning Lu, Ling Yao, and Chenghu Zhou. Enhancing solar pv output forecast by integrating ground and satellite observations with deep learning. Renewable and Sustainable Energy Reviews, 167:112680, 2022.
- [Qu et al., 2025] Jiaqi Qu, Qiang Sun, Zheng Qian, Hamidreza Zareipour, and Zhao Yang Dong. A transfer- able framework of pv power forecasting for cross-regional distributed pv systems using domain adversarial temporal network. IEEE Transactions on Industrial Informatics, 2025.
- [Sim et al., 2025] Ying Sim, Ankit, Yeow Boon Tay, Dwarakanath Ravikumar, and Nripan Mathews. Open challenges and opportunities in photovoltaic recycling. Nature Reviews Electrical Engineering, 2(2):96-109, 2025.
- [Singh et al., 2025] Anjana Singh, Ravi Shankar, and Amitesh Kumar. A comprehensive review of load fre- quency control and solar energy integration: Challenges & opportunities in indian context. Energies (19961073), 18(4), 2025.
- [Sun et al., 2025a] Dezhi Sun, Alessandro Cappellari, Bangyu Lan, Momen Abayazid, Stefano Stramigioli, and Kenan Niu. Automatic robotic ultrasound for 3d muscu- loskeletal reconstruction: A comprehensive framework. Technologies, 13(2):70, 2025.
- [Sun et al., 2025b] Dezhi Sun, Stefano Stramigioli, and Ke- nan Niu. Hcce-cunet based multi-class musculoskeletal segmentation for robotic ultrasound system. IEEE Trans- actions on Medical Robotics and Bionics, 2025.
- [Wan et al., 2025] Meng Wan, Tiantian Liu, Yuxuan Bi, Jue Wang, Hui Cui, Rongqiang Cao, Jiaxiang Wang, Peng Shi, Ningming Nie, and Yangang Wang. Mcloudnet: An ultra- short-term photovoltaic power forecasting framework with multi-layer cloud coverage. In Proceedings of the Thirty- Fourth International Joint Conference on Artificial Intelli- gence, pages 9908-9917, 2025.
- [Wang et al., 2024] Xinhong Wang, Xuefeng Gao, Bingling Li, Yu Shi, Xiaoming Lu, Yiwen Yao, Dingheng Wang, Xin Xu, and Hao Li. Photovoltaic power prediction con- sidering vmd-cnn-lstm and migration learning frameworks for poor data areas. In 2024 IEEE 4th International Con- ference on Power, Electronics and Computer Applications (ICPECA), pages 509-514. IEEE, 2024.
- [Wang et al., 2025] Kai Wang, Shuo Shan, Weijing Dou, Haikun Wei, and Kanjian Zhang. A cross-modal deep learning method for enhancing photovoltaic power fore- casting with satellite imagery and time series data. Energy Conversion and Management, 323:119218, 2025.
- [Wu et al., 2024] Yuhan Wu, Chun Xiang, Heng Qian, and Peijian Zhou. Optimization of bi-lstm photovoltaic power prediction based on improved snow ablation optimization algorithm. Energies, 17(17):4434, 2024.
- [Wu et al., 2025] Hongyu Wu, Chengxin Zhang, Bin Zhao, Gang Pei, and Cheng Liu. The underappreciated role of developing photothermal power towards carbon neutrality. Renewable and Sustainable Energy Reviews, 211:115366, 2025.
- [Xie et al., 2025] Chenlei Xie, Zhiyuan Zhang, Tao Chen, and Qiansheng Fang. Sky-image-based ultra-short-term pv power forecasting for campus microgrids. Journal of Renewable and Sustainable Energy, 17(5), 2025.
- [Yang and Huang, 2025] Chung-Han Yang and Jack Huang. Advancing energy storage technologies and governance in the asia-pacific region: A review of international frame- works, research insights, and regional case studies. Energy Storage and Applications, 2(3):8, 2025.
- [Yang et al., 2023] Jing Yang, Hui He, Xuemeng Zhao, Jue Wang, Tiechui Yao, Haizhou Cao, and Meng Wan. Day- ahead pv power forecasting model based on fine-grained temporal attention and cloud-coverage spatial attention. IEEE Transactions on Sustainable Energy, 15(2):1062- 1073, 2023.
- [Yu et al., 2024] Junfeng Yu, Xiaodong Li, Lei Yang, Linze Li, Zhichao Huang, Keyan Shen, Xu Yang, Xu Yang, Zhikang Xu, Dongying Zhang, et al. Deep learning models for pv power forecasting. Energies, 17(16):3973, 2024.
- [Zang et al., 2024] Haixiang Zang, Dianhao Chen, Jingx- uan Liu, Lilin Cheng, Guoqiang Sun, and Zhinong Wei. Improving ultra-short-term photovoltaic power forecast- ing using a novel sky-image-based framework considering spatial-temporal feature interaction. Energy, 293:130538, 2024.
- [Zheng et al., 2024] Wanting Zheng, Hao Xiao, Hai Zhou, Nan Wang, Yifei Guan, and Wei Teng. Distributed pho- tovoltaic power prediction with limited data: A combined ensemble learning and transfer learning approach. In 2024 9th Asia Conference on Power and Electrical Engineering (ACPEE), pages 1373-1378. IEEE, 2024.
- [Zhou et al., 2024] Daixuan Zhou, Yujin Liu, Xu Wang, Fuxing Wang, and Yan Jia. Research progress of pho- tovoltaic power prediction technology based on artificial intelligence methods. Energy Engineering, 121(12), 2024.
- [Zhu et al., 2022] Yanming Zhu, Xiaoyuan Xu, Zheng Yan, and Jianyu Lu. Data acquisition, power forecasting and coordinated dispatch of power systems with distributed pv power generation. The Electricity Journal, 35(5):107133, 2022.
References were extracted automatically from the PDF and may contain errors.
Full text extracted automatically from the PDF; figures, tables and equations may differ. The PDF is the version of record.
1 Introduction
Driven by global carbon neutrality goals, low-carbon energy transition has become a central strategy for national development [De La Pe˜na et al., 2022; Ahmad et al., 2025]. Photovoltaic (PV) power generation, the most widely deployed and fastest-declining cost clean energy source, is expanding rapidly worldwide, with an average annual growth rate of about 40% [Chala et al., 2025]. From large-scale PV plants in China, to utility-scale installations in the Middle East, to distributed microgrids in Southeast Asia, PV power has become a key pillar in achieving carbon neutrality [Yang and Huang, 2025; Wu et al., 2025]. In several fast-growing markets like India, annual PV additions more than doubled in 2024 and continued to accelerate into 2025, leading to a rapid surge of newly commissioned PV plants [Singh et al., 2025]. Meanwhile, the rapid growth of artificial intelligence computing demand has significantly increased power system loads, making data centers and computing infrastructure major electricity consumers with strict stability requirements [Patel, 2025]. Therefore, electricity grid operation depends on the reliability of PV power prediction [Kumar et al., 2025]. The accurate PV power forecasting is an important prerequisite for secure grid dispatch [Zhu et al., 2022].
Despite recent progress in deep-learning PV power forecasting, most existing models rely on an implicit assumption that historical data are sufficient [Dimd et al., 2022; Yu et al., 2024]. In many new markets, including regions in Africa and Latin America, newly PV plants often face a cold-start period with severe data scarcity for about 1 year [Fonou et al., 2024; Kim et al., 2025]. During this phase, the transferability and reliability of existing models degrade, which disrupts grid safe operation and leads to economic losses [Gupta and Singh, 2021]. This may be due to the fact that the models still use old data experience when migrating across new regions and have difficulty in adapting to differences in characteristics such as climate, clouds and solar irradiation [Dave and Vajpai, 2026]. Therefore, recent research is focused on the satellite cloud image, which provides global historical data as an important external data source for cold-start scenario [Qin et al., 2022; Sun et al., 2025a]. However, the state-of-the-art (SOTA) methods such as BiLSTM-based approaches [Wu et al., 2024] and MCloudNet [Wan et al., 2025] typically apply fixed-window cropping, which treat overhead cloud as direct shading indicators. This strategy ignores geometric parallax between cloud positions and their projected shadows caused by seasonal and diurnal solar motion. Furthermore, without explicit physical constraints, these models may produce non-physical predictions under extreme weather conditions, which can lead to potential system risks during grid dispatch [Liu and Du, 2023; Sun et al., 2025b]. In areas with limited infrastructure and data availability, the above challenges will seriously affect the deployment of clean energy and climate action [Chala and Al Alshaikh, 2023].
To address these challenges, we propose a physics-aware transferable framework for global cold-start PV forecasting, which implement asymmetric fusion of time series and satellite data. This design can reduce the dependence on local historical data from the model structure and achieve highprecision prediction with very few historical samples. The main contributions are summarized as follows:
- Physics-aware consistency modeling: We model PV power as a residual correction around the clear-sky physical baseline, with a solar-zenith design and day-night mask embedded for physical consistency.
- Geometry-based satellite image cropping: We design a dynamic region-of-interest (ROI) cropping strategy that corrects satellite parallax and aligns cloud regions with the real solar illumination path.
- Comprehensive cold-start evaluation: We evaluate PhysTrans under three settings, including single-site forecasting, zero-shot cross-site transfer, and few-shot target-site adaptation. The comparisons cover general time-series forecasters, transfer-learning baselines, and PV-specific multimodal forecasting models, demonstrating the effectiveness of PhysTrans in both normal and cold-start PV forecasting scenarios.
- Social and economic impact: Based on deployments at newly built PV plants in Yunnan, the PhysTrans reduces deviation energy on about 10,000 MWh during the first year operation, while supporting newly plants worldwide for rapid deployment and safe grid dispatch.
This work is aligned with the United Nations Sustainable Development Goals SDG 7 and SDG 13. For rapidly growing PV markets such as Brazil and Southeast Asia, the PhysTrans supports newly plants with accurate power forecasting under the Leave No One Behind (LNOB) principle. To encourage broader adoption, the codes and part of data of PhysTrans are open-source released, enabling PV plants worldwide to apply it for power grid operation analysis and carbon emission assessment. The codes and data are available at: https://github.com/KabulG/PhysTrans.
2 RelatedWork
2.1 Multimodal PV Forecasting with Satellite
In recent years, PV prediction based on satellite and cloud images has developed rapidly [Qin et al., 2022; Mao et al., 2023; Amaral et al., 2025]. Yang et al. incorporate fine-grained temporal attention and cloud-coverage spatial attention into a day-ahead PV forecasting model for cloud-induced spatial heterogeneity [Yang et al., 2023]. The spatio-temporal interactions of clouds are proposed to improve the ultrashort-term accuracy through a two-stream cloud image framework [Zang et al., 2024]. Luo et al. show that relying on sky image brightness features can improve ultra-short prediction [Xie et al., 2025]. The ACMCA cross-modal attention network are designed to jointly learn power and satellite image features [Pan et al., 2024]. Cross-modal fusion studies integrate PV temporal sequences with sky images via an attention mechanism [Wang et al., 2025]. The latest MCloudNet models multilayered cloud structures and has been deployed in a real-world scheduling system [Wan et al., 2025]. Despite the advances in image fusion, existing work generally relies on fixed ROI and ignores the key issues of cloud parallax and solar geometry offset.
2.2 Transferable and Data-Scarce PV Forecasting
Cross-site relocatable PV prediction aims to reduce the data requirements of new plants [Luo et al., 2023; Zhou et al., 2024; Howlader, 2025]. Luo et al. propose an early cold-start relocation framework for new plants, which is able to complete the initial adaptation with very little target data [Luo et al., 2022]. The DRFN network utilizes the random modeling ability of VAE to enhance the model's generalization ability and achieve small sample transfer [Bashyal et al., 2025]. TL-PatchTST uses a hybrid structure to enhance the cross site generalization of multi-step prediction and maintain stable performance under multi site conditions [Bak et al., 2025]. Other works further explore personalization [Miraftabzadeh et al., 2023; Luo et al., 2025] and regional-level migration [Wang et al., 2024; Zheng et al., 2024] to handle site heterogeneity in distributed PV. DATN (2025) then enhances the robustness of cross-region migration through domain-adversarial time-series networks [Qu et al., 2025]. However, a key challenge remains open as existing methods heavily rely on historical data from the target site, which limits their effectiveness in true cold start scenarios.
3 The Overall Framework
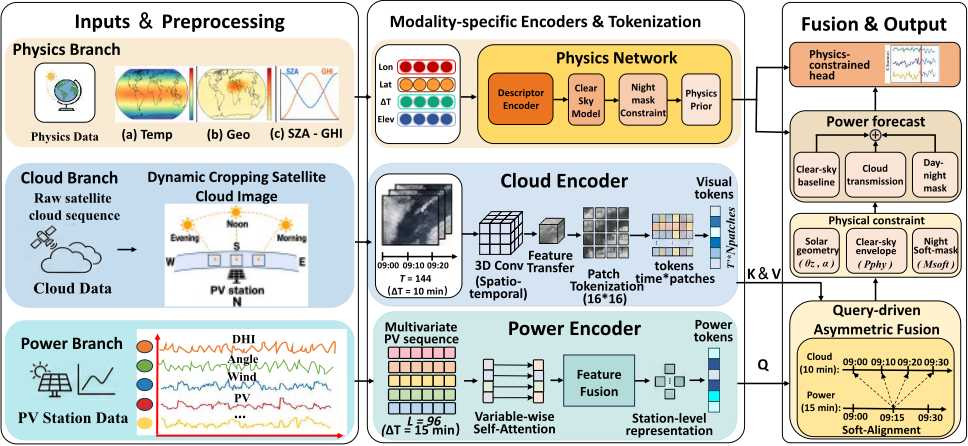
The overall architecture of PhysTrans is shown in Figure 1. The complete process is divided into three stages: Input & Preprocessing, Multi-Modal Encoders, and Fusion & Output. Firstly, the input includes three types of data sources: Physics Branch, Cloud Branch, and Power Branch, which are also multimodal. During the preprocessing process, the latitude and longitude information in Physics Branch is used to calculate physical reference variables and guide the dynamic cropping of satellite image based on the path of sunlight. The variables such as power in Power Branch are organized into a fixed length time series. Then, in the Multi-Modal Encoders stage, the above multi-modal data will be independently encoded. We have introduced mechanisms such as day night constraint and 3D convolution. Physics Branch is transformed into a physical prior representation, Cloud Branch features are extracted to capture cloud occlusion effects, and power sequences are mapped to station-level representations. The cloud branch is implemented as a lightweight 3D-convolutional encoder for spatio-temporal feature extraction from dynamically cropped satellite cloud sequences. It does not rely on a pretrained vision backbone. Instead, the cloud encoder, power encoder, fusion module, and physicsconstrained head are optimized in an end-to-end manner. Finally, in the fusion stage, power features are used as queries to retrieve relevant cloud features under asymmetric sampling. The physical constraint combines the physical baseline with the learned residual correction to produce the final PV power prediction.
4 Methods
This section describes the core components of PhysTrans. In this work, the cold-start period refers to the first year of newly commissioned PV plants with limited historical data. Specifically, we denote the setting with no target-site data as zeroshot cold-start, and the setting with a small amount of targetsite data for adaptation as few-shot cold-start.
4.1 Physics-Aware ConsistencyModeling
To generate reasonable predictions with limited historical data, we design a physics-aware strategy with constrained residual learning.
It should be noted that the clear-sky branch is intentionally designed as a lightweight physical prior rather than a full irradiance simulator. In cold-start scenarios, the main objective is to provide a stable and interpretable baseline when sitespecific historical data are scarce. Complex environmental disturbances, capacity deviations, and local operational factors are further compensated by the residual correction terms and the multimodal fusion branch.
Astronomical Geometry and Physical Baseline
A data-independent clear-sky physical baseline model is constructed, which mainly depends on the spatial geometry and geographic location of the power station. The solar zenith angle θz is defined as the angle between the incident solar rays and the local vertical direction. It determines the effective surface irradiance and is computed as:
where ϕ denotes the latitude of the power station, δ is the solar declination angle, and ω is the solar hour angle computed from the local true solar time.
To model the power output more accurately, system efficiency and temperature correction are introduced. Therefore, the clear sky physical PV power baseline Pbase is defined as:
where Isc is the solar constant, Cap denotes the installed capacity of the PV station, η represents the system efficiency, γ is the temperature coefficient, and T is the ambient temperature. We set Tstc = 25◦C and Istc = 1000 W/m2 following the standard test conditions (STC) commonly used to rate PV modules. Note that these STC values serve only as fixed reference constants for normalization. When deploying to other regions, the baseline adapts the site-specific inputs such as latitude and ambient temperature, while the STC references remain unchanged.
Parametric Residual Mapping
The clear sky physical baseline value provides a reasonable upper limit for PV power generation, but in practice, it cannot capture the operating conditions of installed capacity deviation and environmental changes. To solve this problem, we redefine the prediction task as a residual learning process that is emphasized relative to the physical baseline. The clear sky PV value is updated by introducing the capacity scaling factor kscale, and the capacity deviation term βcap. We use the cloud attenuation factor kc to correct the prediction bias caused by cloud obscuration. Finally, the residual term Pres is added to fit the abnormal changes. In this way, the corrected output Pcorrected is constrained to an interpretable physical residual space, which is defined as:
Nighttime Soft Mask and Structural Consistency
To eliminate non-zero power predictions at night and ensure consistency with solar conditions, especially smooth transitions around sunrise and sunset, a nighttime soft mask hnorm is designed, which is defined as the normalized solar height:
where τ controls the smoothness of the day-night transition. Finally, the physics baseline output Pphy is composed of the clear sky model, the residual correction terms, and the nighttime mask:
4.2 Dynamic ROI Cropping Based on Geometry
To enhance the correlation between satellite images and PV power fluctuations, we propose a dynamic ROI cropping strategy guided by solar geometry. Different from the fixed cropping window at the center of the top of the PV plant, this method adaptively shifts the cropping window along the solar incidence direction. It can select the most relevant clouds that have a real shading effect on the PV plant.
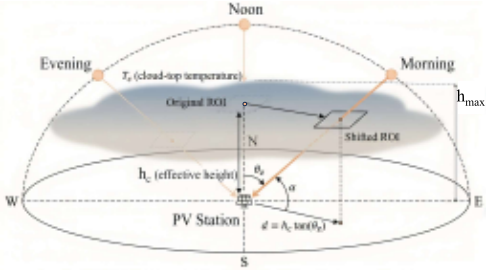
Let (x0, y0) denote the pixel coordinates of the power station in the satellite cloud image, where x0 and y0 correspond to the east-west and north-south axes, respectively. r denotes the spatial resolution of the satellite image (metre/pixel) and t denotes the time index. At each moment t, the solar azimuth angle α(t) and solar zenith angle θz(t) are calculated based on the station position and time information. The α(t) determines the panning direction of the cropping window and θz(t) controls the panning amplitude.
To estimate the cloud height used for ROI displacement, we utilize the thermal infrared brightness-temperature channel from geostationary meteorological satellites. For the Chinese sites, the TBB13 channel of Himawari-8 is used, while the corresponding infrared brightness temperature product is used for GOES-West over the Stanford region. Specifically, a pixel neighborhood Ω of size 9 × 9 is constructed around the PV station location (x0, y0), and the median brightness temperature within this neighborhood is used as the effective cloud-top brightness temperature:
where T(x, y, t) denotes the brightness temperature value at pixel (x, y) and time t.
Based on the cloud-top brightness temperature Tc(t) and the near-surface reference temperature Tref(t), we estimate an effective cloud height under the standard tropospheric lapse-rate approximation:
where Tref (t) denotes the near-surface reference temperature obtained from local meteorological measurements or forecast variables, and Γ = 6.5K/km is the standard tropospheric lapse rate. The estimated hc(t) is not intended to recover exact cloud microphysics. Instead, it serves as a geometryguided effective cloud height for estimating the ROI displacement caused by cloud-shadow projection.
As shown in Figure 2, the horizontal projection distance of a cloud on the ground is approximated as:
where d(t) denotes the physical distance between the cloud shadow and the power station. Converting this distance to a pixel-scale displacement:
where s(t) refers to the amount of translation in pixel units. Finally, the dynamic cropping center (xt, yt) at moment t is defined as:
To avoid invalid cropping when the shifted ROI exceeds the satellite image boundary, we clamp the crop center into the valid image range:
where W and H are the image width and height, and Wroi and Hroi are the ROI width and height. The final cropping center is (ˆxt, ˆ yt), ensuring that the dynamic ROI always remains inside the valid satellite image region.
4.3 Query-Driven Asymmetric Multimodal Fusion
PV power sequences and satellite cloud image sequences have different temporal sampling intervals. The sampling interval for power measurements is 15 minutes, while the update interval for satellite cloud maps is 10 minutes. To achieve the alignment without interpolation noise, we propose a query-driven asymmetric fusion mechanism.
Asynchronous Semantic Alignment
The cloud map branch uses a 3D convolutional network to encode the ROI cropping image into a visual feature vector sequence Zcloud = {zc(tj)}tj∈Tc , where zc(tj) ∈ Rd denotes the visual feature vector corresponding to the cloud map timestamp tj and d is the feature dimension. Correspondingly, the power branch encodes the multivariate observation as a sequence of power feature vectors Zpower = {zp(ti)}ti∈Tp , where zp(ti) ∈ Rd denotes the power-side vector with the timestamp ti.
To deal with the asynchronous intervals problem, we design the power-side features as Query to retrieve the most relevant moment from the cloud image features. For any power timestamp ti and cloud map timestamp tj, define the Query, Key and Value vectors qi, kj , vj ∈ Rd as follows:
whereWQ,WK,WV ∈ Rd×d are learnable projection matrices that map power-side and cloud-side features into the same embedding space. The attention score eij is augmented with a learnable embedding of the relative time offset ∆tij:
where b(·) is implemented by a learnable offsets embedding, which helps the model to fuse the temporal relationship between power changes and cloud image by alignment.
Locally Constrained Time Mask
To avoid matching power features with temporally irrelevant cloud information, we design a local time maskMij:
where Mij limits attention to a short time window centered on each time step of power data. The normalized attention weights αij and the visual representation ˜zc(ti) at the power timestamp ti are computed as:
The 30-minute local window is physically motivated by cloud advection: with a representative cloud-motion speed of 10m/s, it corresponds to approximately 18km of horizontal displacement, which is sufficient to cover nearby cloud observations affecting PV output while filtering temporally distant and weakly related cloud maps.
Learnable Gating and Residual Projection
In cold-start scenarios, time series power data is usually easier to learn than image features. To avoid the interference of image noise on the learning process in the early stage of training, a time adaptive learning gating mechanism is designed to adjust the injection intensity of image information. Specifically, for each power timestamp ti, a scalar gating coefficient gi ∈ (0, 1) is computed:
where wg ∈ Rd is the learnable parameter vector and σ(·) denotes the Sigmoid activation function. Then the fusion representation is obtained by residual summing and layer normalization:
Finally, the fusion feature zfuse(ti) is fed into a lightweight MLP that compensates for residual errors not captured by the physics-aware module:
where ∆P(ti) denotes the learned correction at timestamp ti. The final PV power prediction is obtained by the physicsguided output Pphy(ti):
5 Experiments
5.1 Datasets
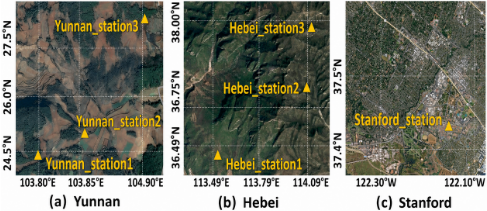
As shown in Fig. 3, we evaluate PhysTrans on PV datasets from Stanford, Hebei, and Yunnan. The Hebei and Yunnan datasets are collected from real newly commissioned PV plants, where each plant is paired with 10-minute satellite cloud maps and 15-minute local measurements. The Stanford dataset is based on the publicly available PV data released by Stanford University and is further augmented with corresponding ECMWF weather forecast variables and GOESWest satellite cloud observations. To evaluate temporal distribution shifts, we split the Stanford time series into three non-overlapping chronological subsets, denoted as Stanford station1, Stanford station2, and Stanford station3 in the experimental tables. These subsets are constructed from the same public site and are used to simulate seasonal variability, rather than representing independent commissioned PV plants. Satellite cloud images are obtained from geostationary meteorological satellites with regional coverage: Himawari-8 for stations in China and GOES-West for the Stanford region. All satellite inputs are processed into a unified cloud-feature representation with consistent spatial resolution and temporal sampling to support cross-region evaluation.
5.2 Experimental Setup
All timestamps are uniformly mapped to the local reference time zone. We use the past 24 hours to predict the day-ahead prediction length. We split each time series into training, validation, and test sets with a ratio of 8:1:1 along the temporal axis, without random shuffling. For few-shot adaptation, we use only the earliest three months of target-site data for adaptation. We use Mean Absolute Error (MAE) and Mean Square Error (MSE) as the final test metrics. In the following analysis, iTransformer is used as the baseline for reporting relative improvements, while TL-PatchTST, DRFN, MCloudNet, TimeXer, and PatchTST are included as compared methods. All error metrics are reported on standardized PV power values to ensure comparability across stations with different installed capacities. All models are implemented in PyTorch and trained using the Adam optimizer for 40 epochs with an initial learning rate of 0.001 and batch size = 256. Experiments are conducted on NVIDIA A100 (80GB) GPUs.
| Methods | Ours | TL-PatchTST | DRFN | MCloudNet | TimeXer | iTransformer | PatchTST | ||||||||
|---|---|---|---|---|---|---|---|---|---|---|---|---|---|---|---|
| Region | Station | MAE | MSE | MAE | MSE | MAE | MSE | MAE | MSE | MAE | MSE | MAE | MSE | MAE | MSE |
| Source station | 0.393 | 0.328 | 0.972 | 1.137 | 0.413 | 0.358 | 0.432 | 0.371 | 0.415 | 0.360 | 0.461 | 0.379 | 0.738 | 0.881 | |
| HB station1 | 0.533 | 0.667 | 1.492 | 8.474 | 0.580 | 0.740 | 0.608 | 0.736 | 0.641 | 0.775 | 0.566 | 0.645 | 0.828 | 1.169 | |
| HB station2 | 0.473 | 0.522 | 1.041 | 3.845 | 0.504 | 0.578 | 0.521 | 0.548 | 0.538 | 0.544 | 0.478 | 0.455 | 0.692 | 0.820 | |
| HB station3 | 0.477 | 0.505 | 1.174 | 4.091 | 0.516 | 0.570 | 0.542 | 0.582 | 0.555 | 0.605 | 0.496 | 0.502 | 0.713 | 0.913 | |
| Stanford | YN station1 | 0.709 | 1.195 | 3.109 | 9.731 | 0.739 | 1.205 | 0.788 | 1.271 | 0.819 | 1.363 | 0.952 | 1.583 | 0.744 | 1.207 |
| YN station2 | 0.832 | 1.918 | 2.825 | 8.071 | 0.874 | 2.052 | 0.864 | 1.602 | 0.903 | 1.793 | 0.913 | 1.436 | 0.881 | 1.762 | |
| YN station3 | 0.820 | 1.913 | 1.937 | 4.677 | 0.861 | 2.047 | 0.895 | 1.681 | 0.913 | 1.539 | 0.934 | 1.861 | 1.118 | 1.448 | |
| Source station | 0.519 | 0.623 | 1.015 | 2.511 | 0.545 | 0.667 | 0.472 | 0.598 | 0.456 | 0.547 | 0.562 | 0.643 | 0.819 | 1.144 | |
| Stanford station1 | 0.379 | 0.351 | 1.648 | 4.751 | 0.399 | 0.406 | 0.418 | 0.389 | 0.596 | 0.542 | 0.443 | 0.371 | 0.544 | 0.474 | |
| Stanford station2 | 0.517 | 0.625 | 2.121 | 4.963 | 0.543 | 0.689 | 0.542 | 0.661 | 0.565 | 0.688 | 0.565 | 0.654 | 0.748 | 0.655 | |
| Stanford station3 | 0.556 | 0.351 | 2.105 | 5.319 | 0.584 | 0.381 | 0.561 | 0.703 | 0.668 | 0.614 | 0.582 | 0.509 | 0.585 | 0.509 | |
| HeBei | YN station1 | 0.715 | 0.905 | 3.511 | 13.608 | 0.751 | 0.968 | 0.742 | 1.142 | 0.754 | 1.231 | 0.681 | 0.941 | 0.726 | 1.183 |
| YN station2 | 0.838 | 1.824 | 4.346 | 19.119 | 0.880 | 1.952 | 0.853 | 1.587 | 0.905 | 1.798 | 0.713 | 1.341 | 0.861 | 1.704 | |
| YN station3 | 0.801 | 1.800 | 3.797 | 16.191 | 0.816 | 1.926 | 0.872 | 1.633 | 0.842 | 0.749 | 1.350 | 1.266 | 0.821 | 0.937 | |
| Source station | 0.785 | 1.599 | 1.423 | 2.964 | 0.800 | 1.711 | 0.804 | 1.631 | 0.821 | 1.615 | 0.945 | 1.927 | 1.065 | 2.328 | |
| Stanford station1 | 0.403 | 0.385 | 2.335 | 6.782 | 0.423 | 0.442 | 0.512 | 0.458 | 0.527 | 0.473 | 0.555 | 0.453 | 0.678 | 0.713 | |
| Stanford station2 | 0.668 | 0.919 | 2.875 | 9.551 | 0.701 | 0.983 | 0.589 | 0.721 | 0.774 | 1.192 | 0.784 | 1.109 | 0.991 | 1.693 | |
| Stanford station3 | 0.410 | 0.361 | 2.758 | 9.243 | 0.431 | 0.416 | 0.548 | 0.486 | 0.585 | 0.511 | 0.521 | 0.401 | 0.798 | 0.903 | |
| YunNan | HeBei station1 | 0.484 | 0.483 | 1.941 | 6.235 | 0.508 | 0.537 | 0.612 | 0.731 | 0.656 | 0.782 | 0.658 | 0.776 | 0.857 | 1.819 |
| HeBei station2 | 0.505 | 0.507 | 1.342 | 3.065 | 0.530 | 0.572 | 0.633 | 0.756 | 0.673 | 0.875 | 0.548 | 0.513 | 0.884 | 1.319 | |
| HeBei station3 | 0.469 | 0.427 | 0.766 | 1.677 | 0.492 | 0.477 | 0.602 | 0.718 | 0.571 | 0.592 | 0.677 | 0.813 | 0.754 | 0.925 | |
5.3 Single-Site PV Power Accuracy Prediction
To verify the base performance of our model on single-site with 2 years historical data, we perform a train-test task on 3 sites and the results are shown at the first line of each plant in Table 1. These results indicate that the model achieves better performance than other models, with the average MAE decreasing by 13.2% compared to the baseline. In particular, at the data-scarce Yunnan site, MAE decreases by 16%. This result shows that the proposed model provides strong performance in normal single-site PV prediction task. This is maybe due to the design of a physical constraints with accurate irradiance.
5.4 Zero-Shot Cross-Site Transfer Experiment
To evaluate cross-site generalization, we design three sets of zero-shot transfer experiments. In each experiment, the model is trained on one source region and directly evaluated on the other target regions without using target-site training samples. For the Stanford data, station1/2/3 follow the chronological subset setting described in Section 5.1. The transfer results are reported in Table 1. PhysTrans achieves stable advantages in most target settings. In particular, under the Stanford→Yunnan transfer setting, MAE is reduced by 15.7% compared with the baseline. This suggests that PhysTrans relies less on source-domain statistical patterns and benefits from transferable physical representations. Under the Hebei→Stanford setting, PhysTrans reaches the lowest MAE of 0.379, which may be attributed to the relatively similar solar geometric conditions between the two regions. The relatively weak performance of TL-PatchTST suggests that transfer models relying heavily on sufficient adaptation data may be less suitable for strict zero-shot transfer.
5.5 Ablation Experiments
We ablate all the key modules proposed in PhysTrans to verify the contribution of each module on the cross-site transfer task. The results are shown in Table 2.
| Method | MAE | MSE |
|---|---|---|
| Base | 0.565 | 0.654 |
| Base + Phys | 0.537 | 0.631 |
| Base + Static ROI | 0.553 | 0.651 |
| Base + Dynamic ROI | 0.541 | 0.601 |
| Base + Dynamic ROI + ASA | 0.53 | 0.614 |
| PhysTrans | 0.517 | 0.623 |
Overall, the ablation results verify the effectiveness of the key components in PhysTrans. Compared with the Base model, adding the physics-aware consistency module reduces MAE from 0.565 to 0.537 and MSE from 0.654 to 0.631, indicating that the physical prior provides a stable constraint for cross-site transfer under data scarcity. In addition, the dynamic ROI cropping mechanism improves the modeling of real cloud-shadow variations. Compared with Static ROI, Dynamic ROI reduces MAE from 0.553 to 0.541 and MSE from 0.651 to 0.601, showing that geometry-guided cloud cropping can select more relevant cloud regions for PV power prediction. After introducing asynchronous semantic alignment, MAE is further reduced from 0.541 to 0.530, which indicates that the query-driven fusion mechanism improves the alignment between satellite cloud observations and power timestamps. The full PhysTrans achieves the best MAE of 0.517, confirming that the physics-aware constraint, dynamic ROI cropping, and asynchronous fusion are complementary.
It is worth noting that the MSE trend is not strictly monotonic. This is because MSE is more sensitive to a small number of large errors, which may occur under abrupt cloud evolution or difficult cloud-power alignment. Thus, the ablation results mainly show that each module contributes to reducing the average prediction error, while tail-error robustness under complex weather conditions remains an aspect for further improvement.
5.6 Physical Consistency Validation
To further evaluate the ability of our model to express physical principles, we add irradiance prediction as an auxiliary experiment, and the GHI in the output results is visually analyzed while keeping the input data and time window unchanged. The experimental results are shown in Fig. 4.
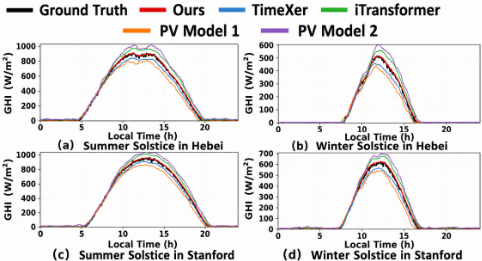
We select summer and winter solstices as representative cases of extreme solar geometric conditions. We observe significant differences in GHI curves during the summer solstice and winter solstice periods, with a 40% difference in the maximum GHI values on the same day between the two locations, which is consistent with changes in the solar geometric position. Comparing the irradiance curves of Stanford and Hebei on summer solstice days, it can be seen that the sunshine duration on both summer solstice days is 15 hours, which may be related to the similarity in latitude and solar radiation trajectory between the two places. In addition, other models still have non-zero GHI prediction values at night. Our model's prediction results fit well with the real GHI curve, indicating that it not only grasps the patterns at the data level, but also captures physical information related to seasonal changes in solar position.
| Method | Stanford→Yunnan | Hebei →Yunnan |
|---|---|---|
| Ours | 0.787 | 0.785 |
| TL-PatchTST | 2.624 | 4.485 |
| DRFN | 2.944 | 2.623 |
| MCloudNet | 0.849 | 0.822 |
| TimeXer | 0.878 | 0.834 |
| iTransformer | 0.933 | 0.915 |
| PatchTST | 0.914 | 0.803 |
5.7 Few-Shot Cross-Site Transfer Experiment
To further evaluate the prediction ability of PhysTrans in real application scenarios in newly commissioned PV plants, we design a few-shot transfer adaptation experiment. We take the transfer model trained in other sites as the initial model, and use the early three months of data from the target site for further training, then we evaluate it on the target site. The specific experimental results are shown in the Table 3, and it can be seen that our model shows good prediction ability with a small amount of data, and shows strong generalization ability across the sites in different regions. In contrast, the timeseries models are difficult to learn the relationships among sites, and are susceptible to the interference caused by the site differences, which makes it difficult to learn the transferable relationships. By introducing physical constraints, our model can capture cross-site correlations and provide reliable prediction results under limited data, which can support the cold-start PV plants.
5.8 Prediction Length Sensitivity Analysis
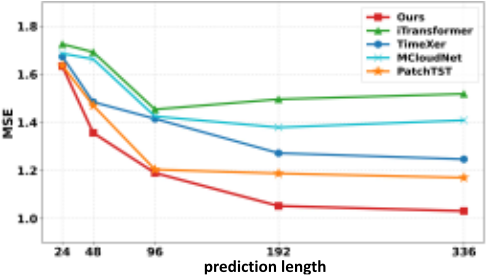
To analyze the sensitivity of PhysTrans to different prediction horizons, we evaluate five prediction lengths: 24, 48, 96, 192, and 336, while keeping other settings unchanged. As shown in Figure 5, our model performs well at different prediction lengths. It can be seen that the model can still achieve high accuracy in short-term predictions with limited data, indicating that physical information constraints help the model converge quickly. At the same time, due to our model's ability to capture real physical field information, it can maintain stability even under longer prediction window lengths, avoiding prediction fluctuations caused by data disturbances.
6 Deployment and Social Impact
6.1 Stakeholder Collaboration &Real Deployment
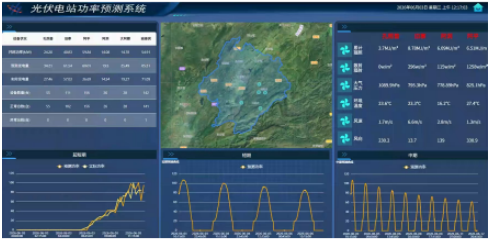
This work was conducted in collaboration with power system engineers, operational decision-makers from newly commissioned PV plants, and domain experts in power system research. Through practical deployment discussions, stakeholders identified cold-start forecasting as a critical challenge in early-stage PV operation, where limited historical data makes conventional data-driven models difficult to use reliably. As shown in Figure 6, PhysTrans has been integrated into the short-term forecasting workflow of more than ten newly commissioned PV plants in Yunnan, China. In these scenarios, the model supports short-term power forecasting during the cold-start phase, when only limited local measurements are available. The deployment pipeline is also compatible with Hygon GPU resources for real-world usage. Compared with conventional forecasting models that rely heavily on target-site histories, PhysTrans can provide more stable predictions by combining transferable physical priors, geometry-guided cloud information, and limited target-site observations. In real-world dispatch, improved cold-start forecasting can reduce forecast deviation energy and provide more reliable references for grid operation. For a representative PV plant with an installed capacity of 500 MW and an annual generation of about 1.0 TWh, if the cold-start forecast deviation energy accounts for about 10% of the annual generation, the observed accuracy improvement of PhysTrans corresponds to a conservative reduction of approximately 10,000 MWh deviation energy per plant per year. This estimate is used to illustrate the potential dispatch value of improved cold-start forecasting, rather than a fixed guaranteed benefit for all PV plants.
6.2 Social Impact
The rapid expansion of PV power has created an increasing demand for forecasting models that can be reliably deployed immediately after new PV plants are commissioned. By 2024, global cumulative PV capacity had exceeded 2.2 TW, with over 480 GW of new installations added in a single year [Sim et al., 2025]. Meanwhile, more than 600 GW
of new PV capacity was installed globally in 2024, with at least 34 countries each adding over 1 GW [Joshi et al., 2025]. These trends indicate that cold-start forecasting is a common challenge for newly built PV plants worldwide.
PhysTrans addresses this challenge by reducing the dependence on long target-site historical records. More accurate cold-start forecasting can reduce forecast deviation energy, support safer grid dispatch, increase PV utilization, and decrease the need for fossil-fuel backup generation. By combining physical priors, satellite cloud observations, and limited target-site measurements, PhysTrans provides a practical solution for early-stage PV operation. Through open-source models and datasets, this work further supports broader research and practical adoption, contributing to renewable energy integration and global climate mitigation goals.
7 Conclusion
This paper introduces PhysTrans, a physics-aware transferable framework for cold-start PV forecasting with limited historical data. By combining a lightweight clear-sky physical prior, geometry-guided dynamic ROI cropping, and querydriven asymmetric multimodal fusion, PhysTrans reduces the dependence on long target-site histories and improves the physical consistency of PV power prediction. The dynamic ROI strategy aligns satellite cloud observations with the solar illumination path, while the asymmetric fusion module handles the different sampling intervals between cloud images and PV measurements.
Experiments on Stanford, Hebei, and Yunnan datasets demonstrate that PhysTrans achieves consistent improvements in single-site forecasting, zero-shot cross-site transfer, and few-shot target-site adaptation. Despite its effectiveness, PhysTrans still relies on valid geostationary satellite coverage, and abrupt cloud evolution or heavy rainfall may introduce tail errors under difficult weather conditions. Future work will improve cloud-motion modeling, enhance robustness under extreme weather, and extend PhysTrans as a plugin module for broader PV forecasting backbones.
Ethical Statement
There are no ethical issues.
Acknowledgements
This research is supported by the National Key Research and Development Program of China (Grant No.2024YFB4506000). We also thank the VenusAI platform (http://data.aicnic.cn) and technical support teams for providing NVIDIA and Hygon GPU resources for model evaluation.
Contribution Statement
† Equal contribution, ∗ Corresponding author.
@inproceedings{ijcai2026p830,
  title     = {PhysTrans: A Physics-Aware Transferable Framework for Global Cold-Start Photovoltaic Forecasting},
  author    = {Wan, Meng and Gao, Kaipeng and Wang, Jue and Fang, Siyan and Miao, Xue and Zhang, Pufen and Chang, Sijie and Shi, Peng and Wang, Yangang and Zhao, Zhenbing},
  booktitle = {Proceedings of the Thirty-Fifth International Joint Conference on
               Artificial Intelligence, {IJCAI-26}},
  publisher = {International Joint Conferences on Artificial Intelligence Organization},
  editor    = {Diego Calvanese},
  pages     = {7464--7473},
  year      = {2026},
  month     = {8},
  note      = {AI and Social Good},
  doi       = {10.24963/ijcai.2026/830},
  url       = {https://doi.org/10.24963/ijcai.2026/830},
}
TY - CPAPER TI - PhysTrans: A Physics-Aware Transferable Framework for Global Cold-Start Photovoltaic Forecasting AU - Wan, Meng AU - Gao, Kaipeng AU - Wang, Jue AU - Fang, Siyan AU - Miao, Xue AU - Zhang, Pufen AU - Chang, Sijie AU - Shi, Peng AU - Wang, Yangang AU - Zhao, Zhenbing T2 - Proceedings of the Thirty-Fifth International Joint Conference on Artificial Intelligence, IJCAI-26 PB - International Joint Conferences on Artificial Intelligence Organization PY - 2026 SP - 7464 EP - 7473 DO - 10.24963/ijcai.2026/830 UR - https://doi.org/10.24963/ijcai.2026/830 ER -Copied
Machine-readable versions of this paper, for tools and AI agents:





