
Scalable Mapping of Tree Traits to Study the Dynamics of Protected Forest Areas in India
Proceedings of the Thirty-Fifth International Joint Conference on Artificial Intelligence. AI and Social Good. Pages 7174-7182.
https://doi.org/10.24963/ijcai.2026/798
Keywords
- Multidisciplinary Topics and Applications: Multidisciplinary Topics and Applications
- Humans and AI: Humans and AI
- Machine Learning: Machine Learning
Abstract
Monitoring forest functional diversity is essential to understand ecosystem resilience in the face of rapid environmental change. While existing remote sensing approaches primarily track structural attributes such as canopy density and tree height, functional traits like leaf phenology (evergreen vs. deciduous) and leaf type (broadleaf vs. needleleaf) reveal more direct information about adaptive strategies of tree species. This study presents a scalable machine learning framework for mapping these traits across India at 10 m resolution using Google AlphaEarth Foundations (AEF) embeddings, which capture the complete annual spectral reflectance and radar signatures of the land surface. A key contribution we make is to curate an ML-ready training dataset by combining tree traits information with tree species occurrence data, and to obtain a diverse sample from this data based on spectral time-series to ensure the dataset captures a wide range of phenological dynamics. We then build cross-validation folds to specifically test for spatial generalizability across different eco-regions in India and temporal generalizability across different years, for classifiers learned from the data. Multiple classifiers are evaluated: Random Forest models trained on AEF embedding features achieved the best performance for both classification tasks, outperforming models trained on conventional Sentinel-1 and Sentinel-2 time series while offering seamless deployment in Google Earth Engine. Compared to publicly available land-cover products that encode leaf phenology and leaf type, our model yields significantly higher accuracy while providing outputs at substantially finer spatial resolution. We then observe the outputs of our model over several protected forest areas in India to understand their dynamics over the last 8 years. Our contribution is an analysis-ready open dataset to learn tree traits from remote sensed spectral data, a trained model that is spatially and temporally generalizable, and a demonstration of the insights the model can provide to understand the dynamics of protected forest areas, all of which can be replicated in other areas.
- [Amiri et al., 2025] Afshin Amiri, Keyvan Soltani, Sil- vio Jose Gumiere, and Hossein Bonakdari. Forest fires under the lens: needleleaf index -a novel tool for satellite image analysis. npj Natural Hazards, 2(9), 2025.
- [Arevalo et al., 2022] P. Arevalo, R. Stanimirova, E. Bul- lock, Y. Zhang, K. Tarrio, K. Turlej, K.-T. Hu, K. McAvoy, V. Pasquarella, C. Woodcock, P. Olofsson, Z. Zhu, N. Gorelick, T. Loveland, C. Barber, and M. Friedl. Global land cover mapping and estimation yearly 30 m v001 [data set], 2022. NASA Land Processes Distributed Active Archive Center. [Date Accessed: 2026-11-24].
- [Auber et al., 2022] Arnaud Auber, Conor Waldock, An- thony Maire, Eric Goberville, Camille Albouy, Adam C. Algar, Matthew McLean, Anik Brind'Amour, Alison L. Green, Mark Tupper, Laurent Vigliola, Kristin Kaschner, Kathleen Kesner-Reyes, Maria Beger, Jerry Tjiputra, Aurèle Toussaint, Cyrille Violle, Nicolas Mouquet, Wil- fried Thuiller, and David Mouillot. A functional vulner- ability framework for biodiversity conservation. Nature Communications, 13, 2022.
- [Bansal et al., 2026] Chahat Bansal, Ananjan Nandi, Bal- akumaran Ramachandran, Craig Dsouza, Divyansh Mit- tal, Eashan Bajaj, Raman Kumar, Sachit Sachdeva, Saketh Vishnubhatla, Vatsal Agarwal, and Aaditeshwar Seth. Be- yond flat classifiers: Practical methodologies for region- ally accurate and relevant land use and land cover classi- fication using landsat and sentinel data. ACM J. Comput. Sustain. Soc., 2026.
- [Biswas et al., 2025] Nayantara Biswas, Vishal Sadekar, Siddharth Biniwale, Yukti Taneja, Anand Osuri, Navendu Page, Kulbhushansingh Suryawanshi, and Rohit Nani- wadekar. Chronic disturbance and climate water deficit shift tree communities from tropical evergreen to decid- uous in the western ghats, india. Journal of Vegetation Science, 36, 2025.
- [Brown et al., 2022] Christopher F. Brown, Steven P. Brumby, Brookie Guzder-Williams, Tanya Birch, Samantha Brooks Hyde, Joseph Mazzariello, Wanda Czerwinski, Valerie J. Pasquarella, Robert Haertel, Simon Ilyushchenko, Kurt Schwehr, Mikaela Weisse, Fred Stolle, Craig Hanson, Oliver Guinan, Rebecca Moore, and Alexander M. Tait. Dynamic world, near real-time global 10m land use land cover mapping. Sci Data, 9(251), 2022.
- [Brown et al., 2025] Christopher F. Brown, Michal R. Kazmierski, Valerie J. Pasquarella, William J. Rucklidge, Masha Samsikova, Chenhui Zhang, Evan Shelhamer, Estefania Lahera, Olivia Wiles, Simon Ilyushchenko, Noel Gorelick, Lihui Lydia Zhang, Sophia Alj, Emily Schechter, Sean Askay, Oliver Guinan, Rebecca Moore, Alexis Boukouvalas, and Pushmeet Kohli. Alphaearth foundations: An embedding field model for accurate and efficient global mapping from sparse label data, 2025.
- [Dash et al., 2010] J. Dash, C. Jeganathan, and P.M. Atkin- son. The use of meris terrestrial chlorophyll index to study spatio-temporal variation in vegetation phenology over in- dia. Remote Sensing of Environment, 114(7):1388-1402, 2010.
- [Defourny et al., 2017] P. Defourny, C. Lamarche, S. Bon- temps, T. De Maet, E. Van Bogaert, I. Moreau, C. Brock- mann, M. Boettcher, G. Kirches, J. Wevers, M. Santoro, F. Ramoino, and O. Arino. Land cover climate change initiative -product user guide version 2.0, 2017. [Date Accessed: 2025-11-24].
- [Dostálová et al., 2021] Alena Dostálová, Mait Lang, Janis Ivanovs, Lars T. Waser, and Wolfgang Wagner. European wide forest classification based on sentinel-1 data. Remote Sensing, 13(3), 2021.
- [Feng et al., 2025] Zhengpeng Feng, Clement Atzberger, Sadiq Jaffer, Jovana Knezevic, Silja Sormunen, Robin Young, Madeline C. Lisaius, Markus Immitzer, Toby Jack- son, James Ball, David A. Coomes, Anil Madhavapeddy, Andrew Blake, and Srinivasan Keshav. Tessera: Temporal embeddings of surface spectra for earth representation and analysis, 2025.
- [Friedl and Sulla-Menashe, 2022] Mark Friedl and Damien Sulla-Menashe. Modis/terra+aqua land cover type yearly l3 global 500m sin grid v061, 2022. NASA Land Pro- cesses Distributed Active Archive Center [Date Accessed: 2026-01-13].
- [Goyal et al., 2025] Dhruvi Goyal, Harsh Singh Chauhan, and Aaditeshwar Seth. Scalable monitoring of tree canopy density and height in india at high spatial resolutions. In Proceedings of the 13th International Conference on In- formation & Communication Technologies and Develop- ment, page 16-47, New York, NY, USA, 2025. Associa- tion for Computing Machinery.
- [Grabska-Szwagrzyk and Tymińska-Czabańska, 2023] Ewa Grabska-Szwagrzyk and Luiza Tymińska-Czabańska. Sentinel-2 time series: a promising tool in monitoring temperate species spring phenology. Forestry: An In- ternational Journal of Forest Research, 97(2):267-281, 2023.
- [Harris et al., 2019] N. Harris, E. D. Goldman, and S. Gibbes. Spatial database of planted trees (sdpt version 1.0), 2019. Technical Note.
- [Hofinger et al., 2025] Peter Hofinger, Jan Dempewolf, Si- mon Ecke, and Hans-Joachim Klemmt. Temporal general- ization in evergreen leaf type classification using tailored sentinel-2 composites. Ecological Informatics, 89:103167, 2025.
- [Huntington, 2000] Henry P. Huntington. Using traditional ecological knowledge in science: Methods and applica- tions. Ecological Applications -ECOL APPL, 10:1270- 1274, 10 2000.
- [Klemmer et al., 2024] Konstantin Klemmer, Esther Rolf, Caleb Robinson, Lester Mackey, and Marc Rußwurm. Sat- clip: Global, general-purpose location embeddings with satellite imagery, 2024.
- [Li et al., 2023] Rumeng Li, Haoming Xia, Xiaoyang Zhao, and Yan Guo. Mapping evergreen forests using new phe- nology index, time series sentinel-1/2 and google earth en- gine. Ecological Indicators, 149:110157, 2023.
- [Liu et al., 2023] Liangyun Liu, Xiao Zhang, and Tingting Zhao. Glc fcs30d: the first global 30-m land-cover dy- namic monitoring product with fine classification system from 1985 to 2022 [data set], 2023. Zenodo.
- [Louis et al., 2019] Jérôme Louis, Bringfried Pflug, Mag- dalena Main-Knorn, Vincent Debaecker, Uwe Mueller- Wilm, Rosario Quirino Iannone, Enrico Giuseppe Cadau, Valentina Boccia, and Ferran Gascon. Sentinel-2 global surface reflectance level-2a product generated with sen2cor. In IGARSS 2019 -2019 IEEE International Geoscience and Remote Sensing Symposium, pages 8522- 8525, 2019.
- [Masek et al., 2020] Jeffrey G. Masek, Michael A. Wulder, Brian Markham, Joel McCorkel, Christopher J. Crawford, James Storey, and Del T. Jenstrom. Landsat 9: Empower- ing open science and applications through continuity. Re- mote Sensing of Environment, 248:111968, 2020.
- [Maynard et al., 2022] Daniel S. Maynard, Lalasia Bialic- Murphy, Constantin M. Zohner, Colin Averill, Johan van den Hoogen, Haozhi Ma, Lidong Mo, Gabriel Reuben Smith, Alicia T. R. Acosta, Isabelle Aubin, Erika Berenguer, Coline C. F. Boonman, Jane A. Catford, Bruno E. L. Cerabolini, Arildo S. Dias, Andrés González- Melo, Peter Hietz, Christopher H. Lusk, Akira S. Mori, Ülo Niinemets, Valério D. Pillar, Bruno X. Pinho, Juli- eta A. Rosell, Frank M. Schurr, Serge N. Sheremetev, Ana Carolina da Silva, Ênio Sosinski, Peter M. van Bode- gom, Evan Weiher, Gerhard Bönisch, Jens Kattge, and Thomas W. Crowther. Global relationships in tree func- tional traits. Nature Communications, 13, 2022.
- [Mehta et al., 2025] Shivani A Mehta, Aila Dutt, Ajay Tan- nirkulam, Akshay Pratap Singh, Aman Verma, Anamitra Singha, Ananda Sreenidhi, Ananjan Nandi, Ankit, Ankit Kumar, Atharv Dabli, Athira P, Balakumaran Ramachan- dran, Chahat Bansal, Chintan Sanjaybhai Sheth, Craig Dsouza, Deepak Kumar, Dharmisha Sharma, Harshita, Jaskaran Singh, Kapil Dadheech, Ksheetiz Agrahari, Om Krishna, Pooja Prasad, Priyadarshini Radhakrish- nan, Ramita Sardana, Rittwick Bhabak, Ruptirumal Sai Bodavula, Saketh Vishnubhatla, Samitha Haldar, Sanjali Agrawal, Shiv Prakash Maurya, Shruti Kumari, Siddharth S, Sukriti Kumari, Vishnu S, and Aaditeshwar Seth. Ini- tial observations from field testing of a digital participa- tory tool to improve water security in rural india. In Pro- ceedings of the 13th International Conference on Infor- mation & Communication Technologies and Development, page 337-364, New York, NY, USA, 2025. Association for Computing Machinery. [Oguiza, 2023] Ignacio Oguiza. tsai -a state-of-the-art deep learning library for time series and sequential data. Github, 2023. https://github.com/timeseriesAI/tsai [Date Accessed: 2025-10-10]. Link
- [Protected-Areas, 2026] Protected-Areas, 2026.
- In- dian Protected Areas GEE Application https://ee- aaditeshwar.projects.earthengine.app/view/protected- areas [Date Accessed: 2026-01-10]). Link
- [Reddy et al., 2015] Chintala Sudhakar Reddy, Chandra Jha, P. Diwakar, and Vinay Dadhwal. Nationwide classifica- tion of forest types of india using remote sensing and gis. Environmental Monitoring and Assessment, 187, 11 2015.
- [Richardson et al., 2024] Sarah B. Richardson, Lauralee An, Sarah E. Pollack, Hemalatha Velappan, Ruth Nogueron, Jessica Richter, Shelley L. Gardner, Karen L. Williams, John C. Hermanson, Elizabeth Dow Goldman, and Suzanne M. Peyer. Global planted forest data for timber species. Scientific Data, 11, 2024.
- [Schulz et al., 2024] Christian Schulz, Michael Förster, Stenka Valentinova Vulova, Alby Duarte Rocha, and Birgit Kleinschmit. Spectral-temporal traits in sentinel-1 c-band sar and sentinel-2 multispectral remote sensing time series for 61 tree species in central europe. Remote Sensing of Environment, 307:114162, 2024.
- [Torres et al., 2012] Ramón Torres, Paul Snoeij, Malcolm Davidson, David Bibby, and Svein Lokas. The sentinel-1 mission and its application capabilities. In 2012 IEEE In- ternational Geoscience and Remote Sensing Symposium, pages 1703-1706, 2012.
- [Tseng et al., 2024] Gabriel Tseng, Ruben Cartuyvels, Ivan Zvonkov, Mirali Purohit, David Rolnick, and Hannah Kerner. Lightweight, pre-trained transformers for remote sensing timeseries, 2024.
- [UNEP-WCMC and IUCN, 2025] UNEP-WCMC and IUCN. Protected planet: The world database on protected areas (wdpa) [on-line], 2025. Cambridge, UK: UNEP- WCMC and IUCN Available at: www.protectedplanet.net. [Date Accessed: 2025-12-30].
- [Van Tiel et al., 2021] Nina Van Tiel, Lisha Lyu, Fabian Fopp, Philipp Brun, Johan van den Hoogen, Dirk Nikolaus Karger, Niklaus E. Zimmermann, Thomas W. Crowther, and Loïc Pellissier. Mapping tree species for restoration potential resilient to climate change. bioRxiv, 2021.
- [Vermeulen et al., 2025] L M Vermeulen, C Wigley- Coetsee, B Verbist, K Van Meerbeek, J Slingsby, P N Bernardino, and B Somers. Integrating remote sensing, expert knowledge, and field data can accurately identify and prioritise ecosystem shifts in semi-arid savannas. Environmental Research Communications, 2025.
- [Wang et al., 2025] Xi Wang, Songchao Chen, Chang Zhou, Si-Bo Duan, and Zhou Shi. Cross-sensor data reconstruc- tion for optical remote sensing gap-filling with attention- enhanced multi-scale fusion network. International Jour- nal of Applied Earth Observation and Geoinformation, 140:104571, 2025.
References were extracted automatically from the PDF and may contain errors.
Full text extracted automatically from the PDF; figures, tables and equations may differ. The PDF is the version of record.
1 Introduction
Tree functional traits describe key structural, physiological, and phenological characteristics of vegetation that govern ecosystem processes, biodiversity patterns, and climate-biosphere interactions. Among these, leaf phenology (evergreen or deciduous) and leaf type (broadleaf or needleleaf) are two first-order traits that strongly influence photosynthetic seasonality, carbon and water fluxes, nutrient cycling, habitat suitability, and ecosystem resilience [GrabskaSzwagrzyk and Tymi´nska-Czaba´nska, 2023]. Mapping tree traits at high spatial resolution is critical for biodiversity assessment, ecological monitoring, and forest management. Tracking their changes over time can reveal climate-induced stress, disturbance recovery, invasive species spread, and the effectiveness of restoration interventions [Biswas et al., 2025]. Together with structural traits such as canopy density and canopy height, they provide critical inputs for estimating functional diversity, which is increasingly used to assess ecosystem stability, vulnerability to climate extremes, and conservation effectiveness [Auber et al., 2022].
This work was co-defined with the Foundation for Ecological Security, Ashoka Trust for Research in Ecology and the Environment and Auroville Botanical Gardens, who are actively engaged in community-led Natural Resource Management (NRM) conservation and restoration initiatives. The need for scalable tree traits monitoring was identified to be a key focus area in forest conservation, as it helps in detecting invasive species, carbon sequestration assessment and identifying forest fires. While field-based trait measurements are ecologically rich, they are sparse, resource-intensive, expensive, and difficult to scale [Huntington, 2000]. Open-source satellites, such as Landsat and Sentinel-1/2, provide a scalable alternative that is widely used to infer phenology, forest types, and canopy properties [Vermeulen et al., 2025; Masek et al., 2020; Louis et al., 2019; Torres et al., 2012]. However, modeling traits directly from raw multi-band time series remains challenging due to cloud contamination, missing observations, sensor noise, and spatial-temporal autocorrelation, which can inflate performance estimates under conventional random sampling [Wang et al., 2025].
Recent geospatial foundation models, such as AEF, TESSERA, SatCLIP and PRESTO products, offer compact, information-rich embeddings trained via self-supervised learning on petabytes of Earth observation data [Brown et al.,
2025; Feng et al., 2025; Klemmer et al., 2024; Tseng et al., 2024]. These embeddings encode spatio-temporal dynamics while reducing noise from clouds, acquisition gaps, and sitespecific artifacts. Our study leverages open-source AEF embeddings, available annually at 10 m resolution, showing that latent representations outperform raw spectral time series in discerning subtle phenological signatures at scale.
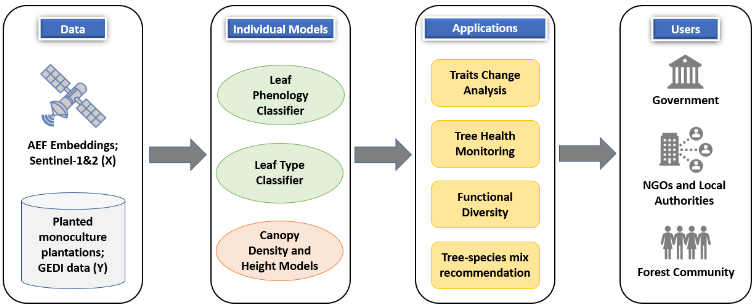
Beyond phenology and leaf type, other tree traits, such as canopy density and height, can also be estimated from satellite data, enabling integrated assessment of forest structure, function and health. While this study focuses on phenology and leaf type classifiers, the methodology is extensible to other structural traits. We combine trait models with an existing open-source product for canopy density and height to perform comprehensive change analysis across protected areas in India. The comprehensive framework for tree trait modeling using satellite data and its downstream applications is depicted in Figure 1. Large-scale, granular traits mapping helps government, NGOs, and forest communities monitor tree health and tree traits changes over time, enabling better decisions for restoration and planting appropriate species-mix selection [Maynard et al., 2022; Van Tiel et al., 2021]. Year-on-year traits tracking is key to understanding climate change impact (e.g., droughts, fires) on changing forest composition, while also supporting monitoring of conservation initiatives and dashboard development for forest beats and administrative boundaries.
Our main contributions in this paper are as follows:
- A curated training dataset with time-series-based sampling to capture phenological diversity, and crossvalidation splits to assess spatial and temporal generalizability.
- Spatio-temporally robust and scalable models for leaf phenology and leaf type classification at 10 m resolution using AEF embeddings.
- Application of the framework to analyze trait changes (2018-2023) in protected areas in India, demonstrating the utility of the models to monitor forest dynamics.
Although the empirical analysis presented here focuses on India, the methodology is globally applicable where satellite embeddings and ground truth are available. The curated data, code, models, and outputs are openly available at https://github.com/Dhruvi-Goyal/Tree-Traits-Classification/.
This work was developed within the CoRE stack initiative 1 , a digital public infrastructure being built to support community-led natural resource management through open geospatial tools and decision-support systems. Products on water security to provide decision support insights for the construction of drought-proofing water infrastructure are already in use in several hundred villages to build ground-up village development plans that are put up for funding to relevant government departments [Mehta et al., 2025]. Our outputs will be integrated into CoRE stack Android and Google Earth Engine (GEE) applications, enabling CSOs, NGOs, government agencies, and field practitioners to monitor tree traits, forest health, biodiversity, and water-related outputs in different forest landscapes and prioritize the right interventions. Prior outputs are already helping track changes in canopy density and tree height for over 500 protected areas in India [Protected-Areas, 2026]. Several organizations and government bodies have expressed interest in adopting these outputs for long-term ecological monitoring and planning.
1 https://core-stack.org/
2 Literature Review
Satellite remote-sensing studies have long used spectral indices and time series to distinguish forest phenology and leaf type. Multi-year NDVI/EVI time series from MODIS and Sentinel-2 reveal seasonal greenness cycles: deciduous trees show dip in greenness during leaf shed, while evergreen trees maintain high NDVI/EVI year-round. [Dash et al., 2010] used the MERIS Terrestrial Chlorophyll Index time-series data at 4.6 km resolution across India's forests, finding a strong coincidence of observed phenological patterns with known tropical vegetation types. [Li et al., 2023] proposed an NDVI-based phenology index to distinguish evergreen and deciduous forests at 10 m resolution in China. [Schulz et al., 2024] showed that the Radar Vegetation Index from Sentinel1 is sensitive to confier crowns, aiding needleleaf discrimination. [Amiri et al., 2025] developed a Landsat-based needleleaf index for boreal coniferous forests at 30 m resolution.
Despite these advances, pure index-threshold methods often require huge efforts in fine-tuning and can struggle in generalizing across large landscapes and complex terrain. To improve robustness, recent works apply machine learning (ML) on multi-temporal data. [Hofinger et al., 2025] showcased ELMClassifier trained on multi-year Sentinel-2 data performs best in segregating evergreen and deciduous trees with 83.9% accuracy in Bavaria's forest reserves. Similarly, [Dost´alov´a et al., 2021] built Europe-wide forest maps using multi-temporal Sentinel-1 seasonality data at 20 m resolution to classify forest pixels as coniferous or broadleaf. A variety of classic and advanced ML classifiers have been tested on input features ranging from annual index profiles to wavelet-smoothed curves. Overall, the ML studies report that Sentinel-2 and Sentinel-1 stacks provide enough signal to predict leaf phenology and type in different forest landscapes across the globe. Moreover, most classifiers have been trained on raw reflectance or index time series, which struggle with missing data due to cloud cover, data quality issues, etc. and heterogeneity. LiDAR based methods can also detect tree traits at granular resolution, but they are usually proprietary, expensive, and confined to a smaller region. Recent work shows that learned embeddings from satellite data can overcome some limitations. Google's AEF produces annual 10 m embeddings by integrating optical, SAR, LiDAR, climate, and other data sources capturing temporal and ecological information well [Brown et al., 2025]. Our work leverages AEF embeddings for trait classification tasks and compares them against use of raw Sentinel time-series data at 10 m resolution. Our analysis shows that embeddings can work well in capturing leaf phenology and type signals.
Several global or regional land-cover maps exist that implicitly encode leaf phenology or type, but none at high spatial detail. The MODIS Land Cover Type product classifies forests into different types (eg: Evergreen Needleleaf, Deciduous Broadleaf, etc.) at 500 m resolution annually [Friedl and Sulla-Menashe, 2022]. Likewise, ESA's Climate Change Initiative (CCI) Land Cover project produces fractional Plant Functional Type (PFT) maps at 300 m resolution, that give the dominant tree-type per pixel [Defourny et al., 2017]. The Copernicus High-Resolution Layers for Europe also include a Dominant Leaf Type (broadleaf vs conifer) layer at 10 m. Global datasets like GLanCE by NASA at 30 m resolution provide annual land cover categories using Landsat time series between 2001-2019 [Arevalo et al., 2022]. Currently, GLanCE output maps are not available for Asia though. GLC FCS30D dataset provides annual land cover information across the globe at 30 m resolution, which also has different types of forest classes within it [Liu et al., 2023]. At a national scale, Reddy et al. released a 5 km forest-type map of India with 14 classes (tropical evergreen, moist deciduous, temperate conifers, etc.) based on multi-season Resourcesat2 Advanced Wide Field Sensor imagery [Reddy et al., 2015]. The map is however a static map and cannot be used to study functional diversity changes in different forests across the country. Currently, therefore, there are no publicly available datasets that highlight leaf phenology and leaf type information at a 10 m resolution, especially in India. Additionally, most of the land cover products publicly available are modeled using raw time-series satellite data, and we show that modeling based on AEF embeddings performs better compared to raw time-series based-data, and can be adopted to complex noisy environment.
3 Methodology
We used the GEE 2 platform for satellite data gathering, processing, and modeling. Monoculture tree species polygons from the publicly available Planted dataset [Richardson et al., 2024] were used as ground truth for training leaf phenology and leaf type classifiers. Models were trained on 2022-2023 data and evaluated on spatially distinct polygons from 2021 to assess spatio-temporal robustness. Although demonstrated for India, the proposed framework is robust enough to be adopted anywhere globally. The following sub-sections describe the datasets and modeling pipeline used for both classification tasks.
2 https://earthengine.google.com/
3.1 Data Acquisition
Google AlphaEarth Foundations (AEF) Embeddings
We use Google's AEF Satellite Embedding dataset [Brown et al., 2025] as the primary input feature set for leaf phenology and leaf type classification at 10 m spatial resolution. AEF is a geospatial foundation model trained on multi-sensor data (optical, SAR, topography, climate variables), producing annual 64-dimensional embeddings per 10 m pixel that compress the full intra-annual signal into a latent representation. Annual embeddings between 2017-2024 were accessed via GEE as analysis-ready rasters, enabling direct sampling over training polygons and large-scale inference.
Planted Forest Timber Data (PFTD) Polygons
Ground-truth labels were derived from the PFTD dataset [Richardson et al., 2024], which aggregates and standardizes planted forest boundaries from multiple sources, including the Spatial Database of Planted Trees [Harris et al., 2019], research literature, and government and non-profit organizations. We restricted the analysis to monoculture plantation polygons with known dominant species, allowing unambiguous assignment of leaf phenology (evergreen or deciduous) and leaf type (broadleaf or needleleaf) classes based on established botanical knowledge of species characteristics in India. The dataset consists of 870,260 monoculture plantation polygons of 15 tree species, spanning 60,347 km2 across India. Models are trained on 10 m pixel-level data rather than training at polygon-level, as 10 m pixels in natural forests typically contain 1-2 trees, allowing the model to learn and produce correct predominant traits at fine scale. Polygons are sampled across multiple Indian eco-regions to promote spatio-temporal robustness. AEF data is extracted for all tree pixels within sampled polygons, producing a large, spatially distributed labeled dataset for model training and evaluation. Table 1 summarizes the total samples (train + validation + test) per class across eco-regions for 2022-2023.
| Class | 2022 #Samples | #ERs | 2023 #Samples | #ERs |
|---|---|---|---|---|
| Evergreen | 65,331 | 24 | 64,405 | 22 |
| Deciduous | 66,993 | 27 | 62,743 | 26 |
| Broadleaf | 104,280 | 28 | 105,050 | 27 |
| Needleleaf | 104,179 | 23 | 105,151 | 23 |
Sentinel-1&2 Data
To benchmark the performance of AEF against conventional remote sensing inputs, additional models were trained using Sentinel-1 and Sentinel-2A data. Sentinel-2 provides 10 m multispectral optical imagery suitable for capturing vegetation phenology and canopy greenness with a 5-day revisit period [Louis et al., 2019]. Sentinel-1 C-band SAR observations provide complementary information on canopy structure at 10 m with comparable revisit frequency [Torres et al., 2012]. Monthly median composite time-series of Sentinel1&2 were generated over the same polygons and time periods as the AEF data, following standard cloud masking and speckle filtering procedures.
3.2 Modeling
The overview of the modeling pipeline for both leaf phenology and leaf type is shown in Figure 2. First, the PFTD polygons data are randomly sampled from different tree species across distinct eco-regions. For each pixel of these sampled polygons, AEF embeddings and monthly median composites of Sentinel-1&2 data are obtained at 10 m for 2022 and 2023.
To obtain a sample from this data, random pixel-wise sampling or stratification based on administrative boundaries may not serve to draw samples that are truly representative of different phenological dynamics. We therefore built a clustering-based sampling approach, where we cluster different species polygons that exhibit similar signatures together and then sample the polygons from each cluster into training, validation, and test sets. This framework works because the clustering step groups trees with similar phenological or structural behaviour, regardless of their geographic proximity. For this, we perform constrained K-Means clustering on plantation polygons from 2022-2023, using polygon-level mean feature representations. For each polygon, pixel-level features are averaged to obtain a single representative vector, reducing within-polygon noise and computational complexity. The clustering is performed with a minimum of 5 polygons per cluster, as we would later need to split each cluster into 5-folds for training the models using a cross-validation approach. Clustering is performed separately for the two trait tasks: For leaf phenology, clustering is driven primarily by NDVI time-series statistics that capture seasonal amplitude and shape; For leaf type, clustering is performed in the AEF embedding feature space, which better captures structural and spectral cues. The optimal number of clusters is determined using the elbow method, with 30 clusters selected as a balance between intra-cluster homogeneity and a sufficient sample size per cluster. We tried different sampling methods, and the constrained K-Means clustering method outperformed other clustering methods as well as traditional random sampling and eco-region-wise sampling methods.
Once such diverse clusters are obtained, we split the polygons from each cluster into 5-folds such that each cluster has a balanced representation in each fold. Splitting the polygons rather than pixels ensures that the train-test split happens at distinct polygon levels. A 5-fold cross-validation approach is then used for training and evaluating different models. The train data is further split into training and validation sets, where validation data is used for fine-tuning the models' hyperparameters and convergence. The model's performance is tested on the held-out polygons of the respective folds.
We trained multiple supervised classifiers on the constructed folds, including classic ML (logistic regression, random forest, XGBoost, SVM) and deep learning models (InceptionTime, ResNet, XceptionTimePlus) [Oguiza, 2023]. Models are evaluated using accuracy, precision, recall and F1-score, with F1-score prioritized due to class imbalance.
Furthermore, to explicitly test spatio-temporal generalization, models trained on 2022-2023 polygons are evaluated on out-of-sample (OOS) polygons from 2021, which are excluded from all clustering and training steps. This evaluation assesses the ability of the models to generalize across both unseen locations and time periods. The final model for each task is selected based on the best F1-score on this OOS data.
For both the trait tasks, the Random Forest (RF) classifier trained on AEF embedding features consistently achieved the highest and most stable performance. The best-performing RF models are implemented and hosted on GEE. Feature extraction and inference are carried out directly within GEE, enabling scalable generation of trait maps for arbitrary regions and years from 2017 onwards at 10 m resolution. This deployment allows efficient large-area processing and forms the basis for downstream analyses of traits distribution, tree health, and temporal change across protected forest areas.
4 Results
4.1 Performance and Spatio-Temporal Robustness
We performed 5-fold cross-validation on 2022 and 2023 Planted polygons, where in each fold 1/5th of the polygons were used as test set and remaining 4/5th polygons were used for training. Across both trait-mapping tasks, RF consistently achieved the highest accuracy, F1-score, and stability across cross-validation folds among all the models, irrespective of the input dataset. Table 2 represents the best RF models' performance of Sentinel-1&2 and AEF embeddings on test data of 2022-2023 for both trait classification tasks. The train set had close to 100% accuracy and F1-score for all the cases. On the leaf phenology task, the Sentinel-1&2-based model performs better on test set, while on the leaf type task, the AEF-based model performs better. The best model is not just chosen based on the test set performance, but from the ability of the model to generalize spatio-temporally. To assess spatio-temporal generalization, the best-performing RF models for both trait tasks were evaluated on spatially distinct OOS polygons in 2021, representing distinct locations not used during model training. We further evaluated temporal robustness by evaluating the models' outputs to these OOS polygons from multiple years (2020-2023).
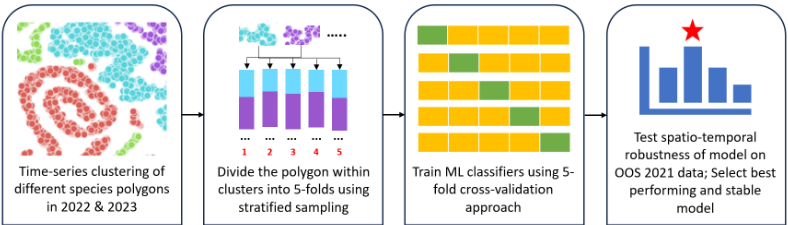
Table 2 reports year-wise performance metrics on OOS data from 2020 to 2023, for the best performing RF models trained on Sentinel-1&2 features and AEF embeddings. The AEF-based RF models clearly outperformed the Sentinel-based models on OOS data, with average gains of 22% in leaf phenology and 6% in leaf type classification tasks in overall accuracy and F1-score, indicating that the learned embeddings capture more discriminative information on tree traits than hand-crafted Sentinel features. Although the AEFmodel seems to underperform on the test set for leaf phenology, we can clearly see that it outperforms on the OOS dataset across all the years, which signifies that the AEF-models are spatio-temporally robust and much better than Sentinelmodels. The Sentinel-models perform better on the test set could be due to temporal overfitting. Additionally, the best deep learning classifier was XceptionTimePlus for both traits, with an average OOS F1-score of 93% for leaf phenology (2% worse than best RF) and 97% for leaf type (1% worse than best RF). Beyond predictive performance, RF with AEF embeddings was selected as the final model due to its robustness to noisy features, interpretability via feature importance, and native support for efficient deployment in GEE, enabling scalable inference of tree traits across India. Furthermore, AEF embeddings do not have missing data and capture stable, interpretable temporal signatures even in monsoon-heavy regions with sparse, cloudy acquisitions.
The AEF models' performance fluctuated between 0-7% for leaf phenology and 0-1% for leaf type across years, indicating that the embeddings and trained models are stable under interannual climate variability. The proportion of pixels that showed fluctuation in the models' outputs between consecutive years in 2020-2023 was low for both leaf phenology (0.69%) and leaf type (0.21%). To mitigate such fluctuations, we take the modal outputs of (year-1, year, year+1) for any given year, resulting in more stable outputs. These results suggest that the models are not overly sensitive to annual noise and that temporal changes in predicted traits reflect genuine ecological shifts rather than model instability.
4.2 Comparison with existing baseline methods
The proposed AEF-based trait maps were compared with publicly available land-use and land-cover (LULC) products that include leaf phenology and leaf type classes, specifically the Global Land Cover (GLC) product [Liu et al., 2023] and the ESA CCI land cover dataset [Defourny et al., 2017]. Evaluation was done on the same OOS-2021 polygons, which constituted 182,371 pixels of 10 m resolution, to ensure a consistent reference. We evaluated the other products at their respective resolutions. If these baseline datasets predicted a mixed leaf forest for a pixel, then we counted it as a correct prediction, giving leeway, irrespective of the ground-truth showing a clear distinction between evergreen/deciduous and broadleaf/needleleaf trees. Table 3 clearly depicts that our trained model achieved substantially higher accuracy than both baseline datasets. Additionally, our approach provides outputs at a much finer spatial resolution (10 m) compared to 30-300 m resolution of existing global products.
4.3 Traits Outputs in India
To illustrate the utility of the trait predictions in real landscapes, model outputs were examined for a set of well-studied forested areas from distinct parts of India. We did a preliminary analysis by manually geo-tagging 11 tree species in different parts of Sanjay Van and Indian Insitute of Technology Delhi, which predominantly have deciduous and broadleaf trees, with limited evergreen and needleleaf trees. The leaf type model had 100% accuracy, while the leaf phenology model had 80% accuracy.
In addition, we selected different forest areas that are known to have trees that belong almost entirely to a single trait class. For each site, trait maps from our developed models were generated at 10 m resolution for different years, and spatial patterns were visually compared with independent information on dominant tree species and forest types from published literature, management plans, and expert knowledge. Table 4 highlights ground information known about different forest landscapes across India and the quantification of our model's trait outputs in those areas. These case studies illustrate that the model outputs are ecologically plausible, spatially coherent, and consistent with independent ground knowledge, reinforcing confidence in the developed trait maps for regional forest assessment and monitoring.
Furthermore, we have collaborated with our partners who are using the CoRE stack app in different forests across India to get their feedback on the models' predictions. An app has been set up to collect ground-truth in those areas by the partners to enable constant validation and quantify our models' performance across distinct mixed forest areas.
| Task | Input Features | Test Set | OOS - 2020 | OOS - 2021 | OOS - 2022 | OOS A | - 2023 | |||||
|---|---|---|---|---|---|---|---|---|---|---|---|---|
| A | F1 | A | F1 | A | F1 | A | F1 | F1 | ||||
| Leaf Phenology | Sentinel-1&2 | 93 | 93 | 75 | 80 | 71 | 76 | 66 | 73 | 54 | 63 | |
| AEF Embeddings | 86 | 86 | 88 | 90 | 95 | 95 | 97 | 97 | 97 | 97 | ||
| Leaf Type | Sentinel-1&2 | 84 | 84 | 91 | 92 | 92 | 92 | 91 | 92 | 92 | 93 | |
| AEF Embeddings | 89 | 89 | 96 | 97 | 98 | 98 | 98 | 98 | 98 | 98 | ||
| Dataset | Resolution (m) | Leaf Phenology Accuracy | Leaf Type Accuracy |
| Our Model | 10 | 94 | 94 |
| GLC | 30 | 38.1 | 39.5 |
| ESA CCI | 300 | 4.5 | 4.9 |
5 Tree Traits Change Dynamics between 2018 to 2023 in Protected Forest Areas in India
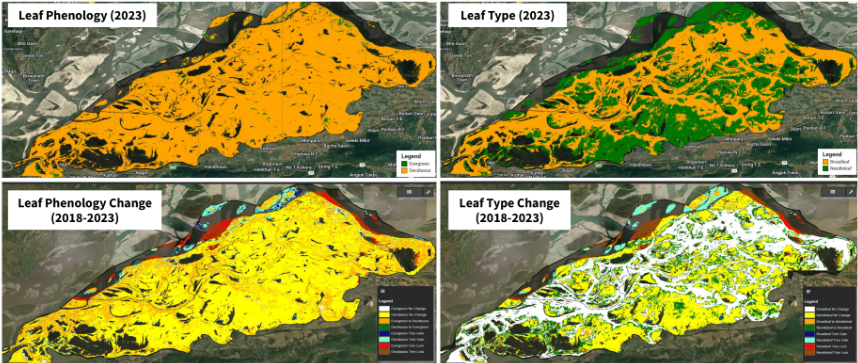
To demonstrate the practical utility of the proposed framework for tree traits monitoring, we applied the trained trait models across several ecologically and structurally distinct Protected Areas (PAs) in India obtained fromWorld Database on Protected Areas (WDPA) [UNEP-WCMC and IUCN, 2025] on GEE. The PAs were manually inspected on Google Earth and those which were primarily wet lands were removed from this analysis, leaving mainly forest national parks and sanctuaries. This filtering led to 45 PAs in different Agro-Climatic Zones (ACZ) in India. Tree-covered pixels were identified as the union of the "trees" class from Dynamic World [Brown et al., 2022] and IndiaSAT [Bansal et al., 2026] land use land cover products, providing a consistent 10 m resolution mask. As an example, Figure 3 represents the traits output maps of 2023 and the traits change dynamics maps between 2018-2023 of the Kaziranga National Park. Kaziranga is known to have dense tropical moist broadleaf deciduous forests, tropical moist mixed deciduous forests, and tropical semi-evergreen forests in recent years 3 . The traits map shows dominance of broadleaf deciduous trees in this region over time, which is consistent with known information about the region. The traits output maps for all the PAs are available in the GitHub repository of this paper.
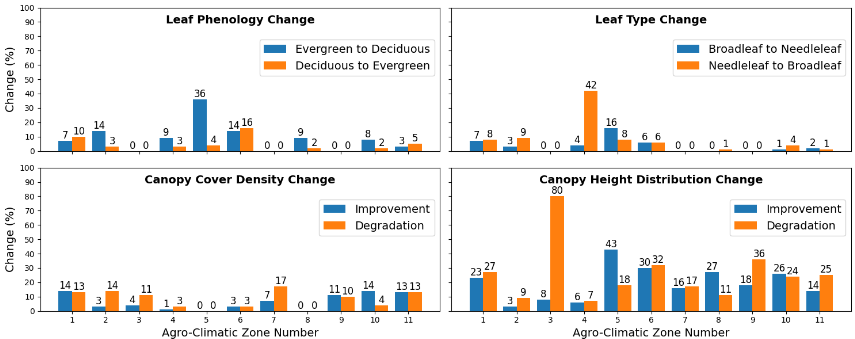
Furthermore, we used other datasets to compute the tree health and traits changes in all PAs across different ACZs. The leaf phenology and leaf type outputs are at 10 m resolution, while the canopy density and height distribution outputs are at 25 m resolution [Goyal et al., 2025]. The transitions across different classes in the tree cover region between 2018 and 2023 for all the 4 tasks are quantified and represented in the graphs shown in Figure 4. Upper Gangetic Plain Region (ACZ-5) shows the maximum proportion of trees in PAs converted to deciduous and needleleaf amongst all ACZs, as well as maximum improvement in canopy height between 2018-2023. The majority of tree cover in the Trans Gangetic Plain Region (ACZ-6) converted from deciduous to evergreen in the past few years. 42.3% of trees in the Middle Gangetic Plain Region's (ACZ-4) PAs converted from needleleaf to broadleaf over time. The Lower Gangetic Plain Region (ACZ-3) and the Eastern Plateau & Hills Region (ACZ7) have undergone the highest degradation in PAs in terms of canopy height and density, respectively. Southern Plateau and Hills Region (ACZ-10) showed the largest improvement in canopy density across years.
3 https://en.wikipedia.org/wiki/Kaziranga National Park
6 Conclusion
The paper presents a robust and scalable framework for mapping tree functional traits, viz., leaf phenology and leaf type, at 10 m resolution using open-source AEF embeddings data. A sampling approach based on time-series clustering of widely distributed plantation polygons is demonstrated, which helps to build more spatially and temporally generalizable models as compared to random or other stratification splits. The models developed achieve higher predictive performance under heterogeneous environmental conditions. For modeling, the pixels labeled as "trees" by LULC products are filtered from PFTD polygons to ensure the use of good-quality data. However, we acknowledge that even with different cleaning and filtering steps, the data may still have some noise, which would have normalized by taking a large number of samples for training the model.
Our approach produces accurate and temporally stable trait maps, significantly outperforming models trained on Sentinel-1&2 time-series and existing public land-cover products in India. Deployment of the best-performing Random Forest models on Google Earth Engine enables efficient, on-demand inference over large regions. The analysis on protected forest areas further demonstrates the ecological significance of the outputs and their potential to monitor forest composition, phenological shifts, and tree health indicators. All the trait output maps are publicly available on GEE. The pipeline is robust and can be adopted globally in any region where groundtruth data is available. The Pan-India maps for different years will be hosted on relevant CoRE stack apps 4 as part of the CoRE stack platform, which is actively used by forest communities, civil society organizations, and community volunteers for monitoring and decision-making.
4 https://ee-corestackdev.projects.earthengine.app
| Area | State | Ground Information | Model's Output |
|---|---|---|---|
| Panna Tiger Reserve | Madhya Pradesh | Deciduous and broadleaf trees a | 100% deciduous and broadleaf trees |
| Keoladeo National Park | Rajasthan | Evergreen trees b | 89% evergreen trees |
| Nainital Valley View Point | Uttarakhand | Needleleaf trees | 99.2% needleaf trees |
| Satpura Tiger Reserve | Madhya Pradesh | Deciduous and broadleaf trees c | 100% deciduous and broadleaf trees |
| PichavaramMangrove Forest | Tamil Nadu | Evergreen trees | 100% evergreen trees |
| Angul Sal Forest | Odisha | Deciduous and broadleaf trees d | 99.98% deciduous and 100% broadleaf trees |
a https://forest.mponline.gov.in/eBrochure/eBrochureDetailsV2.aspx?parkid=3
b https://en.wikipedia.org/wiki/Keoladeo National Park and https://environment.rajasthan.gov.in/content/dam/environment/Env/ZMP/ ZMP KNP.pdf
c https://www.satpuratigerreserve.org/forest-type
d https://odishaforest.in/forests-in-odisha/forest-types and https://www.dfoangul.org/about.php
Acknowledgments
We would like to thank Tower Research, Google, and R Systems for supporting the research, and the Foundation for Ecological Security (FES), Ashoka Trust for Research in Ecology and the Environment (ATREE) and Auroville Botanical Gardens for facilitating field visits to ground the research.
@inproceedings{ijcai2026p798,
  title     = {Scalable Mapping of Tree Traits to Study the Dynamics of Protected Forest Areas in India},
  author    = {Goyal, Dhruvi and Seth, Aaditeshwar},
  booktitle = {Proceedings of the Thirty-Fifth International Joint Conference on
               Artificial Intelligence, {IJCAI-26}},
  publisher = {International Joint Conferences on Artificial Intelligence Organization},
  editor    = {Diego Calvanese},
  pages     = {7174--7182},
  year      = {2026},
  month     = {8},
  note      = {AI and Social Good},
  doi       = {10.24963/ijcai.2026/798},
  url       = {https://doi.org/10.24963/ijcai.2026/798},
}
TY - CPAPER TI - Scalable Mapping of Tree Traits to Study the Dynamics of Protected Forest Areas in India AU - Goyal, Dhruvi AU - Seth, Aaditeshwar T2 - Proceedings of the Thirty-Fifth International Joint Conference on Artificial Intelligence, IJCAI-26 PB - International Joint Conferences on Artificial Intelligence Organization PY - 2026 SP - 7174 EP - 7182 DO - 10.24963/ijcai.2026/798 UR - https://doi.org/10.24963/ijcai.2026/798 ER -Copied
Machine-readable versions of this paper, for tools and AI agents:





