
Learning Hyperspherical Time–Frequency Representations for Time-Series Out-of-Distribution Detection
Proceedings of the Thirty-Fifth International Joint Conference on Artificial Intelligence. Main Track. Pages 2888-2896.
https://doi.org/10.24963/ijcai.2026/321
© 2026 International Joint Conferences on Artificial Intelligence
Keywords
- Machine Learning: Representation learning
- Data Mining: Anomaly/outlier detection
- Machine Learning: Open-World/Open-Set/OOD Learning
Abstract
Out-of-distribution (OOD) detection for time-series data remains comparatively underexplored compared to vision and language, with a limited principled understanding of how supervised time-series representations can be leveraged for reliable detection under distributional shifts. This work formulates time-series OOD detection as representation learning with hyperspherical embeddings, where class-conditional structure is induced by a von Mises–Fisher (vMF) likelihood–based objective on the unit sphere. The learned representation combines time- and frequency-domain views of the input signal via domain-specific encoders, integrating them into a joint embedding space for OOD detection. Detection uses distance-based scores over the learned embeddings, including k-nearest neighbors (k-NN) and Mahalanobis scores. We evaluate the approach at scale on the complete UCR and UEA time-series archives under a cross-dataset protocol. Empirical results show consistent improvements under both k-NN and Mahalanobis scoring over strong contrastive-learning and post-hoc baselines in the same setting. Code is available at https://github.com/tiiuae/hypertf-time-series-ood.
- Method Near-OOD Far-OOD F1 HAR AUDIO MOTION ECG SPECTRO OTHER UCR (Univariate) MSP 54.45 / 66.99 55.69 / 60.69 43.38 / 79.75 42.22 / 78.48 70.01 / 45.49 38.82 / 78.51 49.87 / 67.16 78.99 Mahalanobis 91.90 / 15.83 97.03 / 6.04 74.73 / 40.47 84.85 / 23.35 97.03 / 4.48 99.56 / 0.92 95.81 / 6.11 78.99 Center Loss 92.73 / 14.43 98.58 / 3.36 84.21 / 31.14 85.45 / 22.89 98.43 / 3.11 99.90 / 0.32 96.89 / 4.59 78.81 SimCLR+CE 91.44 / 18.37 96.31 / 9.23 66.03 / 51.27 88.86 / 23.92 98.71 / 3.97 99.03 / 2.76 94.82 / 8.86 72.16 KNN+ 93.14 / 14.45 96.50 / 8.88 91.49 / 24.16 93.82 / 14.46 99.69 / 0.89 99.70 / 0.49 96.12 / 5.20 67.49 SSD+ (w/ Maha++) 93.83 / 12.93 97.85 / 5.57 92.99 / 17.24 92.01 / 15.10 99.76 / 0.64 99.64 / 0.49 97.08 / 3.89 67.49 CIDER 92.78 / 15.38 96.38 / 9.01 89.20 / 27.53 93.15 / 16.15 99.41 / 1.61 99.61 / 1.04 96.53 / 5.65 78.88 HyperTF 93.94 / 12.91 99.13 / 2.42 94.63 / 13.61 93.91 / 13.53 99.48 / 1.34 99.95 / 0.19 99.40 / 1.41 82.53 + Auxiliary Outlier Data 94.11 / 12.56 99.31 / 1.92 95.24 / 12.43 93.19 / 14.81 99.58 / 1.16 99.97 / 0.12 99.45 / 1.13 79.14 UEA (Multivariate) MSP 55.19 / 62.54 49.22 / 65.79 14.82 / 96.95 72.58 / 41.89 32.18 / 81.59 38.96 / 61.56 61.02 / 51.84 70.64 Mahalanobis 87.56 / 18.21 88.53 / 15.75 99.87 / 0.35 98.35 / 4.20 91.20 / 12.06 92.32 / 7.78 82.77 / 19.63 70.64 Center Loss 89.17 / 15.12 90.02 / 13.36 99.83 / 0.37 99.25 / 1.71 95.06 / 6.90 96.17 / 3.92 84.73 / 18.33 70.00 SimCLR+CE 90.35 / 18.57 94.08 / 11.09 92.18 / 14.95 99.50 / 1.39 94.66 / 11.87 89.85 / 10.92 90.87 / 12.60 76.14 KNN+ 91.62 / 12.31 92.44 / 10.30 97.96 / 5.06 99.71 / 0.62 96.52 / 7.30 54.74 / 45.85 91.07 / 9.81 70.16 SSD+ (w/ Maha++) 93.44 / 10.03 93.91 / 9.02 99.39 / 1.64 99.87 / 0.38 96.85 / 7.22 92.20 / 7.86 91.16 / 9.60 70.16 CIDER 92.74 / 13.81 95.55 / 7.49 93.63 / 11.45 99.55 / 0.78 92.23 / 12.98 91.44 / 9.23 90.90 / 10.75 77.75 HyperTF 97.76 / 6.05 96.61 / 5.56 98.65 / 2.72 99.94 / 0.31 95.24 / 10.91 99.77 / 0.26 99.55 / 1.32 81.74 + Auxiliary Outlier Data 98.23 / 4.94 97.12 / 4.54 98.47 / 2.66 99.97 / 0.16 95.52 / 10.67 99.88 / 0.16 96.16 / 5.55 80.73
- [Baek et al., 2024] Eunsu Baek, Keondo Park, Jiyoon Kim, and Hyung-Sin Kim. Unexplored faces of robustness and out-of- distribution: Covariate shifts in environment and sensor do- mains. In IEEE/CVF Conference on Computer Vision and Pattern Recognition, pages 22294-22303, 2024.
- [Belkhouja et al., 2023] Taha Belkhouja, Yan Yan, and Janard- han Rao Doppa. Out-of-distribution detection in time-series do- main: A novel seasonal ratio scoring approach. ACM Transac- tions on Intelligent Systems and Technology, 15(1):1-24, 2023.
- [Burapacheep and Li, 2024] Jirayu Burapacheep and Yixuan Li. Your classifier can be secretly a likelihood-based OOD detector. Transactions on Machine Learning Research, 2024.
- [Chen et al., 2020] Ting Chen, Simon Kornblith, Mohammad Norouzi, and Geoffrey Hinton. A simple framework for con- trastive learning of visual representations. In International Con- ference on Machine Learning, pages 1597-1607, 2020.
- [Chen et al., 2021] Jiefeng Chen, Yixuan Li, Xi Wu, Yingyu Liang, and Somesh Jha. ATOM: Robustifying out-of-distribution detec- tion using outlier mining. In Machine Learning and Knowledge Discovery in Databases. Research Track, pages 430-445, 2021.
- [Djurisic et al., 2023] Andrija Djurisic, Nebojsa Bozanic, Arjun Ashok, and Rosanne Liu. Extremely simple activation shaping for out-of-distribution detection. In International Conference on Learning Representations, 2023.
- [Du et al., 2022] Xuefeng Du, Gabriel Gozum, Yifei Ming, and Yixuan Li. SIREN: Shaping representations for detecting out- of-distribution objects. In Advances in Neural Information Pro- cessing Systems, pages 20434-20449, 2022.
- [Gao et al., 2023] Ruiyuan Gao, Chenchen Zhao, Lanqing Hong, and Qiang Xu. DiffGuard: Semantic mismatch-guided out- of-distribution detection using pre-trained diffusion models. In IEEE/CVF International Conference on Computer Vision, pages 1579-1589, 2023.
- [Gungor et al., 2025] Onat Gungor, Amanda Sofie Rios, Nilesh Ahuja, and Tajana Rosing. TS-OOD: Evaluating time-series out- of-distribution detection and prospective directions for progress. arXiv preprint arXiv:2502.15901, 2025.
- [Hendrycks and Gimpel, 2017] Dan Hendrycks and Kevin Gimpel. A baseline for detecting misclassified and out-of-distribution ex- amples in neural networks. In International Conference on Learning Representations, 2017.
- [Hendrycks et al., 2019] Dan Hendrycks, Mantas Mazeika, and Thomas Dietterich. Deep anomaly detection with outlier expo- sure. In International Conference on Learning Representations, 2019.
- [Hendrycks et al., 2022] Dan Hendrycks, Steven Basart, Mantas Mazeika, Andy Zou, Joe Kwon, Mohammadreza Mostajabi, Ja- cob Steinhardt, and Dawn Song. Scaling out-of-distribution de- tection for real-world settings. In International Conference on Machine Learning, pages 8759-8773, 2022.
- [Huang et al., 2021] Rui Huang, Andrew Geng, and Yixuan Li. On the importance of gradients for detecting distributional shifts in the wild. In Advances in Neural Information Processing Systems, pages 677-689, 2021.
- [Huang et al., 2022] Wenjian Huang, Hao Wang, Jiahao Xia, Chengyan Wang, and Jianguo Zhang. Density-driven regular- ization for out-of-distribution detection. In Advances in Neural Information Processing Systems, pages 887-900, 2022.
- [Ismail Fawaz et al., 2020] Hassan Ismail Fawaz, Benjamin Lu- cas, Germain Forestier, Charlotte Pelletier, Daniel F Schmidt, Jonathan Weber, Geoffrey I Webb, Lhassane Idoumghar, Pierre- Alain Muller, and Franc ¸ois Petitjean. InceptionTime: Finding AlexNet for time series classification. Data Mining and Knowl- edge Discovery, 34(6):1936-1962, 2020.
- [Khosla et al., 2020] Prannay Khosla, Piotr Teterwak, Chen Wang, Aaron Sarna, Yonglong Tian, Phillip Isola, Aaron Maschinot, Ce Liu, and Dilip Krishnan. Supervised contrastive learning. In Advances in Neural Information Processing Systems, pages 18661-18673, 2020.
- [Lai et al., 2021] Kwei-Herng Lai, Daochen Zha, Junjie Xu, Yue Zhao, Guanchu Wang, and Xia Hu. Revisiting time series outlier detection: Definitions and benchmarks. In Neural Information Processing Systems Track on Datasets and Benchmarks, 2021.
- [Lee et al., 2018] Kimin Lee, Kibok Lee, Honglak Lee, and Jin- woo Shin. A simple unified framework for detecting out-of- distribution samples and adversarial attacks. In Advances in Neu- ral Information Processing Systems, pages 7167-7177, 2018.
- [Li et al., 2023a] Jinglun Li, Xinyu Zhou, Pinxue Guo, Yixuan Sun, Yiwen Huang, Weifeng Ge, and Wenqiang Zhang. Hierarchical visual categories modeling: A joint representation learning and density estimation framework for out-of-distribution detection. In IEEE/CVF International Conference on Computer Vision, pages 23425-23435, 2023.
- [Li et al., 2023b] Jingyao Li, Pengguang Chen, Zexin He, Shaozuo Yu, Shu Liu, and Jiaya Jia. Rethinking out-of-distribution (OOD) detection: Masked image modeling is all you need. In IEEE/CVF Conference on Computer Vision and Pattern Recognition, pages 11578-11589, 2023.
- [Liang et al., 2018] Shiyu Liang, Yixuan Li, and Rayadurgam Srikant. Enhancing the reliability of out-of-distribution image detection in neural networks. In International Conference on Learning Representations, 2018.
- [Liu et al., 2020] Weitang Liu, Xiaoyun Wang, John Owens, and Yixuan Li. Energy-based out-of-distribution detection. In Ad- vances in Neural Information Processing Systems, pages 21464- 21475, 2020.
- [Liu et al., 2023] Xixi Liu, Yaroslava Lochman, and Christopher Zach. GEN: Pushing the limits of softmax-based out-of- distribution detection. In IEEE/CVF Conference on Computer Vision and Pattern Recognition, pages 23946-23955, 2023.
- [Lu et al., 2024a] Haodong Lu, Dong Gong, Shuo Wang, Jason Xue, Lina Yao, and Kristen Moore. Learning with mixture of pro- totypes for out-of-distribution detection. In International Confer- ence on Learning Representations, 2024.
- [Lu et al., 2024b] Wang Lu, Jindong Wang, Xinwei Sun, Yiqiang Chen, Xiangyang Ji, Qiang Yang, and Xing Xie. Diversify: A general framework for time series out-of-distribution detection and generalization. IEEE Transactions on Pattern Analysis and Machine Intelligence, 46(6):4534-4550, 2024.
- [Lunardi et al., 2025] Willian T. Lunardi, Abdulrahman Banabila, Dania Herzalla, and Martin Andreoni. Contrastive representa- tion modeling for anomaly detection. In European Conference on Artificial Intelligence, pages 2594-2601, 2025.
- [Ming et al., 2022] Yifei Ming, Ying Fan, and Yixuan Li. POEM: Out-of-distribution detection with posterior sampling. In Inter- national Conference on Machine Learning, pages 15650-15665, 2022.
- [Ming et al., 2023] Yifei Ming, Yiyou Sun, Ousmane Dia, and Yix- uan Li. How to exploit hyperspherical embeddings for out-of- distribution detection? In International Conference on Learning Representations, 2023.
- [Müller and Hein, 2025] Maximilian Müller and Matthias Hein. Mahalanobis++: Improving OOD detection via feature normal- ization. In International Conference on Machine Learning, pages 45151-45184, 2025.
- [Park et al., 2023] Jaewoo Park, Yoon Gyo Jung, and Andrew Beng Jin Teoh. Nearest neighbor guidance for out-of-distribution detection. In IEEE/CVF International Conference on Computer Vision, pages 1686-1695, 2023.
- [Peng et al., 2024] Bo Peng, Yadan Luo, Yonggang Zhang, Yixuan Li, and Zhen Fang. ConjNorm: Tractable density estimation for out-of-distribution detection. In International Conference on Learning Representations, 2024.
- [Regmi et al., 2024] Sudarshan Regmi, Bibek Panthi, Yifei Ming, Prashnna K Gyawali, Danail Stoyanov, and Binod Bhattarai. ReweightOOD: Loss reweighting for distance-based OOD detec- tion. In IEEE/CVF Conference on Computer Vision and Pattern Recognition Workshops, pages 131-141, 2024.
- [Sehwag et al., 2021] Vikash Sehwag, Mung Chiang, and Prateek Mittal. SSD: A unified framework for self-supervised outlier de- tection. In International Conference on Learning Representa- tions, 2021.
- [Sun et al., 2021] Yiyou Sun, Chuan Guo, and Yixuan Li. ReAct: Out-of-distribution detection with rectified activations. In Ad- vances in Neural Information Processing Systems, pages 144- 157, 2021.
- [Sun et al., 2022] Yiyou Sun, Yifei Ming, Xiaojin Zhu, and Yixuan Li. Out-of-distribution detection with deep nearest neighbors. In International Conference on Machine Learning, pages 20827- 20840, 2022.
- [Tack et al., 2020] Jihoon Tack, Sangwoo Mo, Jongheon Jeong, and Jinwoo Shin. CSI: Novelty detection via contrastive learn- ing on distributionally shifted instances. In Advances in Neural Information Processing Systems, pages 11839-11852, 2020.
- [Wang et al., 2022] Haoqi Wang, Zhizhong Li, Litong Feng, and Wayne Zhang. ViM: Out-of-distribution with virtual-logit match- ing. In IEEE/CVF Conference on Computer Vision and Pattern Recognition, pages 4921-4930, 2022.
- [Wei et al., 2022] Hongxin Wei, Renchunzi Xie, Hao Cheng, Lei Feng, Bo An, and Yixuan Li. Mitigating neural network over- confidence with logit normalization. In International Conference on Machine Learning, pages 23631-23644, 2022.
- [Wen et al., 2016] Yandong Wen, Kaipeng Zhang, Zhifeng Li, and Yu Qiao. A discriminative feature learning approach for deep face recognition. In European Conference on Computer Vision, pages 499-515, 2016.
- [Winkens et al., 2020] Jim Winkens, Rudy Bunel, Abhijit Guha Roy, Robert Stanforth, Vivek Natarajan, Joseph R Ledsam, Pa- tricia MacWilliams, Pushmeet Kohli, Alan Karthikesalingam, Simon Kohl, et al. Contrastive training for improved out-of- distribution detection. arXiv preprint arXiv:2007.05566, 2020.
- [Wu et al., 2025] Yingwen Wu, Ruiji Yu, Xinwen Cheng, Zheng- bao He, and Xiaolin Huang. Pursuing feature separation based on neural collapse for out-of-distribution detection. In Interna- tional Conference on Learning Representations, 2025.
- [Yang et al., 2021] Jingkang Yang, Haoqi Wang, Litong Feng, Xi- aopeng Yan, Huabin Zheng, Wayne Zhang, and Ziwei Liu. Se- mantically coherent out-of-distribution detection. In IEEE/CVF International Conference on Computer Vision, pages 8301-8309, 2021.
- [Yang et al., 2022a] Jingkang Yang, Pengyun Wang, Dejian Zou, Zitang Zhou, Kunyuan Ding, Wenxuan Peng, Haoqi Wang, Guangyao Chen, Bo Li, Yiyou Sun, et al. OpenOOD: Bench- marking generalized out-of-distribution detection. In Advances in Neural Information Processing Systems, pages 32598-32611, 2022.
- [Yang et al., 2022b] Yijun Yang, Ruiyuan Gao, and Qiang Xu. Out- of-distribution detection with semantic mismatch under masking. In European Conference on Computer Vision, pages 373-390, 2022.
- [Yao et al., 2024] Haiyun Yao, Zongbo Han, Huazhu Fu, Xi Peng, Qinghua Hu, and Changqing Zhang. Out-of-distribution detec- tion with diversification (provably). In Advances in Neural Infor- mation Processing Systems, pages 22690-22719, 2024.
- [Yu and Aizawa, 2019] Qing Yu and Kiyoharu Aizawa. Unsuper- vised out-of-distribution detection by maximum classifier dis- crepancy. In IEEE/CVF International Conference on Computer Vision, pages 9518-9526, 2019.
- [Yue et al., 2022] Zhihan Yue, Yujing Wang, Juanyong Duan, Tian- meng Yang, Congrui Huang, Yunhai Tong, and Bixiong Xu. TS2Vec: Towards universal representation of time series. In AAAI Conference on Artificial Intelligence, pages 8980-8987, 2022.
- [Zhang and Xiang, 2023] Zihan Zhang and Xiang Xiang. Decou- pling maxlogit for out-of-distribution detection. In IEEE/CVF Conference on Computer Vision and Pattern Recognition, pages 3388-3397, 2023.
- [Zhang et al., 2023] Jingyang Zhang, Nathan Inkawhich, Randolph Linderman, Yiran Chen, and Hai Li. Mixture outlier expo- sure: Towards out-of-distribution detection in fine-grained envi- ronments. In IEEE/CVF Winter Conference on Applications of Computer Vision, pages 5531-5540, 2023.
- [Zhang et al., 2024] Jingyang Zhang, Jingkang Yang, Pengyun Wang, Haoqi Wang, Yueqian Lin, Haoran Zhang, Yiyou Sun, Xuefeng Du, Yixuan Li, Ziwei Liu, Yiran Chen, and Hai Li. OpenOOD v1.5: Enhanced benchmark for out-of-distribution de- tection. Journal of Data-centric Machine Learning Research, 2024.
- [Zhou et al., 2021] Zhi Zhou, Lan-Zhe Guo, Zhanzhan Cheng, Yu- Feng Li, and Shiliang Pu. STEP: Out-of-distribution detection in the presence of limited in-distribution labeled data. In Advances in Neural Information Processing Systems, pages 29168-29180, 2021.
- [Zhu et al., 2023] Jianing Zhu, Yu Geng, Jiangchao Yao, Tongliang Liu, Gang Niu, Masashi Sugiyama, and Bo Han. Diversified out- lier exposure for out-of-distribution detection via informative ex- trapolation. In Advances in Neural Information Processing Sys- tems, pages 22702-22734, 2023.
References were extracted automatically from the PDF and may contain errors.
Full text extracted automatically from the PDF; figures, tables and equations may differ. The PDF is the version of record.
1 Introduction
Out-of-distribution (OOD) detection constitutes a core requirement for dependable machine learning systems, particularly in regimes where deployment-time failures incur disproportionate risk. In such regimes, predictive models are routinely exposed to input distributions that deviate from those observed during training, rendering the ability to identify samples lying outside the intended domain of generalization coequal in importance to achieving strong in-distribution (ID) performance. Although OOD detection has been extensively investigated in modalities such as images and text, its formulation for time-series data remains comparatively underdeveloped [Lu et al., 2024b]. This gap is nontrivial: time-series observations exhibit structured temporal dependencies, frequency-domain characteristics, and measurement processes tightly coupled to sensing hardware, acquisition protocols, and preprocessing pipelines, thereby inducing distributional shifts that are qualitatively distinct from those encountered in exchangeable or spatially indexed data.
Existing approaches to OOD detection are typically grouped into two broad categories: post-hoc scoring methods, which estimate OODness from classifier outputs or intermediate representations obtained under standard supervised training, and training-time methods, which modify the learning objective to improve separation between in- and OOD samples. Although both categories perform well in many vision-focused benchmarks [Yang et al., 2022a; Zhang et al., 2024], recent results indicate that their effectiveness often degrades on multivariate time-series data [Gungor et al., 2025]. A key reason is that distribution shift in time-series settings is rarely purely semantic, but instead reflects combined changes in the underlying process and measurement pipeline, leading to systematic differences in temporal or spectral structure caused by sensing hardware, acquisition protocols, population differences, or preprocessing choices [Baek et al., 2024]. This issue is compounded by evaluation practices adopted from open set recognition, which commonly rely on intra-dataset, label-disjoint splits that assume identical sensing conditions for ID and OOD samples. Such protocols underrepresent the cross-environment shifts encountered in practice and, in datasets with few classes, can blur the distinction between open-set recognition (OSR) and OOD detection.
Motivated by these observations, we approach time-series OOD detection from a representation learning perspective that explicitly accounts for both semantic structure and geometric organization in embedding space. In particular, we consider hyperspherical embeddings, in which classconditional structure is induced on the unit sphere through objectives motivated by directional statistical models and angular separation. Within this framework, distance-based OOD scoring arises naturally from the geometry of the learned representations and their class-conditional arrangement. To capture complementary aspects of time-series data, the proposed method integrates time-domain and frequency-domain views through domain-specific encoders, enabling the model to encode both temporal dynamics and spectral characteristics while preserving a unified embedding geometry suitable for OOD detection under distribution shift. The contributions of this work are summarized as follows:
- We propose HyperTF, a hyperspherical representation
- learning framework for time-series OOD detection that induces class-conditional structure on the unit sphere via a von Mises-Fisher (vMF) likelihood formulation.
- We introduce a dual-view time-frequency architecture that learns aligned representations from temporal and spectral views, coupled through a shared hyperspherical decision geometry and a cross-domain consistency regularizer.
- Extensive experiments show that HyperTF improves embedding-level OOD separability over strong contrastive and post-hoc baselines, particularly under Mahalanobis++ (Maha++) scoring, and that auxiliary outliers (optionally with MixOE) further enhance detection in limited-coverage regimes.
The remainder of the paper is organized as follows. Section 2 reviews related work on OOD detection in general and time-series settings in particular, positioning the present work within the broader literature. Section 3 defines the considered problem and introduces the required hyperspherical preliminaries. Section 4 presents the proposed HyperTF framework, while Section 5 reports the experimental results, comparative evaluation, and ablation studies. Finally, Section 6 concludes the paper and summarizes the main findings.
2 RelatedWork
Post-hoc confidence scoring. Early OOD detection work primarily focuses on post-hoc confidence estimation, where models are trained normally and OOD signals are derived at inference via training-agnostic scores. The standard baseline is maximum softmax probability (MSP) [Hendrycks and Gimpel, 2017], with subsequent methods improving logit calibration or confidence modeling, including Energy-based scoring [Liu et al., 2020], MaxLogits [Hendrycks et al., 2022], and GEN [Liu et al., 2023]. Distance-based approaches measure deviations from the ID feature manifold: parametric methods such as the Mahalanobis detector [Lee et al., 2018], Maha++ [M¨uller and Hein, 2025], and SSD [Sehwag et al., 2021] assume class-conditional Gaussian structure, while non-parametric methods like k-nearest neighbors (k-NN) [Sun et al., 2022] and NNGuide [Park et al., 2023] leverage local neighborhood geometry. Other approaches exploit model internals, including gradient-based methods such as GradNorm [Huang et al., 2021], as well as activation-based techniques like ODIN [Liang et al., 2018], ReAct [Sun et al., 2021], ViM [Wang et al., 2022], and ASH [Djurisic et al., 2023]. From a density-modeling perspective, feature-space methods such as GEN [Liu et al., 2023] and ConjNorm [Peng et al., 2024] have also been explored.
Training-time regularization. A complementary line of OOD detection research alters training objectives or embedding geometry to better separate in- and OOD samples. Early work embeds OOD awareness directly into representation learning without auxiliary data, often via reconstructionbased objectives, where methods such as MoodCat [Yang et al., 2022b], MOOD [Li et al., 2023b], and DiffGuard [Gao et al., 2023] identify OOD inputs through reconstruction errors.
Other approaches calibrate features or logits using probabilistic, normalization, or density-based regularization, including HVCM [Li et al., 2023a], DDR [Huang et al., 2022], LogitNorm [Wei et al., 2022], and DML [Zhang and Xiang, 2023]. More recent work explicitly shapes embedding spaces with contrastive or metric learning, building on NT-Xent [Chen et al., 2020] and SupCon [Khosla et al., 2020], and extending to OOD-aware variants such as Winkens et al. (2020), CSI [Tack et al., 2020], SSD+ [Sehwag et al., 2021], KNN+ [Sun et al., 2022], and FIRM [Lunardi et al., 2025]. Complementary prototype-based and hyperspherical methods impose classconditional geometry to enhance OOD separation, including Step [Zhou et al., 2021], SIREN [Du et al., 2022], CIDER [Ming et al., 2023], PALM [Lu et al., 2024a], ReweightOOD [Regmi et al., 2024], and PFS [Wu et al., 2025]. Burapacheep and Li (2024) further show that unit-norm classifiers induce a vMF mixture density whose log-likelihood supports principled OOD detection.
Auxiliary outliers. Another line of work incorporates auxiliary outlier data during training to enhance OOD detection by shaping model behavior near or beyond the ID boundary, typically promoting uniform or low-confidence predictions for OOD inputs. Such auxiliary-outlier-based methods depend on external datasets or sampling strategies to provide explicit OOD supervision, including Outlier Exposure (OE) [Hendrycks et al., 2019], MCD [Yu and Aizawa, 2019], UDG [Yang et al., 2021], ATOM [Chen et al., 2021], and POEM [Ming et al., 2022]. Despite their effectiveness, these methods are sensitive to the quality and diversity of the selected outliers, which has motivated subsequent approaches such as MixOE [Zhang et al., 2023], DivOE [Zhu et al., 2023], and DiverseMix [Yao et al., 2024]. These later methods improve boundary coverage through mixup-based augmentation or learnable extrapolation strategies.
OOD detection for time series. OOD detection for timeseries data remains largely underexplored compared to vision and language, despite its importance in industrial, healthcare, and other safety-critical settings. This is partly due to the field's historical focus on internal structural anomalies rather than distributional shifts [Lai et al., 2021]. Only recently has a benchmark been proposed: to our knowledge, Gungor et al. (2025) introduce the first modality-agnostic evaluation on multivariate time series, but it is limited to intra-dataset semantic class splits, lacks auxiliary outlier data, and does not consider modality-aware or cross-dataset structure. Their analysis shows poor transfer of many post-hoc methods, with deep feature-based approaches performing more robustly [Gungor et al., 2025]. Beyond this, most OOD methods are developed for vision or language and are sparsely evaluated on time series, with only a few dedicated approaches such as SRS [Belkhouja et al., 2023] and Diversify [Lu et al., 2024b]. Overall, the literature lacks systematic studies of hyperspherical representations for time-series OOD detection, comprehensive cross-dataset evaluations, and principled auxiliary-data settings.
3 Preliminaries
3.1 Problem Statement
OOD detection aims to identify test inputs for which model predictions are unreliable, namely samples outside the intended generalization scope of the model [Zhang et al., 2024]. It is commonly formulated as a binary decision problem in which a test sample x is determined to originate either from the ID distribution Pin or from an unknown OOD distribution Pout. In standard image-classification benchmarks, for example, CIFAR-10 may be used as Pin, while CIFAR-100 or TinyImageNet are used as near-OOD data, and Places365 or SVHN are used as far-OOD data.
Let Yin denote the ID label space, and let Dood test be an OOD test set with label space Yood such that Yood ∩Yin = ∅. For an ID input x, the classifier fθ provides class-posterior estimates pθ(y | x) for y ∈ Yin and assigns the label
Thus, the decision problem is dual: samples drawn from Pin must be classified over Yin, whereas samples drawn from Pout must be detected and rejected. The latter decision is represented by an OOD score S(·; fθ) : X → R, which induces the threshold detector
where larger scores indicate higher OOD likelihood; for similarity-based scores, such as cosine similarity, the negated similarity is used to preserve this convention. The threshold λ is usually selected so that a fixed proportion of ID samples, e.g., 95%, are accepted as ID.
3.2 Hyperspherical Embeddings
We adopt a hyperspherical representation framework in which normalized class-conditional features lie on the unit sphere and are modeled using directional probability distributions. Let Sd-1 := {u ∈ Rd : ∥u∥2 = 1} denote the unit (d - 1)-sphere, and let z ∈ Sd-1 represent a normalized feature vector. For a classification problem with class set C := {1, . . . ,C}, each class c ∈ C is associated with a prototype direction µc ∈ Sd-1 .
Following prior work on hyperspherical feature modeling [Ming et al., 2023; Burapacheep and Li, 2024], the conditional distribution of z given label y = c is modeled by a
where κ > 0 controls angular dispersion and Cd(κ) is the normalization constant. Under this model, classification depends only on the angular similarity between z and the class prototypes.
4 Methodology
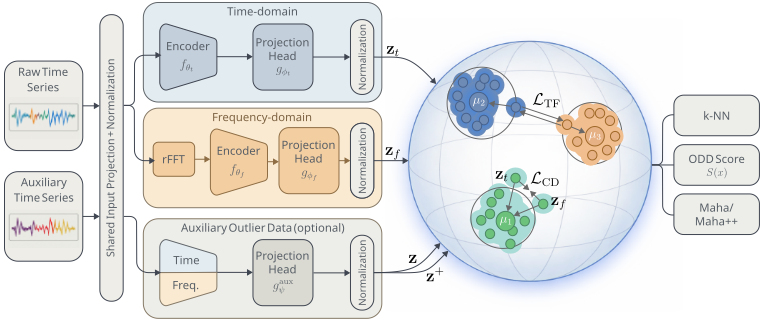
This section formalizes the proposed HyperTF framework (Figure 1). The model employs a dual-stream architecture in the time and frequency domains, where augmented inputs are projected into a shared hyperspherical embedding space and supervised by common class prototypes. Training minimizes a composite objective that combines supervised hyperspherical classification, cross-domain feature alignment, and an optional auxiliary contrastive regularizer:
where LTF, LCD, and LAX are defined in Equations (2), (3), and (4), and λCD and λAX weight the regularization terms. For simplicity, we set λCD = λAX = 1 in all experiments.
4.1 Model Overview and Notation
Let x ∈ RS×F denote an input sequence, where S and F index the temporal length and channel dimensionality, respectively. During training, stochastic view sampling is performed using an augmentation distribution A, producing paired samples x(1) , x(2) ∼ A(x). Since the model is designed to be view-consistent, subsequent mappings are defined without explicitly indexing the views. An initial channel projection Π : RS×F → RS×Dproj is applied independently at each time step, yielding a projected sequence ˆx = Π(x); Π is implemented as a linear embedding followed by normalization.
From the projected sequence ˆx, two complementary but aligned representations are constructed. The time-domain representation is defined directly as the projected signal, while the frequency-domain representation is obtained by applying a real-valued Fourier transform along the temporal dimension followed by a logarithmic magnitude scaling, yielding
These representations are processed by parallel, domainspecific encoders,
which share the same architectural design but use separate parameter sets. Each encoder aggregates temporal information through pooling operations (mean+max concatenation), resulting in fixed-dimensional representations ht, hf ∈ Rd . To apply shared prototype-based supervision without imposing cross-domain invariance, the encoder outputs are mapped by domain-specific supervised projection heads,
The resulting embeddings reside in a common hyperspherical space while retaining domain-specific structure for downstream classification.
Each projected feature is ℓ2-normalized, producing unitnorm embeddings zt, zf ∈ Sd-1 . A shared set of learnable class prototypes {µc}Cc=1 ⊂ Sd-1 defines a common angular decision space across domains. At inference time, class scores are obtained by averaging time- and frequency-domain prototype similarities:
where τ > 0 is a temperature parameter. During training, zt and zf are supervised separately using the same prototypes, so that both branches remain discriminative while retaining domain-specific information.
4.2 Shared Hyperspherical Supervision via von Mises-Fisher Modeling
Building on the hyperspherical embedding framework introduced in Section 3.2, this subsection derives the supervised classification objective used to train the proposed model. Let z ∈ Sd-1 denote a unit-norm embedding produced by either processing branch, and let {µc}Cc=1 ⊂ Sd-1 denote the shared set of learnable class prototypes. Assuming the classconditional vMF model defined in Equation (1), the likelihood of z given label y = c is
where κ > 0 denotes the concentration parameter and Cd(κ) is the corresponding normalization constant.
Under the assumption of a uniform class prior, application of Bayes' rule yields a posterior distribution of the form
which coincides with a cosine-softmax classifier. Introducing a temperature parameter τ := κ-1 recovers the scaled inner-product formulation employed in the previous subsection. Maximizing the conditional log-likelihood under this model leads to the standard cross-entropy objective; for a labeled in-distribution sample (x, y) with embedding z, the resulting loss is
Supervision is applied independently to embeddings produced by the time- and frequency-domain encoders, yielding the combined supervised objective
This objective promotes intra-class compactness across both domains, while implicitly encouraging inter-class separation through competition on the hypersphere. Consequently, discriminative structure is induced within each domain-specific embedding space.
4.3 Cross-Domain Feature Consistency
While the supervised objective in Equation (2) constrains class-conditional structure within each domain, it leaves the relative alignment of domain-specific representations underdetermined. To regularize this degree of freedom, a crossdomain consistency term is introduced at the level of the normalized embeddings. Let zt, zf ∈ Sd-1 denote the ℓ2normalized outputs of the supervised projection heads. The consistency objective is defined as
where the inner product corresponds to cosine similarity on the unit hypersphere and induces an angular alignment objective between the two domains.
4.4 Auxiliary Contrastive Regularization
Training may optionally leverage unlabeled or weakly specified auxiliary time-series from Paux, whose support need not coincide with Pin. For x ∼ Paux, the augmentation operator A produces two correlated views x and x+, which are processed by the shared input projection and domain-specific encoders. A shared auxiliary projection head gaux ψ thenmaps the branch-specific representations of the two augmented views to normalized auxiliary embeddings z, z+ ∈ Sd-1 , which form an anchor-positive pair.
The auxiliary embeddings optimize a contrastive objective in which each anchor is contrasted against auxiliary and ID negatives. This mitigates collapse via instance discrimination while encouraging auxiliary-ID separation. Since gradients propagate through the auxiliary head into the encoders, the loss regularizes the representation geometry used for downstream OOD detection. The auxiliary contrastive loss is defined as
where τ > 0. The normalization term aggregates similarity scores with respect to negative samples drawn from both auxiliary and in-distribution sources. In particular, let {˜xm}Maux m=1 be i.i.d. draws from Paux with augmented views ˜x′m ∼ A(˜xm), and let {x-j }Min j=1 be i.i.d. draws from Pin, producing embeddings ˜z′m and z-j , respectively. Then
| Method | Near-OOD | Far-OOD | F1 | |||||
|---|---|---|---|---|---|---|---|---|
| HAR | AUDIO | MOTION | ECG | SPECTRO | OTHER | |||
| UCR (Univariate) | ||||||||
| MSP | 54.45 / 66.99 | 55.69 / 60.69 | 43.38 / 79.75 | 42.22 / 78.48 | 70.01 / 45.49 | 38.82 / 78.51 | 49.87 / 67.16 | 78.99 |
| Mahalanobis | 91.90 / 15.83 | 97.03 / 6.04 | 74.73 / 40.47 | 84.85 / 23.35 | 97.03 / 4.48 | 99.56 / 0.92 | 95.81 / 6.11 | 78.99 |
| Center Loss | 92.73 / 14.43 | 98.58 / 3.36 | 84.21 / 31.14 | 85.45 / 22.89 | 98.43 / 3.11 | 99.90 / 0.32 | 96.89 / 4.59 | 78.81 |
| SimCLR+CE | 91.44 / 18.37 | 96.31 / 9.23 | 66.03 / 51.27 | 88.86 / 23.92 | 98.71 / 3.97 | 99.03 / 2.76 | 94.82 / 8.86 | 72.16 |
| KNN+ | 93.14 / 14.45 | 96.50 / 8.88 | 91.49 / 24.16 | 93.82 / 14.46 | 99.69 / 0.89 | 99.70 / 0.49 | 96.12 / 5.20 | 67.49 |
| SSD+ (w/ Maha++) | 93.83 / 12.93 | 97.85 / 5.57 | 92.99 / 17.24 | 92.01 / 15.10 | 99.76 / 0.64 | 99.64 / 0.49 | 97.08 / 3.89 | 67.49 |
| CIDER | 92.78 / 15.38 | 96.38 / 9.01 | 89.20 / 27.53 | 93.15 / 16.15 | 99.41 / 1.61 | 99.61 / 1.04 | 96.53 / 5.65 | 78.88 |
| HyperTF | 93.94 / 12.91 | 99.13 / 2.42 | 94.63 / 13.61 | 93.91 / 13.53 | 99.48 / 1.34 | 99.95 / 0.19 | 99.40 / 1.41 | 82.53 |
| + Auxiliary Outlier Data | 94.11 / 12.56 | 99.31 / 1.92 | 95.24 / 12.43 | 93.19 / 14.81 | 99.58 / 1.16 | 99.97 / 0.12 | 99.45 / 1.13 | 79.14 |
| UEA (Multivariate) | ||||||||
| MSP | 55.19 / 62.54 | 49.22 / 65.79 | 14.82 / 96.95 | 72.58 / 41.89 | 32.18 / 81.59 | 38.96 / 61.56 | 61.02 / 51.84 | 70.64 |
| Mahalanobis | 87.56 / 18.21 | 88.53 / 15.75 | 99.87 / 0.35 | 98.35 / 4.20 | 91.20 / 12.06 | 92.32 / 7.78 | 82.77 / 19.63 | 70.64 |
| Center Loss | 89.17 / 15.12 | 90.02 / 13.36 | 99.83 / 0.37 | 99.25 / 1.71 | 95.06 / 6.90 | 96.17 / 3.92 | 84.73 / 18.33 | 70.00 |
| SimCLR+CE | 90.35 / 18.57 | 94.08 / 11.09 | 92.18 / 14.95 | 99.50 / 1.39 | 94.66 / 11.87 | 89.85 / 10.92 | 90.87 / 12.60 | 76.14 |
| KNN+ | 91.62 / 12.31 | 92.44 / 10.30 | 97.96 / 5.06 | 99.71 / 0.62 | 96.52 / 7.30 | 54.74 / 45.85 | 91.07 / 9.81 | 70.16 |
| SSD+ (w/ Maha++) | 93.44 / 10.03 | 93.91 / 9.02 | 99.39 / 1.64 | 99.87 / 0.38 | 96.85 / 7.22 | 92.20 / 7.86 | 91.16 / 9.60 | 70.16 |
| CIDER | 92.74 / 13.81 | 95.55 / 7.49 | 93.63 / 11.45 | 99.55 / 0.78 | 92.23 / 12.98 | 91.44 / 9.23 | 90.90 / 10.75 | 77.75 |
| HyperTF | 97.76 / 6.05 | 96.61 / 5.56 | 98.65 / 2.72 | 99.94 / 0.31 | 95.24 / 10.91 | 99.77 / 0.26 | 99.55 / 1.32 | 81.74 |
| + Auxiliary Outlier Data | 98.23 / 4.94 | 97.12 / 4.54 | 98.47 / 2.66 | 99.97 / 0.16 | 95.52 / 10.67 | 99.88 / 0.16 | 96.16 / 5.55 | 80.73 |
where Maux +Min = M - 1, and the ID negatives z- are treated as fixed reference embeddings in LAX.
5 Experiments
5.1 Experimental Setup
Datasets and training. Experiments are conducted on the full UCR Time Series Classification Archive and the UEA Multivariate Time Series Classification Archive. Each dataset is treated in turn as the ID, with all remaining datasets serving as OOD. This results in a large-scale evaluation protocol covering 158 datasets in total and a broad range of sensing modalities; the benchmark protocol is described in Appendix B. Unless stated otherwise, models are trained independently for each ID dataset, and results are averaged. All methods employ an INCEPTIONTIME [Ismail Fawaz et al., 2020] backbone followed by a projection head that maps representations into a 128-dimensional ℓ2-normalized embedding space. Optimization is performed using stochastic gradient descent (SGD) with momentum 0.9 and weight decay 3 × 10⁻³ for 100 epochs, using a batch size of 8 [Yue et al., 2022]. A cosine learning rate schedule is applied throughout training, and the temperature parameter is fixed to τ = 0.025. Further details regarding architectural variants, data augmentations, and computational resources are deferred to Appendix A. Dataset-level statistics and modality annotations are provided in Appendix D.
OOD detection scores. OOD detection is performed via distance-based scoring functions defined over the concatenated temporal and frequency learned embeddings. We consider three scoring strategies. First, we employ a k-NN score with k = 1, based on cosine similarity to the closest ID training embedding. Second, we use the classical Mahalanobis score [Lee et al., 2018], computed using class-conditional mean and covariance estimates of ID embeddings. Finally, we include Maha++ [M¨uller and Hein, 2025], which applies ℓ2 normalization to the feature representations prior to covariance estimation, thereby mitigating violations of the Gaussian assumption caused by feature norm variability and yielding a more stable distance-based score.
Evaluation metrics. Performance is assessed using three standard metrics for OOD detection and ID classification. Specifically, we report: (i) FPR@95, which measures the fraction of OOD samples incorrectly classified as ID when ID recall is fixed at 95%; (ii) AUROC, which captures thresholdindependent separation between ID and OOD samples; and (iii) the F1-score for ID classification, which reflects classification performance.
5.2 Main Results
We evaluate a broad spectrum of competitive baselines. Posthoc approaches such as MSP [Hendrycks and Gimpel, 2017] and Mahalanobis [Lee et al., 2018] rely on standard softmax cross-entropy (CE) training, while Center Loss [Wen et al., 2016] explicitly promotes intra-class compactness in the embedding space. For contrastive learning-based methods, we include SimCLR [Chen et al., 2020] combined with CE and k-NN scoring, as well as SSD+ [Sehwag et al., 2021] and KNN+ [Sun et al., 2022], both of which employ the SupCon objective. We further include CIDER [Ming et al., 2023], which optimizes hyperspherical embeddings via EMA-updated prototypes and explicitly encourages interprototype separation through a separation loss. All methods are evaluated using the same backbone architecture and embedding dimensionality.
| Method | Scoring | UCR | UEA | ||
|---|---|---|---|---|---|
| Near | Far | Near | Far | ||
| OE | MSP | 72.59 | 69.23 | 76.06 | 69.25 |
| Binary | k-NN | 16.17 | 5.67 | 16.90 | 13.01 |
| Maha++ | 13.28 | 3.07 | 13.27 | 7.36 | |
| HyperTF | k-NN | 15.18 | 4.46 | 7.62 | 7.40 |
| Maha++ | 12.56 | 1.90 | 4.94 | 4.21 | |
| k-NN | 15.01 | 4.34 | 6.98 | 5.30 | |
| HyperTF+MixOE | Maha++ | 12.54 | 1.92 | 4.88 | 3.03 |
| Method | Scoring | UCR | UEA | ||
|---|---|---|---|---|---|
| Near | Far | Near | Far | ||
| KNN+ | k-NN | 14.45 | 5.71 | 12.31 | 8.97 |
| SSD+ | Maha++ | 12.93 | 4.30 | 10.03 | 6.66 |
| HyperTF | k-NN Maha++ | 16.76 12.91 | 6.04 2.12 | 8.60 6.05 | 5.99 3.30 |
Table 1 reports OOD detection performance on the UCR and UEA benchmarks, spanning both near-OOD and a diverse set of far-OOD scenarios across multiple modalities. HyperTF with auxiliary outlier data achieves the strongest near-OOD detection results among all evaluated approaches on both UCR and UEA, and HyperTF variants obtain the best results in most far-OOD groups. The near-OOD scenarios consist of datasets from the same modality as the ID data, often sharing sensing, preprocessing, and temporal characteristics, and therefore primarily reflect semantic rather than lowlevel distribution shifts; strong performance in this regime indicates sensitivity to subtle within-modality deviations. For far-OOD detection, HyperTF provides more consistent performance across heterogeneous modalities; although SSD+ remains competitive in electrocardiogram (ECG) and Mahalanobis is strongest on UEA AUDIO, our approach improves most groups overall. In addition, HyperTF substantially enhances ID classification accuracy, achieving an F1-score of 82.53 on UCR compared to 78.88 for CIDER, and 81.74 on UEA versus 77.75 for CIDER, indicating that improved OOD robustness does not come at the expense of ID performance.
Auxiliary outlier data. We analyze the effect of incorporating auxiliary outlier data during training. Auxiliary datasets are selected to complement the evaluation setting: near-OOD performance is evaluated using models trained with far-OOD auxiliary data, and vice versa, ensuring that the model does not encounter the same type of distribution shift during both training and testing. Since far-OOD spans multiple modalities, its auxiliary pool is substantially larger than that used for near-OOD; as a result, far-OOD evaluation relies on a smaller and less diverse near-OOD auxiliary set. This setup reflects realistic scenarios in which available outlier data are limited and only weakly representative, motivating the additional evaluation of MixOE [Zhang et al., 2023] in combination with HyperTF to improve auxiliary data diversity during training.
Table 2 compares several ways of using auxiliary data: (i) a binary in-vs-outlier classifier; (ii) standard OE [Hendrycks et al., 2019]; and (iii) the proposed auxiliary contrastive regularizer with and without MixOE. The proposed contrastive formulation improves over the binary baseline across both UCR and UEA under matched scoring rules. On the UEA multivariate benchmark under near-OOD evaluation, the FPR@95 decreases from 6.05 without auxiliary data (Table 1) to 4.94 with auxiliary outliers, and further to 4.88 with MixOE. The benefit of MixOE is most pronounced for UEA far-OOD evaluation, where FPR@95 decreases from 4.21 to 3.03, indicating that increasing auxiliary data diversity is particularly beneficial when available outliers provide limited coverage.
Scoring functions. We next examine the interplay between our proposed training objective and post-hoc scoring functions. Table 3 compares HyperTF with representative supervised contrastive baselines under their standard scoring rules, namely k-NN for KNN+ and Maha++ for SSD+. Although SSD+ was originally evaluated with the Mahalanobis score, we adopt Maha++ for SSD+ in this study to ensure a fair comparison with HyperTF, and we find that this choice consistently improves SSD+ performance. Under the same backbone architecture and embedding dimensionality, HyperTF consistently attains lower FPR@95 on both UCR and UEA. Notably, when evaluated with the same k-NN scoring used by KNN+, HyperTF delivers markedly better performance on UEA, indicating that the observed gains are not driven solely by the choice of scoring function. Similarly, under Maha++ scoring, HyperTF matches or exceeds SSD+ on UCR and achieves clear improvements on UEA, particularly in far-OOD scenarios. Together, these results suggest that the proposed training objective induces representations with improved OOD separability, which translates into stronger detection performance under standard scoring schemes.
We further evaluate HyperTF with auxiliary data using standard post-hoc scoring methods (Section 2), including confidence-, distance-, and prototype-based approaches. Prototype-based scoring computes class means from ID embeddings and evaluates test inputs via cosine similarity to the nearest prototype. As shown in Table 4, distance-based methods, particularly Maha++, perform best across both near- and far-OOD regimes.
5.3 Ablation Studies
We study the contribution of individual components of HyperTF by progressively enabling each modeling choice and loss term. Table 5 presents a step-wise ablation that progressively enables the components of HyperTF, starting from a standard Euclidean softmax CE baseline in the time domain. Replacing Euclidean logits with hyperspherical CE based on cosine similarity to shared class prototypes yields a clear improvement in OOD detection. Subsequent additions of multi-view temporal crops and input projection further improve performance, with consistent gains observed in nearOOD detection using k-NN. As a non-parametric metric, k-NN provides a reliable indicator of representational quality, and its monotonic improvement across ablation steps reflects the progressive refinement of the learned embedding space. Auxiliary geometric regularizers have limited impact, with a compactness loss (1 - µ⊤c z) yielding only marginal gains, while separation loss [Ming et al., 2023] provides no additional benefit. The lower block of Table 5 extends the timedomain formulation by incorporating an fast Fourier transform (FFT)-based frequency-domain view, corresponding to the full LTF objective. Enforcing FFT consistency between time- and frequency-domain embeddings yields the strongest overall OOD detection performance.
| OOD Scores | ||||||||
|---|---|---|---|---|---|---|---|---|
| Set | Prototype | Energy | GEN | Maha | Maha++ | MaxLogit | MSP | kNN |
| Near | 94.11 / 12.57 | 54.34 / 72.38 | 49.56 / 80.45 | 96.43 / 7.61 | 98.23 / 4.94 | 47.39 / 84.02 | 46.85 / 84.57 | 96.83 / 7.62 |
| Far | 96.56 / 6.50 | 53.94 / 66.84 | 48.78 / 75.67 | 96.65 / 5.12 | 97.42 / 4.21 | 49.95 / 75.83 | 49.41 / 76.35 | 94.97 / 7.40 |
| Variant | Included | Near-OOD | Far-OOD | ||
|---|---|---|---|---|---|
| kNN | Maha++ | kNN | Maha++ | ||
| Euclidean CE | ✗ | 85.80 / 20.71 | 93.49 / 11.22 | 87.97 / 14.73 | 95.33 / 6.56 |
| Hyperspherical CE | ✓ | 92.86 / 11.64 | 94.58 / 9.05 | 93.98 / 8.35 | 95.78 / 5.90 |
| + Two Views (Crop & Resize) | ✓ | 92.91 / 11.87 | 94.74 / 8.83 | 93.75 / 8.61 | 95.78 / 6.07 |
| + Input Projection | ✓ | 95.69 / 10.15 | 97.63 / 5.87 | 95.60 / 7.21 | 98.17 / 3.57 |
| + Masking Projected Inputs | ✗ | 94.33 / 11.79 | 97.53 / 6.08 | 95.44 / 7.33 | 97.97 / 4.00 |
| + Compactness Loss (C) | ✗ | 95.51 / 10.80 | 97.55 / 5.92 | 96.12 / 6.70 | 98.34 / 3.25 |
| + Separation Loss (S) | ✗ | 93.78 / 12.46 | 97.28 / 6.54 | 95.71 / 7.16 | 98.24 / 3.43 |
| + FFT and TF Loss | ✓ | 95.89 / 8.95 | 97.47 / 6.94 | 96.55 / 5.25 | 97.78 / 3.35 |
| + FFT Consistency | ✓ | 95.92 / 7.94 | 97.47 / 6.19 | 96.60 / 4.87 | 98.03 / 2.96 |
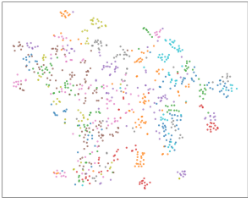
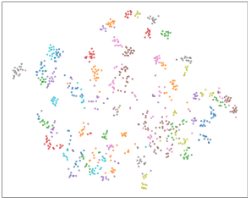
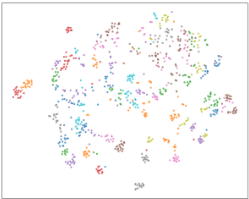
Figure 2 shows t-SNE visualizations of ID embeddings on the UEA Handwriting dataset. Moving from standard Euclidean CE to HyperTF results in visibly greater intra-class compactness and inter-class separation. Incorporating auxiliary outlier data further sharpens class boundaries, indicating additional regularization of the embedding space.
6 Conclusion
This paper investigated OOD detection for time-series data through the lens of hyperspherical representation learning. We introduced HyperTF, a dual-view hyperspherical framework that unifies temporal and frequency-domain representation learning within a shared angular decision space, combining domain-specific encoders with shared prototypebased supervision and cross-domain consistency regularization. Across the complete UCR and UEA archives under a cross-dataset evaluation protocol, the proposed approach consistently improved OOD detection performance under standard distance-based scoring rules while also maintaining strong ID classification accuracy. These results suggest that jointly modeling complementary temporal and spectral structure within a shared geometric embedding space provides a robust foundation for time-series OOD detection under realistic distribution shifts. More broadly, our findings highlight the importance of evaluating time-series OOD methods beyond intra-dataset label splits and toward benchmark settings that better reflect deployment-time variation across sensing conditions, domains, and data sources.
Contribution Statement
Willian T. Lunardi and Samridha Shrestha contributed equally to this work. Willian T. Lunardi is the corresponding author.
@inproceedings{ijcai2026p321,
  title     = {Learning Hyperspherical Time–Frequency Representations for Time-Series Out-of-Distribution Detection},
  author    = {Lunardi, Willian T. and Shrestha, Samridha and Andreoni, Martin},
  booktitle = {Proceedings of the Thirty-Fifth International Joint Conference on
               Artificial Intelligence, {IJCAI-26}},
  publisher = {International Joint Conferences on Artificial Intelligence Organization},
  editor    = {Diego Calvanese},
  pages     = {2888--2896},
  year      = {2026},
  month     = {8},
  note      = {Main Track},
  doi       = {10.24963/ijcai.2026/321},
  url       = {https://doi.org/10.24963/ijcai.2026/321},
}
TY - CPAPER TI - Learning Hyperspherical Time–Frequency Representations for Time-Series Out-of-Distribution Detection AU - Lunardi, Willian T. AU - Shrestha, Samridha AU - Andreoni, Martin T2 - Proceedings of the Thirty-Fifth International Joint Conference on Artificial Intelligence, IJCAI-26 PB - International Joint Conferences on Artificial Intelligence Organization PY - 2026 SP - 2888 EP - 2896 DO - 10.24963/ijcai.2026/321 UR - https://doi.org/10.24963/ijcai.2026/321 ER -Copied
Machine-readable versions of this paper, for tools and AI agents:





