
HGOOD: Hypergraph-enhanced Graph Contrastive Learning for Graph Out-of-Distribution Detection
Proceedings of the Thirty-Fifth International Joint Conference on Artificial Intelligence. Main Track. Pages 2563-2571.
https://doi.org/10.24963/ijcai.2026/285
Keywords
- Data Mining: Anomaly/outlier detection
- Data Mining: Mining graphs
- Machine Learning: Self-supervised Learning
Abstract
With the increasing application of graph learning advanced by deep learning, out-of-distribution (OOD) detection for graph-structured data has become an imperative challenge in the real world. Graph neural networks (GNNs) provide a promising solution for OOD detection. However, GNNs' core message-passing mechanism inherently relies on local neighborhood aggregation, and traditional graph structures only characterize pairwise node relations, failing to capture high-order associations and global patterns. Towards this end, in this paper, we propose a Hypergraph-enhanced graph contrastive learning framework for Graph Out-Of Distribution detection (termed HGOOD). Specifically, we construct two branches to mine graph semantics in a comprehensive manner. On the one hand, we employ a graph feature branch to encode neighborhood interactions via node-level and graph-level contrastive learning. On the other hand, we incorporate the hypergraph-global branch, which adaptively models graphs’ high-order global correlations. Building upon this, we introduce a cross-branch prototype contrast that aligns the captured graph patterns with their cross-branch clustering prototypes to enhance the semantic manifold of the in-distribution (ID) graph. Extensive experiments on benchmark datasets demonstrate that our HGOOD consistently outperforms prior methods. Our code is available at https://anonymous.4open.science/r/HGOOD-CFE2/.
- [Breunig et al., 2000] Markus M Breunig, Hans-Peter Kriegel, Raymond T Ng, and Jörg Sander. Lof: iden- tifying density-based local outliers. In Proceedings of the 2000 ACM SIGMOD international conference on Management of data, pages 93-104, 2000.
- [Cai et al., 2026] Tingyi Cai, Yunliang Jiang, Ming Li, Changqin Huang, Yujie Fang, Chengling Gao, and Zhon- glong Zheng. Hypergood: Towards out-of-distribution detection in hypergraphs. In Proceedings of the AAAI Conference on Artificial Intelligence, volume 40, pages 19817-19825, 2026.
- [Ding et al., 2026] Yuntai Ding, Tao Ren, Yiwei Fu, Yifan Wang, Haodong Zhang, Chong Chen, Wei Ju, Xiao Luo, and Xian-Sheng Hua. Hgood-d: Hyperbolic hierarchical exploration for graph out-of-distribution detection. IEEE Transactions on Knowledge and Data Engineering, 2026.
- [Feng et al., 2019] Yifan Feng, Haoxuan You, Zizhao Zhang, Rongrong Ji, and Yue Gao. Hypergraph neural net- works. In Proceedings of the AAAI conference on artificial intelligence, volume 33, pages 3558-3565, 2019.
- [Gilmer et al., 2017] Justin Gilmer, Samuel S Schoenholz, Patrick F Riley, Oriol Vinyals, and George E Dahl. Neural message passing for quantum chemistry. In International conference on machine learning, pages 1263-1272. Pmlr, 2017.
- [Hou et al., 2025] Yue Hou, He Zhu, Ruomei Liu, Yingke Su, Jinxiang Xia, Junran Wu, and Ke Xu. Structural en- tropy guided unsupervised graph out-of-distribution detec- tion. In Proceedings of the AAAI Conference on Artificial Intelligence, volume 39, pages 17258-17266, 2025.
- [Hu et al., 2020] Weihua Hu, Matthias Fey, Marinka Zitnik, Yuxiao Dong, Hongyu Ren, Bowen Liu, Michele Catasta, and Jure Leskovec. Open graph benchmark: Datasets for machine learning on graphs. Advances in neural informa- tion processing systems, 33:22118-22133, 2020.
- [Huang et al., 2015] Sheng Huang, Mohamed Elhoseiny, Ahmed Elgammal, and Dan Yang. Learning hypergraph- regularized attribute predictors. In Proceedings of the IEEE conference on computer vision and pattern recog- nition, pages 409-417, 2015.
- [Huang et al., 2025] Changqin Huang, Chengling Gao, Ming Li, Yongzhi Li, Xizhe Wang, Yunliang Jiang, and Xiaodi Huang. Correlation information enhanced graph anomaly detection via hypergraph transformation. IEEE transactions on cybernetics, 2025.
- [Jin et al., 2022] Wei Jin, Tong Zhao, Jiayuan Ding, Yozen Liu, Jiliang Tang, and Neil Shah. Empowering graph rep- resentation learning with test-time graph transformation. arXiv preprint arXiv:2210.03561, 2022.
- [Ju et al., 2024a] Wei Ju, Zhengyang Mao, Siyu Yi, Yi- fang Qin, Yiyang Gu, Zhiping Xiao, Yifan Wang, Xiao Luo, and Ming Zhang. Hypergraph-enhanced dual semi- supervised graph classification. In Proceedings of the International Conference on Machine Learning, pages 22594-22604, 2024.
- [Ju et al., 2024b] Wei Ju, Yifan Wang, Yifang Qin, Zhengyang Mao, Zhiping Xiao, Junyu Luo, Junwei Yang, Yiyang Gu, Dongjie Wang, Qingqing Long, et al. Towards graph contrastive learning: A survey and beyond. arXiv preprint arXiv:2405.11868, 2024.
- [Ju et al., 2025] Wei Ju, Siyu Yi, Yifan Wang, Zhiping Xiao, Zhengyang Mao, Hourun Li, Yiyang Gu, Yifang Qin, Nan Yin, Senzhang Wang, et al. A survey of graph neural net- works in real world: Imbalance, noise, privacy and ood challenges. IEEE Transactions on Pattern Analysis and Machine Intelligence, 48(3):3036-3055, 2025.
- [Junwei et al., 2024] He Junwei, Qianqian Xu, Yangbangyan Jiang, Zitai Wang, Yuchen Sun, and Qingming Huang. Hgoe: Hybrid external and internal graph outlier exposure for graph out-of-distribution detection. In Proceedings of the 32nd ACM International Conference on Multimedia, pages 1544-1553, 2024.
- [Liang et al., 2017] Shiyu Liang, Yixuan Li, and Rayadurgam Srikant. Enhancing the reliability of out-of-distribution image detection in neural networks. arXiv preprint arXiv:1706.02690, 2017.
- [Liu et al., 2008] Fei Tony Liu, Kai Ming Ting, and Zhi-Hua Zhou. Isolation forest. In 2008 eighth ieee international conference on data mining, pages 413-422. IEEE, 2008.
- [Liu et al., 2023] Yixin Liu, Kaize Ding, Huan Liu, and Shirui Pan. Good-d: On unsupervised graph out-of- distribution detection. In Proceedings of the sixteenth ACM international conference on web search and data mining, pages 339-347, 2023.
- [Lu et al., 2024] Haodong Lu, Dong Gong, Shuo Wang, Ja- son Xue, Lina Yao, and Kristen Moore. Learning with mixture of prototypes for out-of-distribution detection. arXiv preprint arXiv:2402.02653, 2024.
- [Ma et al., 2022] Rongrong Ma, Guansong Pang, Ling Chen, and Anton Van Den Hengel. Deep graph-level anomaly de- tection by glocal knowledge distillation. In Proceedings of the fifteenth ACM international conference on web search and data mining, pages 704-714, 2022.
- [Maaten and Hinton, 2008] Laurens van der Maaten and Ge- offrey Hinton. Visualizing data using t-sne. Journal of machine learning research, 9(Nov):2579-2605, 2008.
- [Manevitz and Yousef, 2001] Larry M Manevitz and Malik Yousef. One-class svms for document classification. Jour- nal of machine Learning research, 2(Dec):139-154, 2001.
- [Morris et al., 2020] Christopher Morris, Nils M Kriege, Franka Bause, Kristian Kersting, Petra Mutzel, and Mar- ion Neumann. Tudataset: A collection of bench- mark datasets for learning with graphs. arXiv preprint arXiv:2007.08663, 2020.
- [Neumann et al., 2016] Marion Neumann, Roman Garnett, Christian Bauckhage, and Kristian Kersting. Propagation kernels: efficient graph kernels from propagated informa- tion. Machine learning, 102(2):209-245, 2016.
- [Qiu et al., 2020] Jiezhong Qiu, Qibin Chen, Yuxiao Dong, Jing Zhang, Hongxia Yang, Ming Ding, Kuansan Wang, and Jie Tang. Gcc: Graph contrastive coding for graph neural network pre-training. In Proceedings of the 26th ACM SIGKDD international conference on knowledge discovery & data mining, pages 1150-1160, 2020.
- [Sehwag et al., 2021] Vikash Sehwag, Mung Chiang, and Prateek Mittal. Ssd: A unified framework for self-supervised outlier detection. arXiv preprint arXiv:2103.12051, 2021.
- [Shervashidze et al., 2011] Nino Shervashidze, Pascal Schweitzer, Erik Jan Van Leeuwen, Kurt Mehlhorn, and Karsten M Borgwardt. Weisfeiler-lehman graph kernels. Journal of Machine Learning Research, 12(9), 2011.
- [Sun et al., 2019] Fan-Yun Sun, Jordan Hoffmann, Vikas Verma, and Jian Tang. Infograph: Unsupervised and semi-supervised graph-level representation learning via mutual information maximization. arXiv preprint arXiv:1908.01000, 2019.
- [Veličković et al., 2018] Petar Veličković, William Fedus, William L Hamilton, Pietro Liò, Yoshua Bengio, and R Devon Hjelm. Deep graph infomax. arXiv preprint arXiv:1809.10341, 2018.
- [Wang et al., 2022] Yifan Wang, Yifang Qin, Yu Han, Mingyang Yin, Jingren Zhou, Hongxia Yang, and Ming Zhang. Ad-aug: Adversarial data augmentation for coun- terfactual recommendation. In Joint European confer- ence on machine learning and knowledge discovery in databases, pages 474-490. Springer, 2022.
- [Wang et al., 2024] Luzhi Wang, Dongxiao He, He Zhang, Yixin Liu, Wenjie Wang, Shirui Pan, Di Jin, and Tat-Seng Chua. Goodat: Towards test-time graph out-of-distribution detection. In Proceedings of the AAAI Conference on Arti- ficial Intelligence, volume 38, pages 15537-15545, 2024.
- [Wang et al., 2025a] Yifan Wang, Hourun Li, Yue Ling, Zhiping Xiao, Jia Yang, Changling Zhou, Wei Ju, Ming Zhang, and Xiao Luo. Dance: Dual unbiased expan- sion with group-acquired alignment for out-of-distribution graph fairness learning. In Forty-second International Conference on Machine Learning, 2025.
- [Wang et al., 2025b] Yifan Wang, Yangzi Yang, Shuai Li, Yutao Xie, Zhiping Xiao, Ming Zhang, and Wei Ju. Gmr-rec: Graph mutual regularization learning for multi-domain recommendation. Information Sciences, 703:121946, 2025.
- [Wang et al., 2026] Yifan Wang, Haodong Zhang, Zhiping Xiao, Yusheng Zhao, Siyu Yi, Nan Yin, Xinwang Liu, Ming Zhang, and Wei Ju. Kegod: Kernel-enhanced latent substructure learning for graph out-of-distribution detec- tion. In Proceedings of the ACM Web Conference 2026, pages 1160-1170, 2026.
- [Wu et al., 2023] Qitian Wu, Yiting Chen, Chenxiao Yang, and Junchi Yan. Energy-based out-of-distribution de- tection for graph neural networks. arXiv preprint arXiv:2302.02914, 2023.
- [Xia et al., 2022] Lianghao Xia, Chao Huang, Yong Xu, Ji- ashu Zhao, Dawei Yin, and Jimmy Huang. Hypergraph contrastive collaborative filtering. In Proceedings of the 45th International ACM SIGIR conference on research and development in information retrieval, pages 70-79, 2022.
- [Xu et al., 2018] Keyulu Xu, Weihua Hu, Jure Leskovec, and Stefanie Jegelka. How powerful are graph neural net- works? arXiv preprint arXiv:1810.00826, 2018.
- [You et al., 2020] Yuning You, Tianlong Chen, Yongduo Sui, Ting Chen, Zhangyang Wang, and Yang Shen. Graph con- trastive learning with augmentations. Advances in neural information processing systems, 33:5812-5823, 2020.
- [Yu et al., 2012] Jun Yu, Dacheng Tao, and Meng Wang. Adaptive hypergraph learning and its application in image classification. IEEE Transactions on Image Processing, 21(7):3262-3272, 2012.
- [Zeng et al., 2025] Jiayi Zeng, Tao Ren, Changhu Wang, Yi- fan Wang, Wei Ju, Zhipeng Sun, and Xiao Luo. Date: Dual prompt learning with information bottleneck for graph out-of-distribution generalization. In Proceedings of the 33rd ACM International Conference on Multimedia, pages 8920-8929, 2025.
- [Zhang et al., 2026] Haodong Zhang, Tao Ren, Changhu Wang, Yifan Wang, Wei Ju, Huaizhi Tang, Junyu Luo, Zimo Wang, Ziyue Qiao, Xian-Sheng Hua, et al. Disco: Diffusion-guided unbiased discriminative learning for un- supervised graph domain adaptation. In Proceedings of the 32nd ACM SIGKDD Conference on Knowledge Discovery and Data Mining V. 1, pages 1892-1903, 2026.
- [Zhao and Akoglu, 2023] Lingxiao Zhao and Leman Akoglu. On using classification datasets to evaluate graph outlier detection: Peculiar observations and new insights. Big Data, 11(3):151-180, 2023.
- [Zhu et al., 2022] Boqing Zhu, Kele Xu, Changjian Wang, Zheng Qin, Tao Sun, Huaimin Wang, and Yuxing Peng. Unsupervised voice-face representation learn- ing by cross-modal prototype contrast. arXiv preprint arXiv:2204.14057, 2022. IJCAI
References were extracted automatically from the PDF and may contain errors.
Full text extracted automatically from the PDF; figures, tables and equations may differ. The PDF is the version of record.
1 Introduction
Graphs are widely present in scenarios such as social networks, knowledge graphs, recommendation systems, etc [Ju et al., 2025]. As graphs lie in non-Euclidean domains, conventional Euclidean representation learning struggles to exploit topology, motivating graph neural networks (GNNs) that learn expressive node and graph representations by aggregating neighborhood information. However, real deployments often fail to satisfy the closed-world assumption, and distribution shifts can expose GNNs to unseen concepts or structures [Zeng et al., 2025; Wang et al., 2025a; Zhang et al., 2026], raising reliability and safety concerns. In this setting, out-of-distribution (OOD) detection assigns scores to identify samples outside the training distribution for rejection or risk control, while anomaly detection (AD) targets objects that deviate from prevailing patterns in a graph or a graph collection. In this work, we view graph AD as a special case of graph OOD detection and use a unified OOD score for both tasks. Both quantify distribution deviation and share a common basis in representation learning and score modeling.
∗Corresponding author.
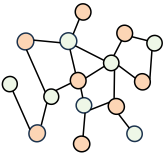
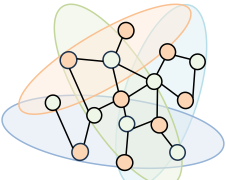
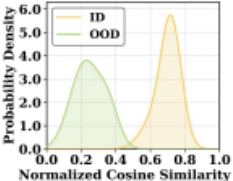
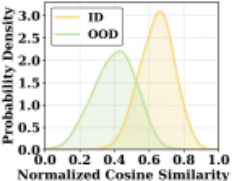
Figure 1: ID/OOD Similarity Distributions. (a) Traditional graphs capture pairwise correlations, while (b) hypergraphs model highorder relationships. (c) and (d) present the similarity distributions of the BBBP/BACE datasets. (c) Methods without hypergraphs suffer from significant distribution overlap. (d) Incorporating hypergraphs yields distinct discriminative margins, enhancing detection.
Recent graph OOD detectors typically learn graph representations with a GNN trained on in-distribution (ID) data and then compute an OOD score to separate ID from OOD samples. Generative or debiased methods model the graph data generation process or suppress spurious correlations to distinguish distribution shifts better [Hou et al., 2025]. Due to label scarcity, self-supervised methods, especially contrastive learning, learn discriminative representations from unlabeled data, improving OOD separability [Lu et al., 2024].
Despite recent progress, we argue that robust graph OOD detection remains challenging due to the following two key issues: (i) Ignoring higher-order node dependencies. As shown in Figure 1, GNNs primarily rely on neighborhood aggregation through the traditional modeling of pairwise relations. However, in real-world graphs, i.e., molecular graphs, atoms exhibit complex interactions and long-range dependencies within the molecule. Underrepresenting these high-order semantic structures could lead to overly homogeneous molecular representations that are difficult to distinguish. (ii) Underexploring the vast OOD manifold. The space of OOD graphs is huge and diverse, encompassing a wide range of high-order semantic structures that differ significantly from ID data. This complexity makes it difficult to effectively model the OOD manifold using instance-level signals alone.
Towards this end, in this paper, we aim to investigate hypergraph modeling as a principled way to encode group-wise node interactions within a graph, which naturally models high-order relationships via hyperedges that connect multiple nodes, providing richer structural cues than conventional graphs. In particular, we propose HGOOD, a unified detection framework with two complementary branches, graph feature and hypergraph-global. HGOOD enables end-to-end graph-level OOD detection and AD via a unified OOD score, and we show that incorporating hypergraph-based global context consistently improves detection performance. To capture cross-sample semantics, we employ prototype-based contrastive learning with clustering to sharpen the ID cluster structure. Moreover, we introduce a cross-branch prototype contrastive objective to jointly align local and global prototypes, yielding more separable representations and a more discriminative detection score.
In summary, we briefly outline the main contributions of this paper as follows:
- Conceptual: We introduce hypergraph-based global modeling for graph OOD detection to capture high-order node relationships beyond pairwise connections.
- Methodological: We propose a novel framework HGOOD, unifying graph-feature and hypergraph-global branches. By organizing representations into prototypes and aligning prototypes across the two branches, HGOOD makes the unified OOD score more discriminative.
- Experimental: We conduct comprehensive experiments on public datasets to evaluate the effectiveness of HGOOD. The results demonstrate the superiority of our framework.
2 RelatedWork
2.1 Graph Out-Of-Distribution Detection
OOD detection aims to identify test inputs that do not belong to the model's training distribution, and is a key technique for improving the robustness of machine learning systems[Wang et al., 2026; Ding et al., 2026]. Numerous OOD detection techniques have been proposed for both vision and language modalities. ODIN [Liang et al., 2017] improves ID and OOD separability via post-hoc scoring. GOODAT [Wang et al., 2024] offers unsupervised data-centric graph AD via subgraph extraction and information bottleneck. However, graph data jointly encodes node and edge attributes and topology, and distribution shifts may arise from changes in structure, features, or their interactions, making these criteria nontrivial to transfer to graph settings. Existing graph OOD studies can be broadly grouped into local view and global view. GNNSafe [Wu et al., 2023] directly scores samples using a pretrained GNN to identify OOD nodes. GOOD-D [Liu et al., 2023] leverages a global perspective through contrastive learning and perturbation-free graph augmentation.
2.2 Hypergraph Learning
Hypergraphs generalize pairwise edges to hyperedges that connect multiple nodes, providing a natural representation for group-wise interactions and higher-order dependencies [Ju et al., 2024a]. Early hypergraph neural networks, such as HGNN [Feng et al., 2019], enable representation learning via effective message passing between nodes and hyperedges. Beyond modeling a single graph, hypergraph learning has also been adopted to capture cross-entity interaction patterns in large-scale systems. HCCF [Xia et al., 2022] incorporates a learnable hypergraph structure and contrastive objectives to distill latent collaborative dependencies. Hypergraphbased designs have also been explored in AD, where CIEGAD [Huang et al., 2025] enhances correlation modeling to alleviate anomaly camouflage. It remains underexplored how to learn hypergraph structures capturing global crosssample high-order dependencies under practical computation and memory budgets, and how to convert such relations into discriminative scoring signals for graph OOD detection.
3 Notations and Preliminaries
3.1 Notations
Definition 1. For an undirected graph with n vertices, we represent it as G = (V, E,X), where: V = {v1, v2, . . . , vn} is the node set; E ⊆ V×V denotes edges linking distinct node pairs; X ∈ Rn×df is the node feature matrix with df the node feature dimensionality; and A ∈ Rn×n is the adjacency matrix. The graph can be succinctly rewritten as G = (A, X). Definition 2. A hypergraph is an extension of a standard graph by allowing an edge to connect more than two vertices. Formally, a hypergraph is denoted as GH = (V, EH), where the vertex set V is identical to that of a graph G, EH = {e1, e2, ..., e|E|} is a set of hyperedges. Each hyperedge can contain any number of vertices and is essentially a subset of the vertex set V.
3.2 Unsupervised graph-level OOD detection
We consider an unlabeled ID graph dataset G in = {Gin 1 ,Gin 2 , . . . ,Gin K }, where each graph is drawn from a certain distribution P in . Correspondingly, we define the OOD graph set G out = {Gout 1 ,Gout 2 , . . . ,Gout L }, sampled from a distinct distribution P out that does not overlap with P in .
Given an arbitrary graph G, our task is to determine which distribution G originates from (i.e., P in or P out ). To this end, we aim to learn a scoring model h(·) that outputs an OOD detection score s = h(G) for input graph G, where a larger s indicates G is more likely to be an OOD sample. Our model is trained on G id train ⊂ G in and evaluated on G id test ∪ G ood test (Note that G id test ∩ G id train = ∅, G id test ⊂ G in , and G ood test ⊂ G ood ).
3.3 Hypergraph message-passing
Hypergraph message-passing is a core mechanism of Hypergraph Neural Networks (HyperGNNs) for capturing highorder structural dependencies [Xia et al., 2022]. Its key formulation is defined as:
where Λl is the node embedding in l-th layer, ρ is the dependency matrix, Γ is the hyperedge embedding, and σ is the LeakyReLU mapping. We enhance the architecture by stacking t-size hyperGNN layers, updating node representations via hyperedge propagation:
where ˜Λl denotes the refined node representation after hypergraph propagation, ψt (·) represents the t-layer hyperedge embedding encoding function and P is a trainable parametric matrix for embedding projection.
4 The ProposedModel
In this section, we introduce the HGOOD framework, which captures graph semantic information from both the graph feature branch and the hypergraph global branch. HGOOD consists of three core modules: perturbation-free dualbranch graph augmentation, hypergraph-enhanced graph dependency learning, and hierarchical cross-branch contrastive learning. Figure 2 illustrates its overall architecture.
4.1 Perturbation-free Dual-branch Graph Augmentation
Within the contrastive learning paradigm, data augmentation is widely adopted to construct diverse graph views [Wang et al., 2022; Wang et al., 2025b; Ju et al., 2024b]. Traditional approaches, however, mostly rely on random disruptions, such as edge perturbation [Veliˇckovi´c et al., 2018], node deletion [You et al., 2020], subgraph extraction [Qiu et al., 2020], etc. Such methods risk generating undesirable OOD graphs from original ID graphs, impairing the model's sensitivity to genuine OOD data. Drawing on the GOOD-D framework [Liu et al., 2023], we construct two independent views derived from node features and global graph topology. For a given graph G, the feature view Gb = (A,X) is formulated by fusing node features with the corresponding adjacency matrix. In parallel, we leverage a perturbation-free augmentation strategy to construct the structure view Gs = (A,Q), where Q denotes a topology-aware matrix formed by concatenating random walk diffusion encodings and Laplacian positional encodings. For each node vi, its corresponding encoding in Q is defined as qi = [q(rw) i ∥q(lp) i ], where q(rw) i represents the random walk diffusion encoding and q(lp) i denotes the Laplacian positional encoding. To be specific, the randomwalk diffusion encoding is q(rw) i = [Sii,S2 ii , . . . , Sr ii ] ∈ Rr , where S = ˜D-1A denotes the random walk transition matrix, ˜D represents the node degree matrix, and r is the dimension of the structural encoding. The Laplacian positional encoding is formulated as q(lp) i =∆ii, where ∆= I - ˜D-1/2A ˜D-1/2 and I is the identity matrix. By integrating these two complementary structural encodings, the proposed strategy generates highly discriminative graph representations that are wellsuited for OOD detection tasks.
4.2 Hypergraph-enhanced Graph Dependency Learning
For graph OOD detection, GNNs yield expressive node and graph representations yet are confined to local neighborhood aggregation via message-passing[Gilmer et al., 2017], failing to capture high-order substructural patterns. Hypergraphs[Feng et al., 2019] naturally model high-order node dependencies and complex interactions, enabling the model to fully exploit graph data's inherent rich structural information, thereby enhancing representation discriminability and boosting OOD detection efficacy.
Graph Feature Dependency Learning. To effectively capture the inherent feature dependencies within graph data, we perform representation learning via a feature-specific GNN encoder Fb(·), following the view construction paradigm of GOOD-D[Liu et al., 2023]. We adopt GIN[Xu et al., 2018] (with ϵ = 0 for simplicity) as the backbone encoder, as it achieves maximum expressiveness for graph-structured data among Weisfeiler-Lehman equivalent GNNs. The message passing rule of Fb(·) at the l-th layer is formulated as:
where MLP(b,l) denotes a 2-layer multilayer perceptron specific to the l-th layer of Fb(·), h(b,l) i represents the embedding of node vi at the l-th layer of Fb(·), and N(vi) denotes the set of first-order neighbors of vi. We set h(b,0) i = xi for Fb(·); given an L-th layer, the final feature-view node embedding of node vi is acquired by concatenating the embeddings at each layer, i.e., h(b) i = [h(b,1) i ∥ . . . ∥h(b,L) i ].
After obtaining feature-view node embeddings, we use a readout function to derive the graph embedding:
where VG is the node set of graph G, and h(b) G is the featureview embedding of G. The structure-view node and graph embeddings h(s) G are computed similarly to Eq. 3 and Eq. 4. While the graph feature branch captures local dependencies, it fails to model high-order correlations among nodes, motivating hypergraph structure learning.
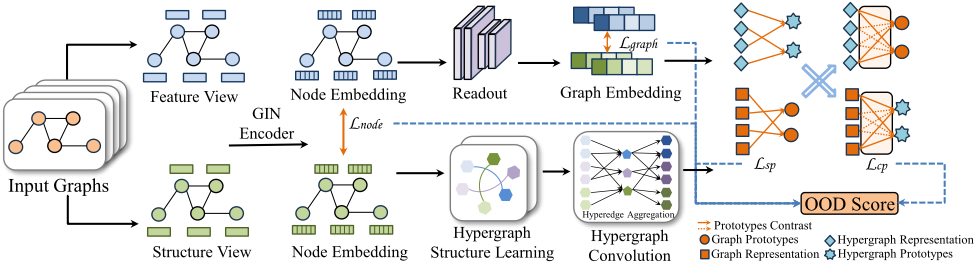
Hypergraph Structure Dependency Learning. Existing methods often construct hypergraphs based on predefined criteria, such as distances [Yu et al., 2012] and attributes [Huang et al., 2015]. However, such fixed structures are susceptible to noise and data sparsity, failing to adaptively capture implicit high-order dependencies in graph structures. To address these issues, we parameterize a learnable hypergraph structure, enabling it to dynamically excavate inherent highorder association patterns of ID samples. Additionally, directly learning a dense hypergraph matrix incurs enormous parameter scales and computational costs. Thus, we employ a low-rank strategy to improve the modeling efficiency of the hypergraph structure ρ ∈ Rn×c , where n = |VG| is the node count and c is the predefined hyperedge count, calculated as:
where E = [h(b) ∥ h(s) ] ∈ Rn×2d is the concatenation of the final node embeddings from both views, and W ∈ R2d×c is a learnable weight matrix.
Hypergraph Convolution. Having gained the learnable hypergraph, we can effectively capture higher-order dependencies among nodes. To achieve this end, we design a hypergraph convolution to learn enhanced node representations. First, we initialize the hypergraph node embedding matrix as E, setting Λ0 = E. The embedding update rule for the l-th (l > 1) hypergraph convolution layer is computed as follows:
where ˜Λl ∈ Rn×2d , and all the symbols are defined in Eq. 2.
After l hypergraph convolutions, the updated node representations encapsulate high-order semantic features. Let ˜Λ(l,i) denote row i of the node representation matrix ˜Λl; we compute the global hypergraph embedding via sum pooling:
4.3 Hierarchical Cross-branch Contrastive Learning
In the preceding sections, we have obtained node embeddings (h(b) i , h(s) i ), graph embeddings (h(b) G , h(s) G ), and hypergraph embeddings (hglobal G ) from graph-feature and hypergraphglobal branches. Our core idea is to leverage contrastive learning to capture the multi-grained structural patterns and semantic consistency of graph data. Most existing methods conduct contrast at a single scale or single branch, failing to exploit the synergy between local and high-order dependencies. To address this issue, we propose a Hierarchical CrossBranch Contrastive Learning scheme that operates at three levels, node, graph, and cross-branch prototype, to consolidate intra-branch dependency consistency and inter-branch semantic alignment.
Node and Graph-level Contrast. To fully capture the local explicit dependencies and intra-view semantic consistency of the graph-feature branch, we design node and graph-level approaches to mine multi-grained patterns.
For capturing node-centric intrinsic patterns and exploiting fine-grained local features of the graph-feature branch, we introduce node-level contrast. Specifically, to maximize the consistency of embeddings across distinct views for the same node, we feed h(b) i and h(s) i into an MLP to map them to a shared node embedding space, generating the transformed embeddings z(b) i and z(s) i . We define the corresponding contrastive loss as follows:
where B is a training batch with multiple graph samples, VGj denotes the node set of graph Gj , τ is the temperature parameter, ⟨·, ·⟩ denotes the cosine similarity between two vectors, and ℓ (z(s) i , z(b) i ) is calculated similarly to ℓ (z(b) i , z(s) i ).
To complement node-level contrastive learning, we design graph-level contrast to capture coarse-grained characteristics overlooked by focusing only on individual nodes in the graphfeature branch. Similar to the node-level contrastive learning, we first map graph embeddings to the graph embedding space using an MLP, which generates z(b) Gi and z(s) Gi as the corresponding outputs. The contrastive learning loss is as follows:
where ℓ (z(b) Gi , z(s) Gi ), ℓ (z(s) Gi , z(b) Gi ), and all other symbols are analogous to those defined in Eq. 8.
Cross-branch Prototype Contrast. Cross-branch prototype contrastive learning aims to capture intra-branch shared patterns of graph/hypergraph samples, exploit their intrinsic clustering structure and global distribution, enhance crossbranch semantic consistency, and guide the model to learn more discriminative graph embeddings. Specifically, we generate two types of prototypes via K-means clustering [Zhu et al., 2022]: for each graph sample Gi, we concatenate its features h(b) Gi and h(s) Gi , project the vector into group-space embedding zGi , and perform K-means clustering on all zGi to obtain the local prototype set C local = {clocal k }Kk=1 (with clocal k as the cluster's average group-space embedding). We derive the global prototype set C global = {cglobal t }Kt=1 similar to clocal k on hypergraph embedding. The sample-prototype contrastive loss maximizes the similarity between each sample and its local prototype, formulated as follows:
where clocal k is the local prototype corresponding to the graph sample Gi; τk and τl are the concentration level-based temperatures that are positively correlated with the squared deviation of the k-th and l-th local clusters, respectively. Subsequently, we match the most similar global prototype cglobal m(k) for each local prototype clocal k via cosine similarity, and the matching relationship is defined as:
The cross prototype contrastive loss is used to pull matched local and global prototypes close and push unmatched ones apart, which is calculated as:
4.4 Overall Optimization and OOD Scoring
Finally, the total loss of Cross-branch prototype contrast is the weighted sum of the sample-prototype contrastive loss and the cross-prototype contrastive loss:
Throughout the model's training iteration process, we integrate the standard deviation of predictive errors into the training pipeline to dynamically and adaptively balance the contributions of local and global information representations. This built-in adaptive weighting mechanism automatically distributes optimal weight coefficients to both the loss components and the score components throughout the training workflow. To be more explicit, the comprehensive aggregate loss for model training is derived and expressed via the following mathematical formulation:
where σn, σg, and σp denote the standard deviations of the predictive errors corresponding to each respective level, while α ≥ 0 is a hyper-parameter that governs the intensity of the model's self-adaptive mechanism. At the inference stage, we implement z-score normalization to balance the scores generated across the multiple distinct hierarchical levels of the model for the OOD detection, formulated as:
where µn, µg , and µp denote the mean values of the predictive errors from training samples, with each corresponding to a distinct hierarchical level of the model. It is noteworthy that both µ and σ can be calculated from the final training epoch, with no additional computational overhead or complexity.
5 Experiments
5.1 Experimental Setup
Datasets. For OOD detection tasks, our experiments utilize 10 dataset pairs from the TU dataset [Morris et al., 2020], and OGB [Hu et al., 2020]. In line with GOOD-D [Liu et al., 2023], 90% of ID graphs serve as training data, the remaining 10% are included in the test set, and an equal count of OOD graphs are added to form a balanced and challenging evaluation scheme. Moreover, we perform anomaly detection experiments on 15 TU benchmark datasets [Morris et al., 2020], in which minority or true anomalous samples are labeled as outliers, and all other samples are considered normal.
Baselines. We compared HGOOD with 18 mainstream baseline methods, covering four categories: Non-deep Twostep Methods, including methods that combine WeisfeilerLehman (WL) kernel [Shervashidze et al., 2011] or propagation kernel (PK) [Neumann et al., 2016] feature extractors with LOF [Breunig et al., 2000], OCSVM [Manevitz and Yousef, 2001], or isolation forest (iF) [Liu et al., 2008] detectors; Deep Two-step Methods, including methods that follow the same pipeline, combining InfoGraph [Sun et al., 2019] or GraphCL [You et al., 2020] deep self-supervised feature extractors with iF or Mahalanobis distance (MD)[Sehwag et al., 2021] detectors; End-to-end Methods, which include OCGIN [Zhao and Akoglu, 2023], GLocalKD [Ma et al., 2022], GOOD-D and GOOD-Dsim[Liu et al., 2023], HGOE [Junwei et al., 2024], and HyperGOOD [Cai et al., 2026]; Test-time and Data-centric Methods, namely GTrans [Jin et al., 2022] and GOODAT [Wang et al., 2024].
Evaluation and Implementation. For a comprehensive assessment, we adopt the widely used Receiver Operating Characteristic Area Under the Curve (AUC) as the evaluation metric for OOD detection. Experiments are repeated three times, with results reported as the mean AUC ± standard deviation. For our method, we set the critical hyperparameter cluster number K ranging from [2, 30], balance coefficient
| ID dataset | BZR | PTC-MR | AIDS | ENZYMES | IMDB-M | Tox21 | FreeSolv | BBBP | ClinTox | Esol | |
|---|---|---|---|---|---|---|---|---|---|---|---|
| OOD dataset | COX2 | MUTAG | DHFR | PROTEIN | IMDB-B | SIDER | ToxCast | BACE | LIPO | MUV | A.R |
| PK-LOF | 42.22±8.39 | 51.04±6.04 | 50.15±3.29 | 50.47±3.87 | 48.03±2.53 | 51.30±1.71 | 49.16±3.70 | 53.10±2.07 | 50.00±2.17 | 50.82±1.48 | 15.9 |
| PK-OCSVM | 42.55±8.26 | 49.71±6.58 | 50.17±3.30 | 50.46±2.78 | 48.07±2.41 | 51.33±1.81 | 48.82±3.29 | 53.05±2.10 | 50.06±2.19 | 51.00±1.33 | 15.8 |
| PK-IF | 51.66±1.62 | 53.29±4.33 | 51.10±1.47 | 51.66±2.09 | 50.28±2.47 | 49.97±1.58 | 51.28±1.87 | 51.47±1.93 | 51.29±1.10 | 51.26±1.31 | 13.7 |
| WL-LOF | 48.49±6.20 | 54.31±8.98 | 50.77±2.83 | 52.77±4.67 | 52.67±4.50 | 51.82±0.82 | 52.47±2.23 | 52.80±1.31 | 50.81±3.40 | 50.83±3.51 | 13.0 |
| WL-OCSVM | 49.16±4.51 | 53.31±7.57 | 50.98±2.71 | 51.77±2.21 | 51.38±2.39 | 51.08±1.46 | 50.38±3.81 | 52.85±2.00 | 50.77±3.69 | 50.97±1.65 | 13.8 |
| WL-IF | 50.22±2.49 | 51.43±2.02 | 50.10±0.44 | 51.15±2.01 | 51.07±2.25 | 50.29±0.96 | 52.60±2.38 | 50.78±0.75 | 50.11±2.17 | 50.61±1.96 | 15.2 |
| InfoGraph-LOF | 63.17±9.74 | 51.43±5.19 | 93.10±1.35 | 60.00±1.83 | 58.73±1.96 | 56.28±0.81 | 56.92±1.69 | 53.68±2.90 | 48.51±1.87 | 54.16±5.14 | 10.8 |
| InfoGraph-MD | 60.00±6.77 | 50.86±4.49 | 92.02±1.11 | 65.25±3.51 | 58.36±1.65 | 59.97±0.97 | 55.05±2.46 | 70.49±4.63 | 48.12±0.72 | 77.21±4.09 | 10.2 |
| GraphCL-IF | 81.14±3.81 | 50.79±3.80 | 69.20±1.267 | 51.33±2.27 | 51.97±1.14 | 56.81±2.06 | 58.55±1.71 | 59.01±1.58 | 47.84±5.92 | 62.15±1.61 | 11.9 |
| GraphCL-MD | 83.64±6.00 | 73.03±2.38 | 93.75±2.13 | 52.87±6.11 | 70.90±2.73 | 58.30±1.52 | 60.31±5.24 | 75.72±1.54 | 51.58±3.64 | 78.73±1.40 | 7.2 |
| GTrans | 55.17±5.04 | 62.38±2.36 | 60.12±1.98 | 49.94±5.67 | 51.55±2.90 | 61.67±0.73 | 50.81±3.03 | 64.02±2.10 | 58.54±2.38 | 76.31±3.85 | 11.0 |
| GOODAT | 82.16±0.15 | 81.84±0.57 | 96.43±0.25 | 66.29±1.54 | 79.03±0.03 | 68.92±0.01 | 68.83±0.02 | 77.07±0.03 | 62.46±0.54 | 85.91±0.27 | 4.4 |
| OCGIN | 76.64±1.77 | 80.38±6.84 | 86.01±6.59 | 57.67±2.96 | 67.93±3.86 | 46.50±1.66 | 59.06±4.78 | 61.21±8.12 | 49.43±4.13 | 54.04±5.50 | 10.2 |
| GLocalKD | 75.75±5.99 | 70.63±3.54 | 93.67±1.24 | 57.18±2.03 | 72.85±4.35 | 66.28±0.98 | 64.82±3.31 | 73.15±1.26 | 55.71±3.81 | 86.83±2.35 | 6.9 |
| GOOD-Dsmp | 93.00±3.20 | 78.43±2.67 | 98.91±0.41 | 61.89±2.94 | 79.71±1.19 | 65.30±1.27 | 70.18±2.75 | 81.96±1.97 | 66.13±2.98 | 91.39±0.46 | 4.4 |
| GOOD-D | 94.99±2.25 | 81.21±2.65 | 99.07±0.40 | 61.84±4.51 | 79.97±1.09 | 66.50±1.35 | 80.43±3.43 | 82.51±2.58 | 69.18±3.61 | 91.52±0.70 | 3.3 |
| HGOE | -- | -- | 99.28±0.34 | 64.44±5.19 | 81.74±2.25 | 68.24±0.60 | 82.89±2.33 | 83.46±1.79 | 70.09±1.52 | 92.64±2.44 | -- |
| HyperGOOD | 97.36±0.42 | 90.36±2.28 | 99.12±0.05 | 66.72±1.05 | 80.09±0.38 | 67.07±0.16 | 78.49±1.08 | 83.08±0.26 | 71.61±1.89 | 91.33±0.66 | 2.4 |
| HGOOD | 98.00±0.62 | 91.96±3.14 | 99.38±0.09 | 67.38±2.30 | 81.90±0.98 | 68.48±0.10 | 80.78±0.30 | 84.27±1.60 | 75.87±1.25 | 92.93±0.77 | 1.1 |
α spanning from 0 to 1, hyperedge number C varying between [16, 64], and temperature parameter τ within the range of [0, 1] for different datasets. For all the baselines, we employ the same experimental settings and obtain results using the optimal parameters presented in the method.
5.2 Performance on OODDetection
We conduct a comparative evaluation of our proposed method against 18 existing competing methods, with all AUC results documented in Table 1. The following observations are obtained from an analysis of this table:
- HGOOD achieves the best performance on 8 dataset groups and ranks second on the remaining ones. It also attains the top average rank among all methods. These results demonstrate the effectiveness of HGOOD in detecting OOD samples from various graph data.
- Compared to GOOD-D, our approach shows overall superiority across all datasets. This indicates hypergraphs better capture higher-order collective correlations within graph structures and enhance global topological representations, while leveraging cross-branch prototype contrastive learning improves the consistency of semantic representations across different branches and boosts model robustness, bringing greater advantages in OOD detection tasks.
- While HGOOD is not the top performer on Tox21-SIDER and FreeSolv-ToxCast, it remains highly competitive. As Table 1 shows, this may stem from their high edge density, which obscures fine-grained local structural differences between ID and OOD graphs and thus slightly impairs the discriminability of graph feature prototypes.
5.3 Performance on Anomaly Detection
To verify the potential applicability of the HGOOD framework in graph AD tasks, we adopt the benchmark experimental protocol proposed in [Liu et al., 2023] and conduct anomaly detection experiments on 15 datasets, with the corresponding results summarized in Table 2. The following observations are obtained from an analysis of this table:
- Our experimental results confirm that HGOOD achieves statistically significant gains over all baselines on this task. This improvement stems from its unique ability to model high-order global graph correlations, which substantially boosts anomalous data detection efficacy.
- We observe that HGOOD underperforms on the DD dataset. This stems fromDD's unique inherent topological and node attribute characteristics, which do not align well with the high-order modeling design of our hypergraph framework.
5.4 Ablation Study
Our HGOOD leverages a multi-scale contrastive loss paradigm consisting of node-level Ln, graph-level Lg , and cross-branch prototype Lp components. To dissect the efficacy of each key module and validate the framework's rationality, we conduct thorough ablation experiments, with results tabulated in Table 3. Note that in the table's Based column, '✓' denotes the hypergraph-global branch adopts HGNN for 'Lp', '×' indicates GNN is used. Three key observations can be drawn:
- First, our full model performs best across all dataset pairs. This observation validates the efficacy of Hierarchical Cross-branch Contrastive Learning for OOD detection.
- Second, on datasets like AIDS/DHFR, combining Lp with Lg or Ln underperforms either alone. Since these datasets rely on local-global structural synergy, and Lp's forced prototype alignment causes irrational compromises with insufficient feature learning, degrading representation quality.
- Third, GNN-based setups lag behind HGNN-based counterparts under the same loss settings, verifying HGNN's superiority in capturing high-order dependencies to generate more discriminative representations for OOD detection.
5.5 Hyperparameter Analysis
Here, we conduct a sensitivity analysis on two key hyperparameters on 4 datasets to verify their impact on performance. Cluster number K. To further investigate HGOOD's sensitivity to the hyperparameter K, we vary K from 2 to 30 across four representative ID/OOD datasets (Fig. 3a). Optimal K values differ across datasets, which is linked to the inherent characteristics of the ID dataset. Notably, HGOOD is relatively insensitive to K, as moderate values achieve steady superior performance across datasets with minimal tuning.
| Method | PK-IF | WL-OCSVM | InfoGraph-IF | GraphCL-IF | OCGIN | GLocalKD | GOOD-D | GOODAT | HyperGOOD | HGOOD |
|---|---|---|---|---|---|---|---|---|---|---|
| PROTEINS-full | 60.70±2.55 | 51.35±4.35 | 57.47±3.03 | 60.18±2.53 | 70.89±2.44 | 77.30±5.15 | 71.97±3.86 | 74.61±4.30 | 77.71±1.26 | 78.03±1.30 |
| ENZYMES | 51.30±2.01 | 55.24±2.66 | 53.80±4.50 | 53.60±4.88 | 58.75±5.98 | 61.39±8.81 | 63.90±3.69 | 69.60±3.52 | 62.16±2.81 | 73.60±9.07 |
| AIDS | 51.84±2.87 | 50.12±3.43 | 70.19±5.03 | 79.72±3.98 | 78.16±3.05 | 93.27±4.19 | 97.28±0.69 | 96.46±1.22 | 96.49±0.67 | 99.23±0.76 |
| DHFR | 52.11±3.96 | 50.24±3.13 | 52.68±3.21 | 51.10±2.35 | 49.23±3.05 | 56.71±3.57 | 62.67±3.11 | 65.69±1.87 | 63.26±3.11 | 68.78±2.04 |
| BZR | 55.32±6.18 | 50.56±5.87 | 63.31±8.52 | 60.24±5.37 | 65.91±1.47 | 69.42±7.78 | 75.16±5.15 | 90.16±1.69 | 84.45±2.89 | 92.19±1.28 |
| COX2 | 50.05±2.06 | 49.86±7.43 | 53.36±8.86 | 52.01±3.17 | 53.58±5.05 | 59.37±12.67 | 62.65±8.14 | 62.04±4.63 | 60.99±2.58 | 63.93±3.83 |
| DD | 71.32±2.41 | 47.99±4.09 | 55.80±1.77 | 59.32±3.92 | 72.27±1.83 | 80.12±5.24 | 73.25±3.19 | 74.16±2.63 | 79.13±4.28 | 62.21±1.79 |
| NCI1 | 50.58±1.38 | 50.63±1.22 | 50.10±0.87 | 49.88±0.53 | 71.98±1.21 | 68.48±2.39 | 61.12±2.21 | 62.64±2.39 | 60.96±1.42 | 63.04±1.46 |
| IMDB-B | 50.80±3.17 | 54.08±5.19 | 56.50±3.58 | 56.50±4.90 | 60.19±8.90 | 52.09±3.41 | 65.88±0.75 | 66.34±4.30 | 65.38±3.25 | 67.04±2.29 |
| REDDIT-B | 46.72±3.42 | 49.31±2.33 | 68.50±5.56 | 71.80±4.38 | 75.93±8.65 | 77.85±2.62 | 88.67±1.24 | 87.59±1.34 | 85.29±0.67 | 89.80±0.24 |
| COLLAB | 50.49±1.72 | 52.60±2.56 | 46.27±0.73 | 47.61±1.29 | 60.70±2.97 | 52.94±0.85 | 72.08±0.90 | 72.78±2.67 | 69.71±1.18 | 74.11±2.01 |
| HSE | 56.87±10.51 | 62.72±10.13 | 53.56±3.98 | 51.18±2.71 | 64.84±4.70 | 59.48±1.44 | 69.65±2.14 | 72.51±3.36 | 70.16±0.87 | 73.71±1.71 |
| MMP | 50.06±3.73 | 55.24±3.26 | 54.59±2.01 | 54.54±1.86 | 71.23±0.16 | 67.84±0.59 | 70.51±1.56 | 69.83±2.76 | 63.05±0.90 | 71.67±0.43 |
| p53 | 50.69±2.02 | 54.59±4.46 | 52.66±1.95 | 53.29±2.32 | 58.50±0.37 | 64.20±0.81 | 62.99±1.55 | 70.37±1.43 | 69.41±0.04 | 70.61±0.22 |
| PPAR-gamma | 45.51±2.58 | 57.91±6.13 | 51.40±2.53 | 50.30±1.56 | 71.19±4.28 | 64.59±0.67 | 67.34±1.71 | 63.29±0.52 | 68.23±1.54 | 72.42±0.21 |
| Avg.Rank | 8.7 | 8.3 | 8.1 | 8.2 | 5.2 | 4.8 | 3.5 | 3.0 | 3.6 | 1.5 |
| Based | Ln | Lg | Lp | BZR | PTC-MR | AIDS | Esol |
|---|---|---|---|---|---|---|---|
| COX2 | MUTAG | DHFR | MUV | ||||
| - | ✓ | - | - | 83.51±4.14 | 72.48±3.77 | 96.84±0.58 | 86.49±1.20 |
| - | - | ✓ | - | 87.44±4.66 | 77.84±3.71 | 97.60±1.05 | 89.57±2.80 |
| × | - | - | ✓ | 75.18±5.82 | 70.67±8.71 | 85.32±2.11 | 79.41±2.95 |
| ✓ | - | - | ✓ | 79.21±5.60 | 74.83±8.54 | 89.47±1.85 | 83.35±2.71 |
| - | ✓ | ✓ | - | 93.14±3.63 | 77.53±4.02 | 98.90±0.42 | 90.94±1.16 |
| × | ✓ | - | ✓ | 79.87±4.78 | 75.81±3.82 | 86.24±4.65 | 76.92±2.73 |
| ✓ | ✓ | - | ✓ | 84.44±4.55 | 79.96±3.55 | 90.16±4.43 | 80.86±2.58 |
| × | - | ✓ | ✓ | 84.62±3.31 | 79.98±1.05 | 85.79±6.32 | 75.41±2.38 |
| ✓ | - | ✓ | ✓ | 89.77±3.10 | 84.24±0.82 | 89.86±6.10 | 79.27±2.16 |
| × | ✓ | ✓ | ✓ | 92.76±0.85 | 87.43±3.37 | 95.41±0.32 | 88.58±1.01 |
| ✓ | ✓ | ✓ | ✓ | 98.00±0.62 | 91.96±3.14 | 99.38±0.09 | 92.93±0.77 |
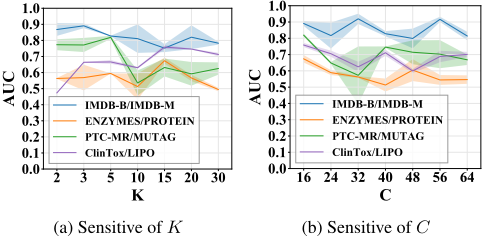
Hyperedges Number C. To investigate the sensitivity of the HGOOD algorithm to the hyperedge number C, we vary the number of C from 16 to 64 in different experiments, and the results are presented in Figure 3b. We observe that performance drops as C increases from 16 to 24, likely due to noisy high-order associations. Further increasing C boosts performance by capturing diverse high-order correlations, yet excessive C harms results, which may be due to overfitting.
- (a) Graph-space emb
(b) Hypergraph-space emb
Figure 4: Visualization on AIDS/DHFR dataset pair.
5.6 Visualization
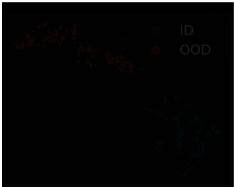
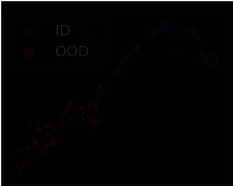
To comprehensively validate the superior effectiveness of our proposed dual-branch framework, we employ the widely adopted t-SNE [Maaten and Hinton, 2008] to visualize highdimensional learned embeddings from the graph-feature and hypergraph-global branches, together with the corresponding OOD score distribution on the standard AIDS/DHFR dataset pair. As shown in Figure 4, ID and OOD samples exhibit visually evident, clear, and distinct separation in both embedding spaces, suggesting that the graph-feature branch effectively captures subtle fine-grained local structural patterns while the hypergraph-global branch incorporates complex high-order global dependencies, thereby jointly enhancing robust cross-domain representation discriminability.
6 Conclusion
This paper introduces our HGOOD framework for OOD detection, which can efficiently capture graph semantic information through the graph feature branch and the hypergraph branch. Specifically, the graph feature branch captures local topological patterns via node-level and graph-level contrastive learning; the hypergraph-global branch integrates a hypergraph structure learning module to model global highorder associations. On this basis, we design a cross-branch prototype comparison strategy to balance fine-grained local features and high-order global correlations. Extensive experiments on real-world benchmark datasets further show that our proposed HGOOD outperforms existing SOTA methods.
Acknowledgments
This paper is partially supported by the Fundamental Research Funds for the Central Universities in UIBE (Grant No. 23QN02), the Humanities and Social Sciences Research Fund of the Ministry of Education of China under Grant 25YJCZH275, the National Natural Science Foundation of China under Grant 62306014, the Postdoctoral Fellowship Program (Grade A) of CPSF under Grant BX20250376, the Sichuan Science and Technology Program under Grant 2025ZNSFSC1506, the Fundamental Research Funds for the Central Universities under Grant 1082204112K97, and the Sichuan University Interdisciplinary Innovation Fund.
Contribution Statement
Xuanting Fan, Chenyu Wang, and Yueyue Gao contributed equally to this work.
@inproceedings{ijcai2026p285,
  title     = {HGOOD: Hypergraph-enhanced Graph Contrastive Learning for Graph Out-of-Distribution Detection},
  author    = {Fan, Xuanting and Wang, Chenyu and Gao, Yueyue and Ju, Wei and Wang, Yifan},
  booktitle = {Proceedings of the Thirty-Fifth International Joint Conference on
               Artificial Intelligence, {IJCAI-26}},
  publisher = {International Joint Conferences on Artificial Intelligence Organization},
  editor    = {Diego Calvanese},
  pages     = {2563--2571},
  year      = {2026},
  month     = {8},
  note      = {Main Track},
  doi       = {10.24963/ijcai.2026/285},
  url       = {https://doi.org/10.24963/ijcai.2026/285},
}
TY - CPAPER TI - HGOOD: Hypergraph-enhanced Graph Contrastive Learning for Graph Out-of-Distribution Detection AU - Fan, Xuanting AU - Wang, Chenyu AU - Gao, Yueyue AU - Ju, Wei AU - Wang, Yifan T2 - Proceedings of the Thirty-Fifth International Joint Conference on Artificial Intelligence, IJCAI-26 PB - International Joint Conferences on Artificial Intelligence Organization PY - 2026 SP - 2563 EP - 2571 DO - 10.24963/ijcai.2026/285 UR - https://doi.org/10.24963/ijcai.2026/285 ER -Copied
Machine-readable versions of this paper, for tools and AI agents:





