
Hundredfold Accelerating for Pathological Images Diagnosis and Prognosis through Self-reform Critical Region Focusing
Proceedings of the Thirty-Third International Joint Conference on Artificial Intelligence. Main Track. Pages 1607-1615.
https://doi.org/10.24963/ijcai.2024/178
Keywords
- Machine Learning: ML: Classification
- Computer Vision: CV: Recognition (object detection, categorization)
- Computer Vision: CV: Biomedical image analysis
Abstract
Pathological slides are commonly gigapixel images with abundant information and are therefore significant for clinical diagnosis. However, the ultra-large size makes both training and evaluation extremely time-consuming. Most existing methods need to crop the slide into patches, which also leads to large memory requirements. In this paper, we propose the Self-reform Multilayer Transformer (SMT) to accelerate the pathological image diagnosis and prognosis. Inspired by the pathologists' diagnostic procedure, SMT is designed to achieve layer-by-layer focus on critical regions. In the forward process, the first layer takes thumbnails as inputs and measures the significance of each patch that deserves focusing. Images from focused regions are cropped with a higher magnification and used as the input of the next layer. By analogy, the third layer inputs are focused images of second layer, which contain abundant cellular features. In addition to the forward focusing, the backward reform strategy is proposed to improve the precision of former layers. This cyclic process achieves iterative interactions for better performance on both classification and focusing. In this way, only a small part of critical patches are required in SMT for diagnosis and prognosis. Sufficient experiments demonstrate that SMT achieves hundreds times faster speed, while achieving comparable accuracy and less storage compared with existing SOTA methods.
- [Bulten et al., 2022] Wouter Bulten, Kimmo Kartasalo, Po- Hsuan Cameron Chen, Peter Ström, Hans Pinckaers, Ku- nal Nagpal, Yuannan Cai, David F Steiner, Hester van Boven, Robert Vink, et al. Artificial intelligence for di- agnosis and gleason grading of prostate cancer: the panda challenge. Nature medicine, pages 1-10, 2022.
- [Campanella et al., 2019] Gabriele Campanella, Matthew G Hanna, Luke Geneslaw, Allen Miraflor, Vitor Werneck Krauss Silva, Klaus J Busam, Edi Brogi, Victor E Reuter, David S Klimstra, and Thomas J Fuchs. Clinical- grade computational pathology using weakly supervised deep learning on whole slide images. Nature medicine, 25(8):1301-1309, 2019.
- [Chen et al., 2022a] Mengzhao Chen, Mingbao Lin, Ke Li, Yunhang Shen, Yongjian Wu, Fei Chao, and Rongrong Ji Cf-vit. A general coarse-to-fine method for vision trans- former. arXiv preprint arXiv:2203.03821, 1, 2022.
- [Chen et al., 2022b] Richard J Chen, Chengkuan Chen, Yi- cong Li, Tiffany Y Chen, Andrew D Trister, Rahul G Kr- ishnan, and Faisal Mahmood. Scaling vision transform- ers to gigapixel images via hierarchical self-supervised learning. In Proceedings of the IEEE/CVF Conference on Computer Vision and Pattern Recognition, pages 16144- 16155, 2022.
- [Chen et al., 2023] Siteng Chen, Jinxi Xiang, Xiyue Wang, Jun Zhang, Sen Yang, Wei Yang, Junhua Zheng, and Xiao Han. Deep learning-based pathology signature could re- veal lymph node status and act as a novel prognostic marker across multiple cancer types. British Journal of Cancer, pages 1-8, 2023.
- [Chen et al., 2024] Jiawei Chen, Lin Chen, Jiang Yang, Tianqi Shi, Lechao Cheng, Zunlei Feng, and Mingli Song. Life regression based patch slimming for vision transform- ers. Neural Networks, page 106340, 2024.
- [Chikontwe et al., 2020] Philip Chikontwe, Meejeong Kim, Soo Jeong Nam, Heounjeong Go, and Sang Hyun Park. Multiple instance learning with center embeddings for histopathology classification. In Medical Image Comput- ing and Computer Assisted Intervention-MICCAI 2020: 23rd International Conference, Lima, Peru, October 4-8, 2020, Proceedings, Part V 23, pages 519-528. Springer, 2020.
- [Diao et al., 2019] Songhui Diao, Weiren Luo, Jiaxin Hou, Hong Yu, Yunqiang Chen, Jing Xiong, Yaoqin Xie, and Wenjian Qin. Computer Aided Cancer Regions Detection of Hepatocellular Carcinoma in Whole-slide Pathological Images based on Deep Learning. In 2019 International Conference on Medical Imaging Physics and Engineering (ICMIPE), pages 1-6. IEEE, 2019.
- [Epstein, 2010] Jonathan I. Epstein. An update of the glea- son grading system. The Journal of Urology, 183(2):433- 440, 2010.
- [Feng et al., 2021] Shi Feng, Xiaotian Yu, Wenjie Liang, Xuejie Li, Weixiang Zhong, Wanwan Hu, Han Zhang, Zunlei Feng, Mingli Song, Jing Zhang, et al. Development of a deep learning model to assist with diagnosis of hep- atocellular carcinoma. Frontiers in Oncology, page 4990, 2021.
- [He et al., 2016] Kaiming He, Xiangyu Zhang, Shaoqing Ren, and Jian Sun. Deep residual learning for image recog- nition. In Proceedings of the IEEE conference on computer vision and pattern recognition, pages 770-778, 2016.
- [He et al., 2021] Haoyu He, Jing Liu, Zizheng Pan, Jianfei Cai, Jing Zhang, Dacheng Tao, and Bohan Zhuang. Prun- ing self-attentions into convolutional layers in single path. arXiv e-prints, pages arXiv-2111, 2021.
- [Hu et al., 2023] Kaiwen Hu, Jing Gao, Fangyuan Mao, Xin- hui Song, Lechao Cheng, Zunlei Feng, and Min Gyoo Song. Disassembling convolutional segmentation net- work. International Journal of Computer Vision, 131:1741 -1760, 2023.
- [Javed et al., 2022] Syed Ashar Javed, Dinkar Juyal, Harshith Padigela, Amaro Taylor-Weiner, Limin Yu, and Aaditya Prakash. Additive mil: intrinsically interpretable multiple instance learning for pathology. Advances in Neural Information Processing Systems, 35:20689-20702, 2022.
- [Jewsbury et al., 2021] Robert Jewsbury, Abhir Bhalerao, and Nasir M Rajpoot. A quadtree image representation for computational pathology. In Proceedings of the IEEE/CVF International Conference on Computer Vision, pages 648- 656, 2021.
- [Khani et al., 2019] A. A. Khani, S. A. Fatemi Jahromi, H. O. Shahreza, and et al. Towards automatic prostate gleason grading via deep convolutional neural networks. ICSPIS, pages 1-6, 2019.
- [Li et al., 2020] Y. Li, M. Huang, Y. Zhang, and et al. Au- tomated gleason grading and gleason pattern region seg- mentation based on deep learning for pathological images of prostate cancer. IEEE Access, 2020.
- [Li et al., 2021] Bin Li, Yin Li, and Kevin W Eliceiri. Dual- stream multiple instance learning network for whole slide image classification with self-supervised contrastive learn- ing. In Proceedings of the IEEE/CVF conference on com- puter vision and pattern recognition, pages 14318-14328, 2021.
- [Liao et al., 2020] H. Liao, Y. Long, R. Han, and et al. Deep learning-based classification and mutation predic- tion from histopathological images of hepatocellular car- cinoma. CTM, 2020.
- [Litjens et al., 2018] Geert Litjens, Peter Bandi, Babak Eht- eshami Bejnordi, Oscar Geessink, Maschenka Balkenhol, Peter Bult, Altuna Halilovic, Meyke Hermsen, Rob van de Loo, Rob Vogels, et al. 1399 h&e-stained sentinel lymph node sections of breast cancer patients: the camelyon dataset. GigaScience, 7(6):giy065, 2018.
- [Lu et al., 2021] M. Y. Lu, T. Y. Williamson, D.and Chen, and et al. Data-efficient and weakly supervised computa- tional pathology on whole-slide images. Nature Biomedi- cal Engineering, pages 555-570, 2021.
- [Ma et al., 2023] Xinyin Ma, Gongfan Fang, and Xinchao Wang. Llm-pruner: On the structural pruning of large lan- guage models. Advances in Neural Information Process- ing Systems, 2023.
- [Ma et al., 2024] Xinyin Ma, Gongfan Fang, and Xinchao Wang. Deepcache: Accelerating diffusion models for free. In Proceedings of the IEEE/CVF conference on computer vision and pattern recognition, 2024.
- [Shao et al., 2021] Zhuchen Shao, Hao Bian, Yang Chen, Yifeng Wang, Jian Zhang, Xiangyang Ji, et al. Transmil: Transformer based correlated multiple instance learning for whole slide image classification. Advances in neural information processing systems, 34:2136-2147, 2021.
- [Ström et al., 2020] P. Ström, K. Kartasalo, H. Olsson, and et al. Artificial intelligence for diagnosis and grading of prostate cancer in biopsies: a population-based, diagnostic study. The Lancet Oncology, pages 222-232, 2020.
- [Tang et al., 2022] Shitao Tang, Jiahui Zhang, Siyu Zhu, and Ping Tan. Quadtree attention for vision transformers. In International Conference on Learning Representations, 2022.
- [Tellez et al., 2019] David Tellez, Geert Litjens, Jeroen van der Laak, and Francesco Ciompi. Neural image compression for gigapixel histopathology image analysis. IEEE transactions on pattern analysis and machine intel- ligence, 43(2):567-578, 2019.
- [Thandiackal et al., 2022] Kevin Thandiackal, Boqi Chen, Pushpak Pati, Guillaume Jaume, Drew FK Williamson, Maria Gabrani, and Orcun Goksel. Differentiable zoom- ing for multiple instance learning on whole-slide images. In European Conference on Computer Vision, pages 699- 715. Springer, 2022.
- [Wang et al., 2021a] Wenhai Wang, Enze Xie, Xiang Li, Deng-Ping Fan, Kaitao Song, Ding Liang, Tong Lu, Ping Luo, and Ling Shao. Pyramid vision transformer: A ver- satile backbone for dense prediction without convolutions. In Proceedings of the IEEE/CVF international conference on computer vision, pages 568-578, 2021.
- [Wang et al., 2021b] Yulin Wang, Rui Huang, Shiji Song, Zeyi Huang, and Gao Huang. Not all images are worth 16x16 words: Dynamic transformers for efficient image recognition. Advances in Neural Information Processing Systems, 34:11960-11973, 2021.
- [Xu et al., 2019] G. Xu, Z. Song, Z. Sun, and et al. Camel: A weakly supervised learning framework for histopathology image segmentation. ICCV, pages 10682-10691, 2019.
- [Yu et al., 2016] Kun-Hsing Yu, Ce Zhang, Gerald J Berry, Russ B Altman, Christopher Ré, Daniel L Rubin, and Michael Snyder. Predicting non-small cell lung cancer prognosis by fully automated microscopic pathology im- age features. Nature communications, 7(1):12474, 2016.
- [Yu et al., 2021] Xiaotian Yu, Zunlei Feng, Mingli Song, Yuexuan Wang, Xiuming Zhang13, and Thomas Li. Ten- dentious noise-rectifying framework for pathological hcc grading. In British Machine Vision Conference, 2021.
- [Zhao et al., 2020] Yu Zhao, Fan Yang, Yuqi Fang, Hailing Liu, Niyun Zhou, Jun Zhang, Jiarui Sun, Sen Yang, Bjoern Menze, Xinjuan Fan, et al. Predicting lymph node metas- tasis using histopathological images based on multiple in- stance learning with deep graph convolution. In Proceed- ings of the IEEE/CVF Conference on Computer Vision and Pattern Recognition, pages 4837-4846, 2020.
- [Zhou et al., 2017] Naiyun Zhou, Andrey Fedorov, Fiona Fennessy, Ron Kikinis, and Yi Gao. Large scale dig- ital prostate pathology image analysis combining fea- ture extraction and deep neural network. arXiv preprint arXiv:1705.02678, 2017.
References were extracted automatically from the PDF and may contain errors.
Full text extracted automatically from the PDF; figures, tables and equations may differ. The PDF is the version of record.
1 Introduction
Pathological images are widely applied in clinical diagnosis and prognosis. These whole-slide images (WSI) are commonly gigapixel and contain abundant structural and cellular features. Therefore, the pathological image is capable for many clinical tasks and acknowledged as the "gold standard" for cancer diagnosis and prognosis. Recent researches have applied deep learning models on various pathological datasets, including the prostate cancer [Khani et al., 2019; Li et al., 2020; Str¨om et al., 2020], liver cancer [Feng et al., 2021; Liao et al., 2020], breast cancer [Xu et al., 2019], etc.
∗Zunlei Feng is the corresponding author. (E-mail: zunleifeng@zju.edu.cn)
The common procedure of existing methods is cropping each WSI into patches [Campanella et al., 2019; Zhou et al., 2017]. These micro-scale patches contain cellular information and are used for classification individually. Besides, many recent methods attempt to improve diagnosis accuracy by integrating the global feature. But considering the ultra-large size, all these methods have the critical problem of enormous consumption of space and time. For each WSI, hundreds of thousands of patches are required to generate the slide-level prediction, which costs hundreds seconds.
To accelerate the classification on pathological images, some researches [Xu et al., 2019; Shao et al., 2021; Thandiackal et al., 2022] proposed weakly-supervised methods based on multiple instance learning (MIL). These methods first crop each WSI into patches and extract embeddings individually. The pooling operation is conducted on these embeddings for slide-level classification. However, since each WSI contains numerous patches, processing each slide takes hundreds of seconds and requires multiple gigabytes of memory. Besides, the cropped patches were independent, leading to the loss of global information and limited performance.
Through investigating the characteristics of pathological images, we find most regions in WSIs are inessential for classification, and there are many regions containing repetitive features. It indicates that only a small part of the WSI may contain sufficient information for cancer diagnosis and prognosis. Clinically, pathologists will select suspicious regions on the thumbnail with macro scale and then zoom in to diagnosis with micro scale. Some examples of pathological slides are shown in Figure 1. This diagnostic procedure demonstrates that, although the thumbnails do not contain detailed features used for accurate classification, they can identify regions of suspected cancer. Aiming at these characteristics, this paper proposes the Self-reform Multilayer Transformer (SMT) for fast classification of pathological images.
SMT contains three layers to handle multiple scales of WSIs. The focusing strategy is applied in former layers to select suspicious regions of cancer from the macro-scale image, then these regions are cropped with the larger magnification and used as the input of the next layer. It is worth noting that former layers do not need to achieve accurate classification from thumbnails. The last layer of SMT is trained from the focused micro-scale images, which contain abundant cellular features for precise diagnosis and prognosis. Besides, a cyclic process including forward focusing and backward reform strategy is proposed to improve the performance of both classification and focusing. So that SMT can not only achieve accurate classification from crucial regions, but also save time and space by ignoring inessential regions.
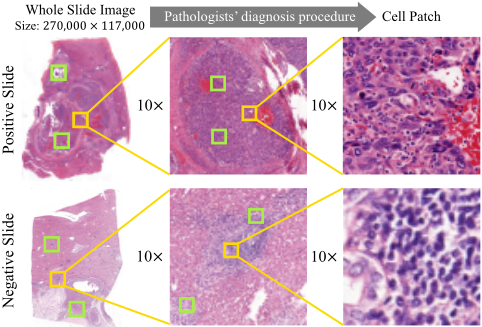
Therefore, this paper makes the following contributions: 1) This paper proposes the SMT inspired by pathologists' diagnostic procedure. Through focusing on crucial regions of cancer from macro to micro scale, the SMT is the first method that achieves dramatic prediction acceleration for pathological images without sacrificing accuracy or requiring additional storage. 2) A cyclic process is proposed to ensure accuracy while achieving fast prediction. The forward focusing selects suspected cancer regions for the latter layer. The backward rethinking optimizes the former layer with more precise information. 3) Exhaustive experiments demonstrate that SMT exhibits comparative performance on various pathological datasets with only 4 ∼ 8 high-response patches of each layer, while achieving an average acceleration of 162.25 times compared with existing methods.
2 RelatedWork
Recently, pathological images are widely applied for various clinical tasks including tumor region detection [Campanella et al., 2019], tumor grading [Bulten et al., 2022; Yu et al., 2021], and prognostic prediction [Yu et al., 2016; Chen et al., 2023]. This paper is to achieve acceleration in both diagnosis and prognosis tasks, which is related with two categories of recent literature including deep learning acceleration method and WSI classification framework.
There are many researches on efficient classification [Wang et al., 2021a; He et al., 2021; Hu et al., 2023; Chen et al., 2024; Ma et al., 2024; Ma et al., 2023]. Dynamic Transformer [Wang et al., 2021b] adaptively adjusted the token number for each sample. QuadTree Attention [Tang et al., 2022] conducted the token pyramid to calculate attention from coarse to fine. CF-ViT [Chen et al., 2022a] designed an identification mechanism to further split the informative patches to ensure performance while accelerating. These methods achieved efficient classification mainly by reducing the calculation of attention. But for pathological datasets, the computational cost is caused by the ultra-large size, which can not be solved by reducing tokens or pruning. Besides, the features of various scales vary greatly in pathological images. As a result, the multi-scale framework for traditional images cannot performwell for pathological images.
To improve the performance, several researchers attempted to achieve pathological diagnosis based on MIL [Chikontwe et al., 2020; Zhao et al., 2020]. CAMEL [Xu et al., 2019] is proposed to split the image into latticed instances and generate instance-level labels by MIL, achievingWSI segmentation with only slide-level labels. Aiming at the label quality problem, authors in [Diao et al., 2019] prevented the influence of noisy labels by adding some artificial samples, which were used for the simulation of blood vessels or staining impurities. Some researchers aim to predict through global recognition. NIC [Tellez et al., 2019] compressed the WSI by aggregating features of cropped patches. HIPT [Chen et al., 2022b] applied the scaling transformer to aggregate lowscale features into high-scale images. Both these two methods used the aggregated feature for slide-level classification. These methods require to identify all patches individually before confirming the final result, which leads to the problem of the massive consumption of time and space.
To achieve fast inference on pathological images, an attention-based learning called CLAM [Lu et al., 2021] is proposed to identify sub-regions of high diagnostic value for slide-level classification. In the quadtree-based image representation method [Jewsbury et al., 2021], patches with sufficient information will be further divided into four subregions. Still, acceleration in these ways would be limited for the ultra-large size. Some MIL-based methods were proposed for acceleration [Campanella et al., 2019; Li et al., 2021; Javed et al., 2022]. MIL and Transformer were combined to explore both morphological and spatial information for better interpretability [Shao et al., 2021]. Differentiable zooming was proposed in ZoomMIL [Thandiackal et al., 2022] and achieved fast training. However, it relied on massive processing to aggregate tissue-context information from WSIs, which could cause hundreds of seconds per slide. Conversely, with the focusing strategy and cyclic optimization to ensure precision, our proposed SMT can focus on suspicious cancer regions with thumbnails, achieving dramatic acceleration without pre-processing or extra storage.
3 Methodology
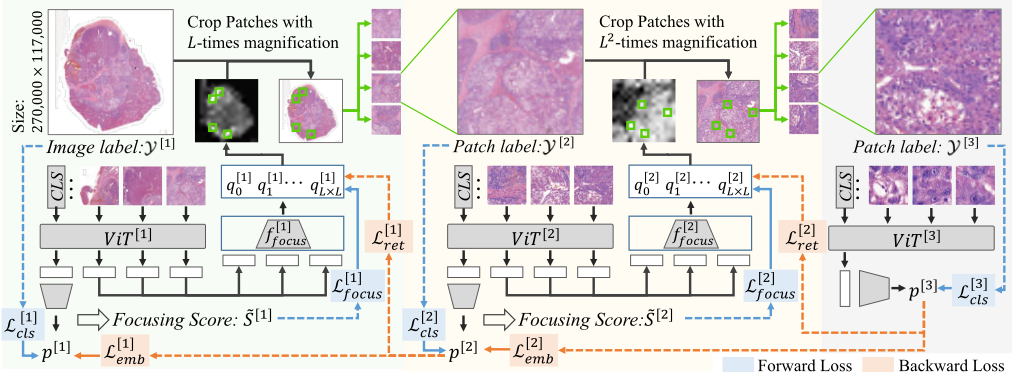
Self-reform Multilayer Transformer (SMT) is proposed to achieve fast classification based on pathologists' diagnostic procedure. The overall methodology is illustrated in Figure 2. This section includes the preliminary about notations, the detailed forward and backward strategy of SMT, and the weakly-supervised training strategy.
3.1 ProblemFormulation
Given a pathological dataset of WSIs, thumbnails with the magnification of M are used as inputs of the first layer, denoted as {(X [1] n1 , Y [1] n1 )|1 ≤ n1 ≤ N}, where N denotes the sample amount, X [1] n1 and Y [1] n1 denote the n1-th sample and slide-level label of diagnosis or prognosis. Each sample will be cropped into L×L patches as the input of transformer, denoted as {x[1] i1 |1 ≤ i1 ≤ L2 }, where L2 is the number of patches. The output embedding of each patch and the class token is denoted as v[1] i1 and v[1] cls , respectively. For all the patches, we evaluate the probability of containing cancer and denote it as {q[1] i1 }L2 i1=1 . Let tk denote the subscript of patch that ranks k-th in the focusing prediction. Top-K patches {x[1] t1 , ..., x[1] tK } will be selected with a larger magnification of M × L for the second layer, denoted as {(X [2] n2 , Y [2] n2 )|1 ≤ n2 ≤ K}. Y [2] n2 is determined based on the annotated tumor region. In a similar way, we denote the subscripts of top-K focusing predictions of the second layer {tt1, ..., ttK}, the inputs of the third layer {(X [3] n3 , Y [3] n3 )|1 ≤ n3 ≤ K}, the cropped patches of the second and third layers {x[2] i2 |1 ≤ i2 ≤ L2 } and {x[3] i3 |1 ≤ i3 ≤ L2 }. For three layers, the transformer encoders are denoted as V iT [1] , V iT [2] , V iT [3] , the output logits and predictions are denoted as z[1] , z[2] , z[3] and p[1] , p[2] , p[3] , respectively.
3.2 Self-reformMultilayer Transformer
The proposed SMT contains three layers transformer, aiming to focus on tumor regions from macro scale to micro scale. The inputs of three layers are patches with the same size but different magnifications. In addition to the classification, SMT training includes forward focusing and backward optimization. Inspired by pathologists' diagnostic procedure, the forward focusing strategy selects patches deserving attention for the next layer. The backward optimization enhances the performance of the former layer with detailed features. Through such cyclic training, the SMT can iteratively improve the accuracy of focusing and classification.
Forward Focusing
For the first layer of SMT, the thumbnails of WSIs X [1] are macro-scale images that do not contain cellular information, but can be used to identify suspicious regions that are most likely to contain cancer. Each image is cropped into patches and inputted into the transformer encoder V iT [1] . Through self-attention, the embedding of class tokens can be used for classification. For each sample X [1] n1 , the loss function used to train the first layer is defined as:
where C denotes the number of categories, and pc denotes the probability on c-th category.
Different from the traditional ViT for classification, an additional focusing predictor f [1] focus is applied in SMT to evaluate the patches that worth focusing on for the next layer. This predictor takes the embedding of each patch v[1] i1 as input to assess the significance to be magnified and focused. In order to train the focusing predictor, this paper propose a measurement for each patch x[1] i1 , which is defined as:
where S[1] i1 (e) and p[1] (e) denote the accumulated focusing score and classification probabilities of the first layer at e-th epoch, ∑Cc>0 p[1] c denotes the summary probability of positive categories, αj1,i1 denotes the attention weight in the first encoder of transformer, and ϵ is the hyper-parameter for ensemble. In the first encoder of the transformer, the output token bout is the weighted sum of all inputted tokens bin , which is denoted as bout j1 = ∑i1 αj1,i1 bin i1 . Since αj1,i1 is the weight of bin i1 to bout j1 , the gradient ∂ ∑Cc>0 p[1] c /∂αj1,i1 represents the influence of inputted feature bin i1 on the probabilities of positive category through bout j1 . Considering the gradient reflects the current influence, the score is updated through temporal ensembling. Compared to existing attribution methods, this measurement directly evaluates the significance towards the positive categories. Even for samples that are misclassified as negative due to low resolution, this strategy can identify regions that are likely to contain cancer and conduct further classification after magnification in latter layers.
Let ˜ S[e] i1 denotes the normalized focusing score among all L2 patches of each image, which represents the patch significance for cancer classification and is used as the targets of focusing predictors. The loss function for training focusing predictor is defined as:
where v[1] i1 denotes the output embedding of i1-th patch, f [1] focus denotes the focusing predictor.
Based on the focusing predictions, the subscripts {t1, ..., tK} of top-K patches are obtained. The patches containing the same region as {x[1] t1 , ..., x[1] tK } are cropped with a larger magnification and used as the inputs of the second layer, denoted as {(X [2] n2 , Y [2] n2 )|1 ≤ n2 ≤K}. It is worth noting that the input image of the second layer X [2] n2 has the same size as the X [1] n1 but L times magnifications. And X [2] n2 contains the same region as the patch x[1] tn2 with L times larger size. Consequently, X [2] n2 contains more clear pathological features than x[1] tn2 and can be used for better classification in the second layer. By analogy, the input of the third layer X [3] n3 is also the same region as the patch of the second layer x[2] ttn3 , which contains more detailed cellular features.
Similar to the first layer, the latter two layers are trained by L[2] cls and L[3] cls for classification. From these layers, SMT can extract structural and cellular features from crucial regions of interest, and the final prediction is obtained based on these two layers. Besides, focusing predictors (f [1] focus and f [2] focus ) are only applied in the first two layers, ensuring that the inputs of the third layer are crucial regions for determining cancer.
Even in the inference stage, SMT only takes (1 +K +K2 ) patches for each WSI, which saves a lot of storage space.
Backward Rethinking Strategy
In the former layers especially the first layer, the input contains the macroscopic vision with limited cellular features. Conversely, the latter layers are trained by high-magnification patches, which contain more abundant information. For this reason, backward optimization is proposed to improve the performance of former layers, including the classifier and the focusing predictor. The optimized former layers can provide more accurate cancer-focusing results for the latter layers in the forward process. This iterative optimization enables the SMT to accurately predict by focusing only on a few regions.
To ensure the reliability of the focusing, a recheck strategy is proposed to constrain the training of focusing predictors. The prediction results of focused patches are used to recheck the focusing results of the former layer. If the focusing predictor selects the wrong patches without cancer, their predictions should be reduced after being detected in the latter layer. Take the k-th input of the second layer for an example, the loss function for rethinking is defined as follows:
where f [1] focus (v[1] tk ) denotes the focusing prediction of tk-th patch in the first layer It is worth noting that both the focusing loss (Eq. 3) and the rethinking loss (Eq. 4) are applied to constrain the training of focusing predictors. Based on the model gradient, the focusing loss achieves the fast constraint on all patches. Differently, the rethinking loss is conducted based on more precise information from crucial patches. With these two losses, focusing predictors are trained to focus more precisely on suspected cancer regions.
Through forward training, SMT achieves the layer-bylayer focus, but the reliability of cancer focusing is dependent on the classification performance. Aiming at this problem, we utilize the latter layers to guide their former layers on the classification task. Take the first two layers as an example. Each image X [1] n1 is inputted into V iT [1] for classification and focusing. The corresponding top-K patches with high focusing predictions are denoted as {X 2 n2 }Kn2=1 and used as input of V iT [2] . The output embeddings of class tokens in these two layers are denoted as V iT [1] (X [1] n1 ) and {V iT [2] (X [2] n2 )}Kn2=1 , respectively. The latter is the embedding of the most crucial patches. Using it to constrain the first-layer embedding can assist V iT [1] in extracting features from these regions. Take the first layer as an example, the L1 loss is used to optimize the embedding of class token and defined as:
where ¯ f [2] n1 is the average embedding of class tokens in the second layer and is used as the target of V iT [1] (X [1] n1 ). It is worth noting that L[1] emb is only used to train the first layer. The gradient of ¯ f [2] n1 is detached in this loss. Similar constraint L[2] emb is conducted from the third layer to the second one. With the backward constraint, the embedding of class tokens in former layers is guided on crucial feature.
In summary, the overall loss function for training ViTs (LV ) and focusing predictors (LF ) can be derived as:
where λ[l] fwd and λ[l′ ] bwd are loss weights for controlling the forward and backward processes. The detailed settings are given in Section B of supplementary materials. For the inference of each slide, the final prediction will be determined based on all focused patches of the third layer.
3.3 Weakly-Supervised Training Strategy
In some datasets, there are no extra annotations for tumor regions. With only slide-level labels, our proposed SMT can still achieve fast and accurate prediction. Since the labels of the latter two layers can not be determined based on annotations, they are set as the same as the first-layer label Y [1] . To guarantee the quality of pseudo labels, focusing predictors are required to select positive patches with high precision. Through evaluation on datasets with annotations, we find that our proposed focusing strategy can achieve over 80% accuracy on positive slides. It indicates that the training data of transformers in the latter two layers contains noise labels with a small ratio of less than 20%. According to the definition in Eq. (2), the patch with the lowest focusing score ˜ Si1 will have a great influence on the prediction of negative category. These patches are mainly benign regions, which is further demonstrated in supplementary experiments. In each layer, an additional patch with the lowest focusing score is selected and magnified for training the next layer. Consequently, the transformers in the latter two layers are further trained by comparing positive samples with both intra-slide and inter-slide negative samples. It is noted that the additional patch is only used to train the transformer of the next layer, which will not be used for the subsequent focusing. So that the acceleration of this strategy can also be guaranteed.
4 Experiments
4.1 Datasets and Implementation Details
To evaluate the performance of our proposed SMT on classification accuracy and inference speed, we use various pathological datasets for diagnosis and prognosis tasks. The diagnosis datasets includes CAMELYON16 [Litjens et al., 2018], PANDA [Bulten et al., 2022], and BRCA. The prognosis datasets include LUAD and our collected HCC dataset. In these datasets, CAMEL, PANDA, and HCC contain annotations of tumor regions. PANDA is a grading dataset with five categories. Based on the severity of the Gleason system [Epstein, 2010], we also divide the grades in PANDA into two categories and denote it as 'PANDA-B'. More details are given in Section A of supplementary materials.
In SMT, the encoders of three layers have the same architecture but do not share parameters. Each encoder is the vision transformer with 12 depth and 6 attention heads. We use SGD for model training with the momentum of 0.9 and the weight decay of 5 × 10⁻⁴ . The initial learning rate is set to 0.002 for the former two layers and 0.01 for the last layer. The batch size for the first layer is set to 4. The number of focusing patches is set as K = 4, so that the actual batch size for the latter layers are 16 and 64, respectively. SMT is trained for 10 epochs on PANDA and 100 epochs on other datasets. The training of the second and third layers are start at 3-th and 5-th epoch on PANDA, which are 20-th and 50-th epoch on other datasets. The weight of backward optimization increases gradually from 0 to 1 in 5 epochs (PANDA) and 20 epochs (other datasets). Slides of the above datasets are scanned at 40×, which is also the inputted magnification of the last layer. For PANDA, BRCA, and LUAD, input images are cropped into 64 patches in each layer of ViT. For CAMELYON16 and HCC, input images are cropped into 256 patches in each layer of ViT. The patch size for all layers is set to 256. The ϵ is set to 0.9. The loss weights λ[l] fwd and λ[l′ ] bwd are gradually increased to 1 and 0.1. More details about hyper-parameter settings are given in supplementary materials. To the fair comparison of model efficiency, the inference of all methods are run on a single NVIDIA A800.
4.2 Predictive Performance & Inference Efficiency
In this section, we compare the predictive performance and inference efficiency of our proposed SMT with various existing methods, including NIC [Tellez et al., 2019], CLAM [Lu et al., 2021], HIPT [Chen et al., 2022b], QuadTree [Jewsbury et al., 2021], TransMIL [Shao et al., 2021] and ZoomMIL [Thandiackal et al., 2022]. The en- coders use parameters pretrained on ImageNet. The traditional method of cropping patches are used as 'Baseline', which uses ResNet18 [He et al., 2016] as the backbone. Our proposed SMT is evaluated with different numbers of focused patches.
From the classification results in Table 1, CLAM and HIPT achieve great performance on pathological diagnosis and prognosis. Especially, HIPT achieves the highest accuracy on three datasets, which mainly due to the sufficient features extracted by its hierarchical structure. However, from the inference time, HIPT takes hundreds of seconds for the inference of each slide. QuadTree and MIL-based methods are faster by selecting partial regions in WSIs, but the acceleration is still limited. It is noted that all the results of inference time include data processing and model prediction for each slide. Although TransMIL and ZoomMIL take only a few seconds in model prediction, they rely on massive pre-processing to extract embeddings of all patches, which requires hundreds of seconds. As a result, the inference of each slide with bothTransMIL andZoomMIL is actually time-consuming. In SMT, the focusing strategy achieves fast and accurate prediction on all pathological datasets. It takes only 2.17s ∼ 5.65s for the inference of each WSI. Except the PANDA with smallsized slides, SMT achieves an average acceleration of 162.25
| Dataset | Baseline | NIC | CLAM | HIPT | QuadTree | TransMIL | ZoomMIL | SMT (ours) | |
|---|---|---|---|---|---|---|---|---|---|
| CAMELYON16 | Acc. Time | 77.49±1.27 692.32 | 80.83±0.81 2118.26 | 83.16±0.94 113.98 | 85.57±0.86 335.74 | 84.60±1.05 71.35 | 85.19±0.82 453.86 | 84.42±1.33 428.19 | 84.81±0.85 3.09 |
| PANDA | Acc. Time | 73.76±2.06 10.79 | 78.19±1.16 51.86 | 80.80±2.71 3.71 | 80.69±1.07 8.93 | 76.60±3.23 2.95 | 80.92±1.96 9.02 | 81.38±1.28 7.58 | 79.19±1.97 2.26 |
| PANDA-B | Acc. | 86.60±1.02 | 90.76±0.84 | 93.15±1.35 | 92.71±1.01 | 92.08±1.74 | 90.97±1.45 | 92.57±0.92 | 92.89±0.63 |
| BRCA | Acc. Time | 81.15±1.77 701.42 | 84.02±1.30 1968.46 | 85.82±1.80 115.43 | 87.26±0.93 362.50 | 84.37±2.25 80.50 | 85.46±0.71 524.91 | 86.10±0.95 505.20 | 85.94±0.84 2.17 |
| LUAD | Acc. Time | 73.58±2.15 578.63 | 73.17±1.48 1217.31 | 78.99±1.72 99.03 | 80.46±1.34 179.75 | 76.93±1.97 50.76 | 79.95±1.88 407.10 | 78.68±1.18 316.56 | 79.10±1.21 2.84 |
| HCC | Acc. Time | 81.09±2.37 1335.19 | 85.11±1.85 3504.32 | 87.83±2.02 257.15 | 87.03±1.53 584.42 | 86.25±2.17 101.54 | 85.86±2.01 847.38 | 87.59±1.99 757.79 | 86.24±1.20 5.65 |
times among other datasets. Even Compared to SOTA methods, SMT still achieves comparable prediction performance and huge acceleration. And the gap between SMT and optimal performance is only 0.26% ∼ 2.19%, demonstrating that the acceleration of SMT does not sacrifice performance.
Moreover, existing methods require to crop numerous patches from each WSI and extract embeddings, leading to a huge storage burden. For the inference stage of SMT, only a few patches of each WSI are required. According to the statistics shown in Table S2 of supplementary materials, SMT only takes less than 1% space for storing thumbnails of WSIs.
4.3 Ablation Study
The effect of SMT components are further evaluated, including ablation study on the focused number, focusing strategy, backward optimization, and the performance of three layers.
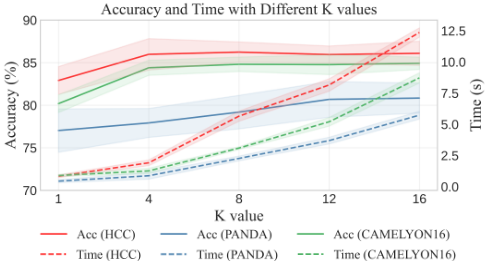
To explore the effect of different number of focused patches, experiments with various K values are conducted and shown in Figure 3. For datasets CAMELYON16 and HCC, SMT achieves high accuracy with only 4 ∼ 8 focused patches, but the accuracy can not be significantly improved by further increasing the K value. It indicates that only a few critical regions are enough for pathological diagnosis, and most other regions are inessential or repetitive. For the grading dataset PANDA, the task is more challenging and require more information. Therefore the K value for accurate diagnosis is improved to 12.
| Dataset | CAMELYON16 | HCC | ||
|---|---|---|---|---|
| Acc. | AUC | Acc. | AUC | |
| Forward (focus by score s) | 81.69 | 82.73 | 83.41 | 80.58 |
| Forward (focus by prediction q) | 81.77 | 86.05 | 83.84 | 81.29 |
| Forward (focus by attention) | 68.33 | 70.05 | 73.07 | 76.37 |
| Forward + Lret | 84.50 | 87.18 | 85.98 | 87.93 |
| Forward + Lemb | 83.97 | 86.01 | 84.64 | 84.55 |
| Forward + Backward | 84.81 | 87.86 | 86.24 | 88.15 |
The ablation study on each component is shown in Table 2. With only forward training, we compare the focusing strategies based on the score s, the prediction q, and the attention value. The focusing score is calculated based on the model gradient. Since it is untrainable, the focusing precision is limited, resulting in poor performance of the final diagnosis. The attention value is calculated across the ViT, which is also untrainable. More importantly, it reflects the correlation between inputted patches and the class token, which can cause wrong focusing results on negative samples. Differently, the focusing predictor can be trained to extract information from the patch embedding. Since the predictor training is trained by s with only forward training, its performance is similar to that of focusing by scores. But with backward rethinking
(Forward + Lret), the focusing predictor can improve performance through both forward and backward optimization.
In addition, the focusing precision also relies on the classification performance. The final performance is further improved by combining forward training and embedding loss (Forward + Lemb). Even though Lemb is used to optimize the former layers, the representative learning also promotes the model to extract better features for precise focusing. With both forward and backward training, the classification and focusing are further improved, achieving great performance in both diagnosis and prognosis tasks. Besides, these losses do not contain extensive additional calculations in training, and the backward process is not used in the inference stage. So these strategies can achieve better model training without affecting the inference speed. That is how SMT achieves fast and accurate pathological diagnosis.
More ablation study is conducted in Section C of supplementary materials, including the experiments with different hyper-parameters, the time consumption with different values of K, the performance of three layers during training.
4.4 Focusing Visualization
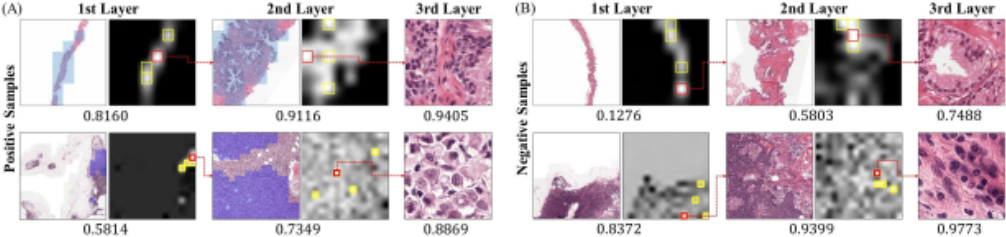
The performance of focusing predictors is evaluated by visualizing the focusing results. This section selects positive and negative samples in PANDA and CAMELYON16. In Figure 4, the focusing predictions on all patches of the former two layers are shown. Patches with top-1 and top-2 ∼ 4 focusing scores are highlighted in red and yellow, respectively. And the top-1 patch predicted to be most worthy to focus on is selected and visualized in the next layer.
In positive samples, most patches with high focusing predictions are consistent with cancer regions. Through SMT, these crucial regions are focused layer by layer, and each slide is accurately predicted on these patches. Without wasting time on inessential regions, our proposed SMT can achieve efficient predictions on pathological images.
For negative samples, SMT will still predict the significance of focusing on all the patches. Even though the image does not contain any cancer regions, patches that are most likely to have cancer will be selected for further confirmation. This strategy of SMT avoids the poor performance caused by inaccurate prediction of previous layers on thumbnails. For example, although the first layer misdiagnoses the first negative sample, the focusing predictor locates suspicious patches for further confirmation. With abundant features of magnified images, the last layer can make more accurate classification on samples that were wrongly predicted by former layers.
5 Discussion and Limitation
The SMT achieves acceleration by only focusing on crucial regions, but this strategy is highly dependent on the focusing precision, which will be affected by difficult tasks. In Figure 4, We find that some epithelioid cells are wrongly focused since they are similar to cancerous cells in morphology. Similarly, due to the relatively low focusing precision for grading tasks in PANDA, SMT achieves lower performance compared with SOTA methods. The results in Table S1 of supplementary materials shows that the performance can be improved with a larger K, and it is still faster than all existing methods. In summary, there is still a trade-off between focusing precision and speed, and a better focusing strategy will achieve further improvement for pathological images in the future.
6 Conclusion
This paper proposes the Self-reform Multilayer Transformer (SMT) to solve the extremely time and space consuming problem of pathological image diagnosis and prognosis. The forward focusing of SMT conducts layer-by-layer focus on critical regions from large scale to small scale. And the backward rethinking strategy optimizes former layers training with more detailed features. Through the iterative interactions of this cyclic process, the proposed SMT can achieve fast and accurate classification on various pathological datasets. Compared with existing methods, the SMT drastically reduces the inference of each gigapixel slide to only 2.17 ∼ 5.65 seconds without additional storage, achieving an average acceleration of 162.25 times with comparable performance. Moreover, the ablation study found that only 4 ∼ 8 high-response patches of each layer are required to enable SMT to achieve high accuracy in most datasets, while further increasing the patch number does not yield significant benefits. The conclusion of this paper indicates that the omission of inessential or repetitive regions can improve efficiency while guaranteeing high accuracy, which can provide a new perspective for future task on pathological images.
Acknowledgements
This work is supported by National Natural Science Foundation of China (62376248), Zhejiang Province High-Level Talents Special Support Program "Leading Talent of Technological Innovation of Ten-Thousands Talents Program" (No. 2022R52046).
@inproceedings{ijcai2024p178,
  title     = {Hundredfold Accelerating for Pathological Images Diagnosis and Prognosis through Self-reform Critical Region Focusing},
  author    = {Yu, Xiaotian and Luo, Haoming and Hu, Jiacong and Zhang, Xiuming and Wang, Yuexuan and Liang, Wenjie and Bei, Yijun and Song, Mingli and Feng, Zunlei},
  booktitle = {Proceedings of the Thirty-Third International Joint Conference on
               Artificial Intelligence, {IJCAI-24}},
  publisher = {International Joint Conferences on Artificial Intelligence Organization},
  editor    = {Kate Larson},
  pages     = {1607--1615},
  year      = {2024},
  month     = {8},
  note      = {Main Track},
  doi       = {10.24963/ijcai.2024/178},
  url       = {https://doi.org/10.24963/ijcai.2024/178},
}
TY - CPAPER TI - Hundredfold Accelerating for Pathological Images Diagnosis and Prognosis through Self-reform Critical Region Focusing AU - Yu, Xiaotian AU - Luo, Haoming AU - Hu, Jiacong AU - Zhang, Xiuming AU - Wang, Yuexuan AU - Liang, Wenjie AU - Bei, Yijun AU - Song, Mingli AU - Feng, Zunlei T2 - Proceedings of the Thirty-Third International Joint Conference on Artificial Intelligence, IJCAI-24 PB - International Joint Conferences on Artificial Intelligence Organization PY - 2024 SP - 1607 EP - 1615 DO - 10.24963/ijcai.2024/178 UR - https://doi.org/10.24963/ijcai.2024/178 ER -Copied
Machine-readable versions of this paper, for tools and AI agents:





