
The Moodoo Library: Quantitative Metrics to Model How Teachers Make Use of the Classroom Space by Analysing Indoor Positioning Traces (Extended Abstract)
Proceedings of the Thirtieth International Joint Conference on Artificial Intelligence. Sister Conferences Best Papers. Pages 4799-4803.
https://doi.org/10.24963/ijcai.2021/654
Keywords
- Humans and AI: Computer-Aided Education
- Machine Learning Applications: Humanities
- Multidisciplinary Topics and Applications: Ubiquitous Computing Systems
- Humans and AI: Human-Computer Interaction
Abstract
Teachers’ spatial behaviours in the classroom can strongly influence students’ engagement, motivation and other behaviours that shape their learning. However, classroom teaching behav-iour is ephemeral, and has largely remained opaque to computational analysis. This paper presents a library called ‘Moodoo’ that can serve to automatically model how teachers make use of the classroom space by analysing indoor positioning traces. The system automatically ex-tracts spatial metrics (e.g. teacher-student ratios, frequency of visits to students’ personal spaces, presence in classroom spaces of interest, index of dispersion and entropy), mapping from the teachers’ low-level positioning data to higher-order spatial constructs.
- [Ahuja, et al., 2019] Karan Ahuja, Dohyun Kim, Franceska Xhakaj, Virag Varga, Anne Xie, Stanley Zhang, Jay Eric Townsend, Chris Harrison, Amy Ogan and Yuvraj Agarwal (2019). EduSense: Practical Classroom Sensing at Scale Proceedings of the ACM on Interactive, Mobile, Wearable and Ubiquitous Technologies, 3, (3): 1-26, 2019.
- [Altieri, et al., 2018] L. Altieri, D. Cocchi and G. Roli (2018). A new approach to spatial entropy measures. Environmental and Ecological Statistics, 25, (1): 95-110, 2018.
- [An, et al., 2018] Pengcheng An, Saskia Bakker, Sara Ordanovski, Ruurd Taconis and Berry Eggen. 2018. ClassBeacons: Designing Distributed Visualization of Teachers' Physical Proximity in the Classroom. In Procedings. of the International Conference on Tangible, Embedded, and Embodied Interaction, TEI'18, pages 357-367, 2018. ACM
- [Andersen, 2009] Peter Andersen. 2009. Proxemics. SAGE Publications, Inc., City, 808-808.
- [Arends, 2014] Richard Arends. 2014. Learning to teach. McGraw-Hill Higher Education, New York, USA.
- [Batty, et al., 2014] Michael Batty, Robin Morphet, Paolo Masucci and Kiril Stanilov (2014). Entropy, complexity, and spatial information. Journal of geographical systems, 16, (4): 363-385, 2014.
- [Bosch, et al., 2018] Nigel Bosch, Caitlin Mills, Jeffrey D Wammes and Daniel Smilek. 2018. Quantifying Classroom Instructor Dynamics with Computer Vision. In Procedings. of the International Conference on Artificial Intelligence in Education, AIED'18, pages 30-42, 2018. Springer
- [Britton, et al., 2010] Linda R. Britton and Kenneth A. Anderson (2010). Peer coaching and pre-service teachers: Examining an underutilised concept. Teaching and Teacher Education, 26, (2): 306-314, 2010.
- [Dugan, et al., 2008] Kimberly Dugan and Margaret Letterman (2008). Student appraisals of collaborative teaching. College Teaching, 56, (1): 11-15, 2008.
- [Echeverria, et al., 2018] Vanessa Echeverria, Roberto Martinez-Maldonado, Tamara Power, Carolyn Hayes and Simon Buckingham Shum. 2018. Where Is the Nurse? Towards Automatically Visualising Meaningful Team Movement in Healthcare Education. In Procedings. of the International Conference on Artificial Intelligence in Education, AIED'18, pages 74-78, 2018. Springer, Cham [Fischer, 2019]
- Manfred M Fischer. 2019. Spatial analytical perspectoves on GIS. Routledge, London, UK.
- [Fletcher, 2018] Jeffrey A Fletcher (2018). Peer observation of teaching: a practical tool in higher education. The Journal of Faculty Development, 32, (1): 51-64, 2018.
- [Gastwirth, 1972] Joseph L Gastwirth (1972). The estimation of the Lorenz curve and Gini index. The review of economics statistics: 306-316, 1972.
- [Graziano, et al., 2012] Kevin J Graziano and Lori A Navarrete (2012). Co-teaching in a teacher education classroom: Collaboration, compromise, and creativity. Issues in Teacher Education, 21, (1): 109-126, 2012.
- [Hazari, et al., 2015] Zahra Hazari, Cheryl Cass and Carrie Beattie (2015). Obscuring power structures in the physics classroom: Linking teacher positioning, student engagement, and physics identity development. Journal of Research in Science Teaching, 52, (6): 735-762, 2015.
- [Hesler, 1972] Marjorie Walsh Hesler An Investigation of Instructor Use of Space. Dissertation, Purdue University, 1972.
- [Hutt, et al., 2019] Stephen Hutt, Kristina Krasich, Caitlin Mills, Nigel Bosch, Shelby M White, James R Brockmole and Sidney K D'Mello (2019). Automated Gaze-Based Mind Wandering Detection during Computerized Learning in Classrooms. Journal of User Modeling and User-Adapted Interaction, 2019.
- [Jensen, et al., 2020] Emily Jensen, Meghan Dale, Patrick J. Donnelly, Cathlyn Stone, Sean Kelly, Amanda Godley and Sidney K. D'Mello. 2020. Toward Automated Feedback on Teacher Discourse to Enhance Teacher Learning. In Procedings. of the Proceedings of the 2020 CHI Conference on Human Factors in Computing Systems, pages 1-13, 2020. Association for Computing Machinery [
- [Kress, et al., 2005] Gunther R Kress, Anton Franks, Carey Jewitt and Jill Bourne. 2005. English in urban classrooms: A multimodal perspective on teaching and learning. Psychology Press.
- [Lim, et al., 2012] F. V. Lim, K. L. O'Halloran and A. Podlasov (2012). Spatial pedagogy: mapping meanings in the use of classroom space. Cambridge Journal of Education, 42, (2): 235-251, 2012.
- [Martinec, 2001] Radan Martinec (2001). Interpersonal resources in action. Semiotica, 135, (1/4): 117-146, 2001.
- [Martinez-Maldonado, et al., 2018] Roberto Martinez- Maldonado, Vanessa Echeverria, Olga C. Santos, Augusto. D. P. Dos Santos and Kalina Yacef. 2018. Physical learning analytics: A multimodal perspective. In Procedings. of the 8th International Conference on Learning Analytics and Knowledge, LAK 2018, pages 375-379, 2018. Association for Computing Machinery [
- [Martinez-Maldonado, 2019] Roberto Martinez-Maldonado. 2019. I Spent More Time with that Team: Making Spatial Pedagogy Visible Using Positioning Sensors. In Procedings. of the International Conference on Learning Analytics & Knowledge, LAK'19, pages 21-25, 2019. ACM
- [Martinez-Maldonado, et al., 2020] Roberto Martinez- Maldonado, Vanessa Echeverria, Jurgen Schulte, Antonette Shibani, Katerina Mangaroska and Simon Buckingham Shum. 2020. Moodoo: indoor positioning analytics for characterising classroom teaching. In Procedings. of the International Conference on Artificial Intelligence in Education, pages 360-373, 2020. Springer
- [Martinez-Maldonado, et al., 2020] Roberto Martinez- Maldonado, Jurgen Schulte, Vanessa Echeverria, Yuveena Gopalan and Simon Buckingham Shum (2020). Where is the teacher? Digital analytics for classroom proxemics. Journal of Computer Assisted Learning, 2020.
- [Morshed, et al., 2019] Mehrab Bin Morshed, Koustuv Saha, Richard Li, Sidney K D'Mello, Munmun De Choudhury, Gregory D Abowd and Thomas Plötz (2019). Prediction of mood instability with passive sensing. Proceedings of the ACM on Interactive, Mobile, Wearable and Ubiquitous Technologies, 3, (3): 1-21, 2019.
- [O'Neill, et al., 2014] Sue C O'Neill and Jennifer Stephenson (2014). Evidence-based classroom and behaviour management content in Australian pre-service primary teachers' coursework: Wherefore art thou? Australian Journal of Teacher Education, 39, (4): 1-22, 2014.
- [Saquib, et al., 2018] Nazmus Saquib, Ayesha Bose, Dwyane George and Sepandar Kamvar (2018). Sensei: Sensing Educational Interaction. Proceedings of the ACM on Interactive, Mobile, Wearable and Ubiquitous Technologies, 1, (4): 1-27, 2018.
- [Seals, et al., 1975] James M Seals and Peter A Kaufman (1975). Effects of nonverbal behavior on student attitudes in the college classroom. Humanist Educator, 14, (2): 51- 55, 1975.
- [Shortland, 2004] Sue Shortland (2004). Peer observation: A tool for staff development or compliance? Journal of Further and Higher Education, 28, (2): 219-228, 2004.
- [Sousa, et al., 2016] Maurício Sousa, Daniel Mendes, Daniel Medeiros, Alfredo Ferreira, João Madeiras Pereira and Joaquim Jorge. 2016. Remote Proxemics. In Collaboration Meets Interactive Spaces, Craig Anslow, Pedro Campos and Joaquim Jorge (Eds.). Springer International Publishing, Cham, 47-73.
References were extracted automatically from the PDF and may contain errors.
Full text extracted automatically from the PDF; figures, tables and equations may differ. The PDF is the version of record.
1 Introduction and Background
Previous research has found that teachers' positioning in the classroom and proximity to students can strongly influence critical educationally relevant aspects such as students' engagement, motivation, disruptive behaviour, and self-efficacy [see review by O'Neill, et al., 2014]. This is why teaching guides [e.g. Arends, 2014] and professional support staff and peers [Britton, et al., 2010] often recommend or prescribe to teachers how to position themselves in specific locations of the classroom. These guides and feedback from peers are important for many teachers, particularly for those teaching assistants or tutors in higher-education (HE) who rarely receive formal pedagogical training and feedback on how to position themselves in the classroom. Unfortunately, these teaching guides typically do not refer to the evidence used to prescribe certain spatial behaviours.
1 Moodoo is a fictional character (a tracker) in the Australian film Rabbit-Proof Fence. Aboriginal trackers could find people and things by noticing seemingly minute details, such as the way a footprint has been made.
Most research with a focus on understanding spatial aspects of classroom teaching rely on observations or peer/selfassessments [Britton, et al., 2010]. Yet, these strategies are hard to scale up [Fletcher, 2018] and frequently are susceptible to bias [Shortland, 2004]. Questions thus remain regarding how to identify optimal positions where teachers should place themselves during a class, how particular learning spaces should be arranged to ensure maximum student engagement, and how teachers can gain insights into their own pedagogical approaches and spatial behaviours. Again, this is largely because of current limitations in methods to capture and analyse evidence about spatial aspects of the classroom.
Despite the online learning revolution, physical classrooms remain pervasive across all educational levels, but classroom activity has largely remained opaque to computational analysis [Martinez-Maldonado, et al., 2018], with only a small number of artificial intelligence (AI) and analytics innovations targeting physical aspects of teaching and learning. For example, there is a growing interest in using novel sensing technologies to automatically analyse classroom activity traces to model behaviours such as students' engagement [Hutt, et al., 2019] and mood [Morshed, et al., 2019]; teachers interactions [Bosch, et al., 2018] and discourse [Jensen, et al., 2020] during lectures and students' physical activity [Ahuja, et al., 2019].
Tracking systems have emerged recently, enabling the automated capture of positioning and proximity traces from authentic classrooms. Different technologies have been used to this end, including wearable devices attached to students' shoes [Saquib, et al., 2018], computer-vision systems [Ahuja, et al., 2019], and indoor positioning trackers [Echeverria, et al., 2018]. Some systems even summarise the time a teacher has spent in close proximity to a student or group of students, to raise an alarm if a threshold is reached [e.g. An, et al., 2018; Martinez-Maldonado, 2019]. However, very little work has been done in exploring what kinds of metrics researchers can generate from low-level x-y positioning data that could be useful to characterise classroom activity in ways that are meaningful to teachers.
2 An earlier version of this paper, titled Moodoo: indoor positioning analytics for characterising classroom teaching [MartinezMaldonado, et al., 2020], is the foundation for this extended abstract.
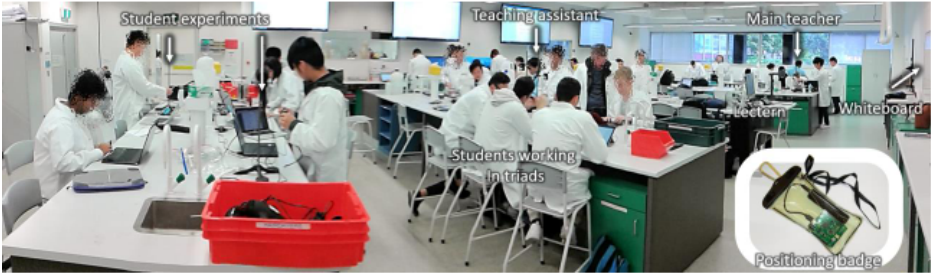
This paper presents Moodoo, a system for modelling spatial teaching dynamics. We build on the foundations of Spatial Analysis [Fischer, 2019] and Spatial Pedagogy [Lim, et al., 2012], to explore and propose a set of metrics that can help in characterising teachers' spatial strategies in a classroom. We deployed the system in an authentic physics education study, in which seven teachers wore indoor positioning trackers while teaching in pairs (see Figure 1), enacting three distinct learning designs. In total we analysed 18 classes and use the findings to map the x-y positional data to higher-order spatial constructs, and propose a composable library of algorithms that can be used to study instructional behaviour in different teaching scenarios.
This paper is a succinct version of a longer paper presented at the International Conference of Artificial intelligence in Education, 2020 [Martinez-Maldonado, et al., 2020] which received the best paper award. The current extended abstract presents the indoor positioning metrics. More details about the application of such metrics on an authentic study can be found in the main article.
2 Indoor Positioning Metrics
This subsection presents the metrics defined for teachers' positioning, grounded in the notion of Spatial Pedagogy [Lim, et al., 2012]. The metrics have been implemented as a composable, open source library in Python [link].
2.1 Metrics Related to Teachers' Stops
A teacher's stop is defined as a sequence of positioning data points that are a short distance apart in space and time. According to the notion of SP, this can denote a period in which the teacher is "positioned to conduct formal teaching" or stands "alongside the students' desk or between rows" of seats to interact with students [Lim, et al., 2012, pp. 237].
Thus, a stop can be modelled from x-y teacher's data grouping data points based on a centroid C(x,y) point, distance d and time t parameters; where d is the maximum distance from the current data point to C, and t is the minimum time to group consecutive points (see Figure 1). For example, for our illustrative study we chose d=1 meter, since this distance is considered within a teacher's personal space [Sousa, et al., 2016]; and t=10 seconds to disregard very short stops. These parameters can be further calibrated according to the context and the tracking technology used. From the defined stop construct, other metrics can be calculated, such as the total or partial number of stops, average stopping time; or more complex metrics in relation to other sources of evidence, such as student locations and classroom resources (e.g. work-benches).
2.2 Metrics Related to Teachers' Transitions
Considering the conventional stages in the development of a class lecture and the nature of the required interaction, teachers organise themselves spatially by constructing four different types of space (i.e., authoritative, personal, supervisory, and interactional) in the classroom [Lim, et al., 2012]. For example, the teacher paces "alongside the rows of students' desks as well as up and down the side of the classroom transforming these sites into supervisory spaces" [Lim, et al., 2012, pp. 238]. Moreover, various studies reported that effective teachers move more, compared to "average" teachers [Seals, et al., 1975], and that teachers are more effective when they move equally between the right and left sides of a classroom [Hesler, 1972]. Another example considering kinesthetic patterns, showed that a teacher's slow and deliberate movement as 'invigilating' can be perceived as 'a patrol' and might have a negative impact on students' attitudes [Kress, et al., 2005].

A teacher's transition is defined as a sequence of positioning data points that follow a trajectory between two stops. This includes all those positioning traces generated while, for example, the teacher moves from attending one group of students to another group. A linear quadratic estimation algorithm (i.e. Kalman filtering) was applied as a pre-processing step in order to convert the x-y data points into smooth walking trajectories. Next, the teacher's walking trajectory is modelled as the transition between two consecutive stops in relation to their centroids (see Figure 2, right). From teachers' transitions, other related metrics can also be calculated, such as the distance walked, speed and acceleration, and the transitions between specific groups of students or classroom areas.
2.3 Metrics of Teacher-Student Interactions
Lim et al. [2012] proposed that a space in the classroom becomes interactional when the teacher is in sufficiently close proximity to students to enable conversations or consultation. The close proximity between a teacher and students reduces the previous established hierarchical and interpersonal distance, and facilitates interaction. In a study by Hazari, et al. [2015], the authors reported that when teachers position themselves with greater proximity to students (creating fewer traditional physical boundaries), students' engagement increased. In fact, how teachers physically position themselves is fundamentally focused on power. For example, a teacher can assert power and authority through spatial distance (i.e., positioning in the centre of a classroom or at the back of a classroom creating surveillance from a vantage point) or through language and gestural communication. This way teachers can create learning environments where students do not feel comfortable to speak up, engage, and respond.
Although the interactional space may be shaped by the learning task, furniture, and preferences [Andersen, 2009], extensive work studying cultural aspects of space has identified that a distance from 0.75 to 1.2 meters creates optimal opportunities for social interaction [Martinec, 2001]. Hence, a teacher standing within the interactional space of students (iDis) can be classified as a potential teacher-student interaction. In our study, we accounted for the parameter iDis = 1 meter [based on Martinec, 2001] as the maximum distance to define a teacher's stop within certain students' interactional space. From this construct, other metrics can be calculated, such as teachers' total attention time per student/group, frequency and duration of teachers attending certain students, and sequencing of teacher-student interactions.
Additionally, an index of dispersion can be calculated to identify how evenly teachers' attention is distributed in terms of the number of visits and the total time spent with each student or group. In our illustrative study, we calculated the Gini index [Gastwirth, 1972], which is commonly used to model inequality or dispersion (with a single coefficient output ranging from 0 to 1, where 0 represents perfect equality of attention to each group).
2.4 Metrics Related to Classroom Resources
Teachers' proximity to certain resources in the classroom also gives meaning to x-y data. For example, teachers create an authoritative space when they conduct a formal briefing to students before they start a group activity, as well as a personal space when they spend time behind their desks to prepare for the next stage in the lecture [Lim, et al., 2012]. Positioning in the classroom according to the resources of interest thus takes on different meanings, and requires different usage of semiotic resources (e.g. gesture, language) for effective pedagogical discourse. In our study, the teacher's close proximity to the lectern or a whiteboard can be indicative of activities such as lecturing to the whole class or explaining formulas. For this purpose, the parameter dObj delimits the proximity of objects of interests that are close to the teacher (calibrated to 1 meter in the study)
2.5 Metrics Related to Co-teaching
Having more than one teacher in the classroom is a common practice. However, we note that co-teaching brings as many challenges as opportunities in higher education. On the positive side, it varies in content presentation, allows for individualised instruction, and more easily supports scaffold learning experiences [Graziano, et al., 2012]. On the negative side, many studies have reported mixed feelings about co-teaching among students [Dugan, et al., 2008]. Mostly, students feel anxious, fail to understand expectations, and have concerns when it comes to grading. Yet, students also believe that because of different perspectives, co-teaching opens more opportunities for engagement between teachers and students [Graziano, et al., 2012].
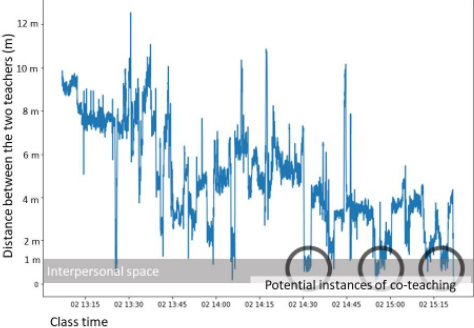
Modelling the instances when both teachers are within each other's inter-personal spaces (dTeacher), for longer than a set period of time (tTeacher), can assist teachers to reflect how often and where this occurs. Figure 3 illustrates how potential co-teaching incidents were automatically classified when the teachers' inter-personal distance fell within the threshold parameters. In our study, the parameter dTeacher was set to 1 m and tTeacher to 10 seconds, similar to the heuristic considered above [Martinec, 2001].
2.6 Metrics Related to Spatial Entropy
From findings in a qualitative study [Martinez-Maldonado, et al., 2020], teachers contrasted two extreme mobility behaviours: 1) a teacher walking around the classroom mostly supervising, without engaging much with students (unfocused positional presence), and 2) a teacher focusing most of his/her attention on a small number of students or remaining only in specific spaces of the classroom (focused presence). From the x-y positioning data, the spectrum between these two extreme behaviours can be modelled based on the notion of spatial entropy [Batty, et al., 2014] which has been used to measure information density in spatial data [Altieri, et al., 2018]. To calculate the entropy, we create a m-by-m grid (m = 1 meter in our illustrative study) from the two-dimensional x-y data. The proportion of data points in each cell of the grid is calculated, creating a matrix of proportions. This is then vectorised and Shannon entropy is calculated (resulting in a positive number in bits). The closer the number is to zero, the more focused teacher's positioning was to specific students or spaces in the classroom.
3 Conclusion
This paper presented a set of conceptual mappings from x-y positional data of teachers to higher-order spatial constructs (namely: teacher's stops, transitions, teacher-student interactions, proximity to objects of interest, instances of co-teaching and entropy of teachers' movement), informed by the concept of Spatial Pedagogy [2012]. The resulting metrics, implemented in open source code, offer researchers new tools to study classroom activity in novel ways, developing our understanding of teacher-student proximity and physical behaviours at various learning settings. Further maturation of the tools opens the possibility for more evidence-based teacher professional development, bearing in mind our cautions regarding the need for training with such tools, and the risks around unethical use of such data.
Acknowledgments
Roberto Martinez-Maldonado's research is partly funded by Jacobs Foundation.
@inproceedings{ijcai2021p654,
  title     = {The Moodoo Library: Quantitative Metrics to Model How Teachers Make Use of the Classroom Space by Analysing Indoor Positioning Traces (Extended Abstract)},
  author    = {Martinez-Maldonado, Roberto and Echeverria, Vanessa and Mangaroska, Katerina and Shibani, Antonette and Fernandez-Nieto, Gloria and Schulte, Jurgen and Shum, Simon Buckingham},
  booktitle = {Proceedings of the Thirtieth International Joint Conference on
               Artificial Intelligence, {IJCAI-21}},
  publisher = {International Joint Conferences on Artificial Intelligence Organization},
  editor    = {Zhi-Hua Zhou},
  pages     = {4799--4803},
  year      = {2021},
  month     = {8},
  note      = {Sister Conferences Best Papers},
  doi       = {10.24963/ijcai.2021/654},
  url       = {https://doi.org/10.24963/ijcai.2021/654},
}
TY - CPAPER TI - The Moodoo Library: Quantitative Metrics to Model How Teachers Make Use of the Classroom Space by Analysing Indoor Positioning Traces (Extended Abstract) AU - Martinez-Maldonado, Roberto AU - Echeverria, Vanessa AU - Mangaroska, Katerina AU - Shibani, Antonette AU - Fernandez-Nieto, Gloria AU - Schulte, Jurgen AU - Shum, Simon Buckingham T2 - Proceedings of the Thirtieth International Joint Conference on Artificial Intelligence, IJCAI-21 PB - International Joint Conferences on Artificial Intelligence Organization PY - 2021 SP - 4799 EP - 4803 DO - 10.24963/ijcai.2021/654 UR - https://doi.org/10.24963/ijcai.2021/654 ER -Copied
Machine-readable versions of this paper, for tools and AI agents:





