
Dynamic Rebalancing Dockless Bike-Sharing System based on Station Community Discovery
Proceedings of the Thirtieth International Joint Conference on Artificial Intelligence. Main Track. Pages 4136-4143.
https://doi.org/10.24963/ijcai.2021/569
Keywords
- Planning and Scheduling: Applications of Planning
- Planning and Scheduling: Planning and Scheduling
Abstract
Influenced by the era of the sharing economy and mobile payment, Dockless Bike-Sharing System (Dockless BSS) is expanding in many major cities. The mobility of users constantly leads to supply and demand imbalance, which seriously affects the total profit and customer satisfaction. In this paper, we propose the Spatio-Temporal Mixed Integer Program (STMIP) with Flow-graphed Community Discovery (FCD) approach to rebalancing the system. Different from existing studies that ignore the route of trucks and adopt a centralized rebalancing, our approach considers the spatio-temporal information of trucks and discovers station communities for truck-based rebalancing. First, we propose the FCD algorithm to detect station communities. Significantly, rebalancing communities decomposes the centralized system into a distributed multi-communities system. Then, by considering the routing and velocity of trucks, we design the STMIP model with the objective of maximizing total profit, to find a repositioning policy for each station community. We design a simulator built on real-world data from DiDi Chuxing to test the algorithm performance. The extensive experimental results demonstrate that our approach outperforms in terms of service level, profit, and complexity compared with the state-of-the-art approach.
- [Ai et al., 2019] Yi Ai, Zongping Li, Mi Gan, Yunpeng Zhang, Daben Yu, Wei Chen, and Yanni Ju. A deep learning approach on short-term spatiotemporal distribu- tion forecasting of dockless bike-sharing system. Neural Computing and Applications, 31(5):1665-1677, 2019.
- [Barabonkov et al., 2020] Damian Barabonkov, Samantha D'Alonzo, Joseph Pierre, Dániel Kondor, Xiaohu Zhang, and Mai Anh Tien. Simulating and evaluating rebalanc- ing strategies for dockless bike-sharing systems. CoRR, abs/2004.11565, 2020.
- [Blondel et al., 2008] Vincent D Blondel, Jean-Loup Guil- laume, Renaud Lambiotte, and Etienne Lefebvre. Fast unfolding of communities in large networks. Jour- nal of statistical mechanics: theory and experiment, 2008(10):P10008, 2008.
- [Chen et al., 2018] Jingxu Chen, Zhibin Li, Wei Wang, and Hang Jiang. Evaluating bicycle-vehicle conflicts and de- lays on urban streets with bike lane and on-street parking. Transportation letters, 10(1):1-11, 2018.
- [Dong et al., 2019] Jian Dong, Bin Chen, Lingnan He, Chuan Ai, Fang Zhang, Danhuai Guo, and Xiaogang Qiu. A spatio-temporal flow model of urban dockless shared bikes based on points of interest clustering. ISPRS Int. J. Geo Inf., 8(8):345, 2019.
- [Duan and Wu, 2019] Yubin Duan and Jie Wu. Optimizing rebalance scheme for dock-less bike sharing systems with adaptive user incentive. In 2019 20th IEEE International Conference on Mobile Data Management (MDM), pages 176-181, 2019.
- [Forgy, 1965] Edward W Forgy. Cluster analysis of multi- variate data: efficiency versus interpretability of classifi- cations. biometrics, 21:768-769, 1965.
- [Ghosh and Varakantham, 2017] Supriyo Ghosh and Pradeep Varakantham. Incentivizing the use of bike trailers for dynamic repositioning in bike sharing systems. In Proceedings of the Twenty-Seventh International Con- ference on Automated Planning and Scheduling, ICAPS 2017, Pittsburgh, Pennsylvania, USA, June 18-23, 2017, pages 373-381, 2017.
- [Ghosh et al., 2019] Supriyo Ghosh, Jing Yu Koh, and Patrick Jaillet. Improving customer satisfaction in bike sharing systems through dynamic repositioning. In Pro- ceedings of the Twenty-Eighth International Joint Confer- ence on Artificial Intelligence, IJCAI 2019, Macao, China, August 10-16, 2019, pages 5864-5870, 2019. IJCAI
- [Hua et al., 2020] Mingzhuang Hua, Jingxu Chen, Xuewu Chen, Zuoxian Gan, Pengfei Wang, and De Zhao. Fore- casting usage and bike distribution of dockless bike- sharing using journey data. IET Intelligent Transport Sys- tems, 14(12):1647-1656, 2020.
- [Jing et al., 2018] Weipeng Jing, Jian Kang, and Meiling Liu. Mining taxi trajectories for most suitable stations of sharing bikes to ease traffic congestion. IET Intelligent Transport Systems, 12(7):586-593, 2018.
- [Ke et al., 2017] Jintao Ke, Hongyu Zheng, Hai Yang, and Xiqun Michael Chen. Short-term forecasting of passenger demand under on-demand ride services: A spatio-temporal deep learning approach. Transportation Research Part C: Emerging Technologies, 85:591-608, 2017.
- [Li et al., 2018] Yexin Li, Yu Zheng, and Qiang Yang. Dy- namic bike reposition: A spatio-temporal reinforcement learning approach. In Proceedings of the 24th ACM SIGKDD International Conference on Knowledge Discov- ery & Data Mining, KDD 2018, London, UK, August 19- 23, 2018, pages 1724-1733, 2018.
- [Liu and Xu, 2018a] Ming Liu and Xifen Xu. A data-driven optimization method for reallocating the free-floating bikes. In Service-Oriented Computing -ICSOC 2018 Workshops -ADMS, ASOCA, ISYyCC, CloTS, DDBS, and NLS4IoT, Hangzhou, China, November 12-15, 2018, Re- vised Selected Papers, volume 11434, pages 3-13, 2018.
- [Liu and Xu, 2018b] Ming Liu and Xifen Xu. Dockless bike- sharing reallocation based on data analysis: Solving com- plex problem with simple method. In Third IEEE Inter- national Conference on Data Science in Cyberspace, DSC 2018, Guangzhou, China, June 18-21, 2018, pages 445- 450, 2018.
- [Lv et al., 2020] Hongtao Lv, Fan Wu, Tie Luo, Xiaofeng Gao, and Guihai Chen. Hardness of and approximate mechanism design for the bike rebalancing problem. Theor. Comput. Sci., 803:105-115, 2020.
- [Newman and Girvan, 2004] Mark EJ Newman and Michelle Girvan. Finding and evaluating community structure in networks. Physical review E, 69(2):026113, 2004.
- [Pal and Zhang, 2017] Aritra Pal and Yu Zhang. Free- floating bike sharing: Solving real-life large-scale static rebalancing problems. Transportation Research Part C: Emerging Technologies, 80:92-116, 2017.
- [Pan et al., 2019] Ling Pan, Qingpeng Cai, Zhixuan Fang, Pingzhong Tang, and Longbo Huang. A deep reinforce- ment learning framework for rebalancing dockless bike sharing systems. In The Thirty-Third AAAI Conference on Artificial Intelligence, AAAI, pages 1393-1400, 2019.
- [Qin et al., 2018] Rongshen Qin, Linghe Kong, Minyi Guo, Bin Yao, and Mohsen Guizani. Rebalance modern bike sharing system: Spatio-temporal data prediction and path planning for multiple carriers. In 2018 IEEE 24th Inter- national Conference on Parallel and Distributed Systems (ICPADS), pages 1-6, 2018.
- [Shen et al., 2018] Yu Shen, Xiaohu Zhang, and Jinhua Zhao. Understanding the usage of dockless bike sharing in singapore. International Journal of Sustainable Trans- portation, 12(9):686-700, 2018.
- [Waserhole and Jost, 2016] Ariel Waserhole and Vincent Jost. Pricing in vehicle sharing systems: optimization in queuing networks with product forms. EURO J. Transp. Logist., 5(3):293-320, 2016.
References were extracted automatically from the PDF and may contain errors.
Full text extracted automatically from the PDF; figures, tables and equations may differ. The PDF is the version of record.
1 Introduction
Bike-sharing provides an environment-friendly and convenient travel mode for urban transportation [Chen et al., 2018]. Dockless Bike-Sharing System (Dockless BSS), as an innovation Bike-Sharing System (BSS), is expanding in many major cities influenced by the era of the sharing economy and mobile payment. Comparing with traditional Dock-based BSS, Dockless BSS provides a more flexible transport mode for customers. Customers can rent and return the bike at any valid place through their smart-phone app. This relieves customers' concerns about finding empty docks when they want to rent bikes or getting into fully occupied stations when they want to return them[Pan et al., 2019].
∗Contact Author
However, due to the high similar travel patterns of customers, Dockless BSS often faces the phenomenon of asymmetric supply and demand, which is referred as imbalance. For example, customers ride bikes from the neighborhoods to the subway stations or Central Business District (CBD) during morning peak hours. Consequently, substantial idle bikes are stacking near the subway stations and CBD, and no available bike around the neighborhoods. In the evening peak, the situation is the opposite. This imbalance phenomenon leads to the decrease of the overall profit and service satisfaction of customers. In the worst case, unsatisfied customers would leave the system forever [Ghosh et al., 2019]. Therefore, rebalancing the system is a critical task for the sustainable development of Dockless BSS [Hua et al., 2020].
Currently, the system operators have proposed truck-based rebalancing and user-based rebalancing approaches to solve the critical task. User-based rebalancing involves incentivizing users with a reward to rent or return bike to a specific location [Li et al., 2018]. Obviously, the effectiveness of userbased rebalancing heavily depends on users' behavior, which is dynamic and highly uncertain. Truck-based rebalancing provides a more stable and useful approach, includes static rebalancing and dynamic rebalancing. Static rebalancing redistributes bikes to the predetermined initial conditions only once when the demand is negligible [Shen et al., 2018]. Dynamic rebalancing involves moving bikes throughout the day to fix imbalances during rush hours. The main studies adopt models with different objectives to generate the repositioning policy, i.e., minimizing the moving distance [Qin et al., 2018; Liu and Xu, 2018b], maximizing the total profit [Liu and Xu, 2018a; Barabonkov et al., 2020]. However, to simplify the problem, existing works barely take into account the moving time of trucks, which determines whether the rebalancing policy can be completed timely. Moreover, the system operators often use tens of trucks to rebalance bikes over hundreds of stations simultaneously. Solving the rebalancing problem in such a big system is a complicated NP-hard problem [Lv et al., 2020].
To overcome the above problems, we propose the SpatioTemporal Mixed Integer Program (STMIP) with Flowgraphed Community Discovery (FCD) approach in this paper. First, we propose the FCD algorithm to define the abstract stations and detect the station communities based on the historical trip data. Then, we allocate trucks for each community to conduct inner-community rebalancing. Considering the routing and velocity for trucks, we design the STMIP model to maximize the total profit. Spatio-temporal information of trucks are of special interest to truck-based rebalancing, which determines whether the rebalancing policy can be achieved timely. However, existing works mostly ignore the sequence of visited stations and the moving time of trucks. STMIP model considers the routing and velocity of trucks and guarantees the repositioning policy can be completed in time. Furthermore, for the traditional centralized systems, solving the rebalancing problem, especially considering the spatio-temporal information [Ghosh et al., 2019], is of high complexity and time consuming, which makes it challenging to adapt to the online system. FCD algorithm decomposes it into a distributed multi-communities system and greatly reduces the complexity. Meanwhile, the solution of STMIP with FCD is near-optimal in aspects of service level and profit. Particularly, the contributions of this paper can be summarized into three-fold:
- We propose the FCD algorithm to define stations and discover station communities. Each station community is inner-balanced, which represents the dense inner flow and few inter net flow. The FCD algorithm decomposes the centralized control system into a distributed multicommunities system, which heavily reduces the complexity of the multi-trucks routing problem.
- We design the STMIP model, considering the routing and velocity of capacitated trucks, to generate a flexible repositioning policy. And the objective of the STMIP model is maximizing the total profit, which explores the trade-off between repositioning cost and service level.
- A simulator is designed built on the real-world data set from DiDi Chuxing to evaluate the effectiveness of rebalancing approaches. The extensive experimental results show that our approach performs better than the existing state-of-the-art approach in improving the system profit and service level.
2 RelatedWorks
Sparked by the development and advantages of Dockless BSS, there have been a considerable set of works focused on station definition and rebalancing methods for Dockless BSS.
Station Definition. Most of existing studies easily defined the small squares with equal size as abstract stations. [Ke et al., 2017] and [Ai et al., 2019] partitioned the urban into I × J grid areas to forecast short-term demand. [Dong et al., 2019] proposed the points of interest-based (POI-based) clustering to find stations. Nevertheless, all of the above approaches only considered the geographical information, and ignored the information of historical trip records, i.e., start and end locations. Locations information is crucial for Dockless BSS study, especially for system rebalancing. [Jing et al., 2018] proposed determining the most suitable places to deploy abstract stations by studying the taxi trajectory data. Meanwhile, [Liu and Xu, 2018b; Barabonkov et al., 2020]
used the k-means algorithm to get the clusters of historical locations, and treated cluster centers as stations. The results of k-means fully reflected the feature of historical trips, and make the station distribution uniform. However, since the expansion of urban size, the number of stations highly increases, which raises the difficulty and complexity of the rebalancing and routing problem. Discovering station communities provided a straightforward way to reduce the problem complexity. However, there are rare studies that focus on this field.
Rebalancing Method. The foremost problem of Dockless BSS is the imbalance problem. The main methods to solve this problem are truck-based rebalancing and user-based rebalancing. For user-based rebalancing, [Waserhole and Jost, 2016] formulated heuristic algorithm based on Maximum Circulation as a convex integer program to optimize the number of trips. [Ghosh et al., 2019] and [Duan and Wu, 2019] used reinforcement learning to generate price scheme for incentive. For truck-based rebalancing, the main method to generate repositioning policy is optimization model. [Lv et al., 2020] proved that finding an optimal solution for the bike rebalancing problem is NP-hard, and proposed a two-stage approximate mechanism to get the repositioning policy. [Pal and Zhang, 2017] designed Mixed Integer Linear Program (MILP) to solve the static rebalancing problem, and proposed the Nested Large Neighborhood Search and Variable Neighborhood Descente (NLNS + VND) algorithm to find the solution. Their algorithm can adapt to the scale increasing of static rebalancing problem. [Liu and Xu, 2018a] formulated static rebalancing problem as a multi-objective Mixed Integer Program (MIP) model about maximizing overall revenue in the shortest moving distances. Obviously, the effect of static rebalancing is limited, and experiments show that dynamic rebalancing often performs better than static. [Qin et al., 2018] offered an Improved Local Search Algorithm (ILSA) for multiple carriers routing to minimize routing cost. But the effect of ILSA fully depended on the prediction accuracy of demand. [Barabonkov et al., 2020] defined abstract stations by historical trip locations, and developed an MIP framework minimizing the lost profit. The experiment proved that their dynamic rebalancing always outperforms static. However, most of the above studies ignored the sequence of visited stations and the velocity of trucks, which determines whether the repositioning policy can be finished timely and affects the effectiveness of system rebalancing.
3 Problem Statement
Definition 1 (Flow). Inner flow for the community is the sum of trips whose start and end locations both belong to the current community. Inflow is the number of trips that start outside of the current station or community while end within it. Outflow is the opposite. Inter flow is the sum of inflow and outflow. Inter net flow is the difference between inflow and outflow. Total flow is the sum of inner flow and inter flow.
For truck-based rebalancing approach, there is a set of stations S = {1, 2, ...,N}, where N represents the number of stations. Depending on the demand d#i and the bike distribution d∗i of station i (i ∈ S), station i is defined as pickup station, if d∗i - d#i > 0, or delivery station, if d∗i - d#i ≤ 0. Meanwhile, there is a set of trucks V = {1, 2, ...,M}, where M represents the number of trucks. The operator assigns repositioning policy to trucks. Truck j (j ∈ V) follows the policy to remove bikes from pickup stations to delivery stations. Furthermore, to get the feasible repositioning policy for Dockless BSS, we face two basic problems about station setting and dynamic rebalancing and routing.
3.1 Station Setting
We extract the start and end locations from historical trip records of the last D days, and aggregate locations into N aggregation centers. N is determined by the area of rebalancing region. We define the aggregation centers as the abstract stations and get the weighted graph of flow based on historical trip records. Then, we apply community discovery process to get station communities C = {c1, c2, ..., cK}, where K represents the number of communities. The objective of community discovery is to make each community has dense inner flow and few inter net flow. Modularity is proposed to measure the quality of community discovery, and greater modularity index reflects the better effect of community discovery [Newman and Girvan, 2004]. Combining the definition of modularity [Blondel et al., 2008] with weighted graph of flow, we define the weighted modularity as:
where ∑in and ∑tot respectively represent the inner flow and the total flow for community ck, and m is the number of trips of the whole system.
After station setting, the centralized system becomes a distributed multi-communities system. We allocate trucks for each community to conduct inner-community rebalancing and without inter-community bikes moving. The number of trucks for each community is approximately linear with the number of stations belonging to it.
3.2 Dynamic Rebalancing and Routing
We extend the generic model of dynamic rebalancing and routing problem (DRRP) introduced by [Ghosh and Varakantham, 2017] for defining our problem. For each community ck, the problem can be represented using the following tuple:
There is a set of stations Sk = {sk1 , sk2 , ..., skn }, where n represents the number of stations belonging to the community ck, and a set of trucks Vk = {vk1 , vk2 , ..., vkm }, where m represents the number of trucks allocated to community ck. Cp∗v denotes the capacity of truck v, v ∈ Vk. d∗s and d#s respectively represent the bike distribution and predicted demand of station s, s ∈ Sk. Particularly, the predicted demand of station is calculated from the mean of its outflow of the last D days. σ0 represents the positional relationship between trucks and stations. Briefly, σ0 s,v is set to 1 if truck v is at station s and is 0 otherwise. Pk is a matrice and represents the distance between any two stations belonging to community ck.
For the ease of representation and evaluation, we make the following assumptions: (a) Customers are impatient with the system. Hence, if the original station has no available bike, customer leaves the system immediately instead of visiting other stations; (b) Bikes belonging to the same station are equivalent for customers. That is to say, the picked up probability of available bikes belonging to the same station are equal, regardless of its location; (c) Once the bike is picked up by trucks, it remains unavailable until it is dropped off at a station.
4 Methodology
The details of the STMIP with FCD approach are described in this section. In addition, the system simulator is illustrated at last, which simulates the dynamic process of STMIP with FCD approach for Dockless BSS.
4.1 FCDAlgorithm
The FCD algorithm has two key components: station definition and community discovery. We provide the details of these two components and identify the whole algorithm in Algorithm 1.
1) Station Definition. We extract the start and end locations from the historical trip records of the last D days,and use k-means clustering approach [Forgy, 1965] to find N aggregation centers, which are identified as abstract stations S. According to the sets of historical trip records and stations, it is easy to construct the weighted graph of flow. If there have trips between two stations, we add an edge between these two stations with weight of trips number wij, i, j ∈ S. Consequently, larger weight signifies higher frequency and denser relationship between two stations.
2) Community Discovery. Based on the weighted graph of flow, we propose an Improved Fast Unfolding (IFU) algorithm extended from [Blondel et al., 2008] to generate station communities C with maximizing the weighted modularity Q formulated as Eq.(1). We get the initial communities through modularity optimization and community aggregation stages. For modularity optimization, we firstly creat community set C based on the label set Label, which means collecting the station i (i ∈ S) that have same label value, i.e. labeli = k, into community ck. Then we change the community partition and numbers, until getting the maximum weighted modularity Q and corresponding label set Label. In particular, to avoid the situation that a community consists of only one station, we add the post-process to re-cluster the communities that only contain one station into other communities, according to minimum the inter net flow inf , defined as:
where ∑in and ∑out denote the total inflow and outflow of station i (i ∈ S ′ ) and community cj (j ∈ K), respectively.
4.2 STMIPModel
In this section, we formulate the objective and constraints of the STMIP model to generate a feasible repositioning policy
Algorithm 1 Flow-graphed Community Discovering (FCD)
Input: Location set L = {l1, ..., lp}, station number N. Output: Community set C 1: Selecting the centroides S = {1, 2, ...,N} through Kmeans algorithm [Forgy, 1965]. 2: for i = 1 →N do 3: labeli ← i. 4: end for 5: Label,Q←Modularity Optimization(Label, S). 6: Qbest = 0. 7: while Qbest! = Q do 8: Qbest = Q. 9: Creating community set C based on Label. 10: for k = 1 →K do 11: s′k ← center of ck. 12: label′k ← k. 13: end for 14: Label′ ,Q←Modularity Optimization(Label′ , S′ ) 15: for each j ∈ S do 16: labelj ← label′k , where sj ∈ ck. 17: end for 18: end while 19: for each ck only contains one si do 20: labeli ← arg minj∈Konfij . 21: cj ← cj ⋃ ci. 22: C ← C \ ci. 23: end for 24: return Cfor each community. At the start of rebalancing time slot t, the initial bike distribution d∗ and predicted demand d# of the community are given as the input to STMIP model. Meanwhile, we input the distribution of trucks including its location and the number of bikes present at it, which represented by σ0 s,v and d0v . Similar to the previous work focused on the Dock-based BSS rebalancing [Ghosh et al., 2019], we assume that the truck can visit a maximum of R stations within one time-slot t. To represent the sequence of visited stations for the truck, we divide time-slot t equally into R small time slots, referred to as episode r, r ∈ {1, . . . , R}.
The variables used in the STMIP model are defined as follows: Os denotes the maximum number of serviceable orders at station s during time-slot t. y+ s,v,r and ys,v,r represent the number of bikes picked up and dropped off by truck v at episode r at station s, respectively. drv denotes the number of bikes on the truck v at episode r. As noted, we define σr s,v to repersent the relationship of position between truck v and station s. And if truck v at episode r is present at station s, σr s,v is set to 1 and is set to 0, otherwise. Lrs,s′ ,v denotes the routing of truck v. Lrs,s′ ,v = 1 if truck v is present at station s at episode r - 1, and arrives at station s′ at episode r; Lrs,s′ ,v = 0, otherwise. Ps,s′ denotes the distance between station s and station s′ . u represents the reciprocal of constant velocity of trucks. Q represents the time length of one episode r, in second. The price of per order and the moving cost of per bike are represented by α and β. Then we present the formulation of the STMIP model in Table 1, and
Table 1: Spatio-Temporal Mixed Integer Program.
the physical meaning of the objective and constraints in the optimization problem are explained next.
The objective of the STMIP model is composed of order revenue and moving cost of the station set Sk. Here, the order revenue refers to the number of serviceable orders multiplied by the parameter α. And moving cost is the number of bikes dropped off multiplied by the parameter β.
Serviceable orders: Constraints (3)-(4) ensure that, during current rebalancing time-slot t for any station s, the maximum of serviceable orders is the minimum of available bikes and predicted demand of station s. We consider the situation that each bike is only rented once during the time-slot t.
Truck Capacity: Constraint (5) enforces that, for truck v at the episode r, the number of bikes at it is equivalent to the sum of bikes number of the previous episode r - 1 and the net flows of bikes picked up during episode r. Constraint (6) guarantees that if the truck v is present at station s at episode r, the number of bikes that picked up or dropped off by truck v at station s during episode r is bounded by the capacity of truck Cp∗v . Otherwise, the number is equal to 0. For each truck v at any episode r, constraint (11) guarantees that the number of bikes is less than the truck capacity.
Bike Availability: For each station s, the number of available bikes that can be picked up is the difference between supply d∗s and predicted demand d#s of it when d∗s -d#s > 0. Otherwise, station s has no available bike that can be picked up. Constraint (7) ensures that, during the rebalancing timeslot t, the total number of bikes picked up by all trucks at station s does not exceed the available bikes at it. The constraint enforces that the moving of bikes is under the premise that does not affects the original service level, which guarantees the effectiveness of repositioning policy.
Truck routing: Constraint (8) enforces that truck v can visit only one station s at any episode r. Constraint (9) ensures that, under the constant velocity, the time of truck v moving from current station s to next station s′ during episode r is not exceed the episode time Q.
We solve the STMIP model using the Python extension of the IBM ILOP CPLEX Optimization Studio version 12.9.
4.3 System Simulator
We establish a simulator to evaluate the approach's performance on real-world data. First, at the start of the day, FCD algorithm generates the stations S and station community set C, based on the historical trips of the last D days. Meanwhile, the predicted demand for each station during time-slot t is the mean of the last D days' trips during the same time-slot. We allocate Vk for each community ck to rebalancing bikes among stations belonging to ck. Then, we iterate the STMIP model over time-slot t increasing to achieve dynamic system rebalancing. At the beginning of time-slot t, we respectively input the distribution of bikes d∗ and predicted demand d# of the community to the STMIP model. And the distribution of trucks Vk is also given as an input. The solution of the STMIP model describes the repositioning policy, includes truck routing and the number of bikes that are picked up and dropped off by truck v at station s at episode r. Following the repositioning policy, we simulate the rent, return and reposition process in turn at each episode, and repeat it until the end of time-slot. For all communities, the above three processes are simulated simultaneously.
5 Experiment Results
To evaluate the performance of approaches, experiments are conducted on the datasets from 8/1/2020 to 8/31/2020 of the core area of Beijing from DiDi Chuxing. Each record includes the following field: bike ID, start time, end time, start location (consisted of longitude and latitude), and end location. Parameters for the STMIP with FCD approach are summarized as follows: the number of stations N is determined to be 110. The capacity of trucks C ∗ v is set to be 10 for the experiments. The accumulation days' of historical trips is set to D = 7. We divide a day into 48 time-slots, where t = 30 minutes. We assume that the average truck speed is 5 m/s, so the variable u is equal to 0.2 s/m. The price of per trip and the cost of per moving bike are set to 1.5 RMB and 1 RMB, respectively.
5.1 Baselines andMetrics
The stations set S generated by FCD algorithm is applied to all following approaches, which avoids the impact of different station sets on the approach. We compare the STMIP with FCD approach with the following approaches:
No Rebalancing (NR): We simulate the Dockless BSS without any system rebalancing.
MIP: [Barabonkov et al., 2020] proposed an MIP framework to generate the repositioning policy with objective of minimizing the lost profit. They constrained a truck can only drop off at a fixed number Nd and pick up from fixed number Np of stations during one time-slot, respectively. However, they failed to take account of the sequence of visited stations and the velocity of trucks. Therefore, the repositioning policy is completed instantaneously at the start of each time-slot, which is absolutely impossible in practice.
MIP with FCD: This approach combines the method proposed by [Barabonkov et al., 2020] with the FCD algorithm, which formulates the MIP framework for each community to find repositioning policy separately.
| Community | Station Number | Inter Net Flow | Inner Flow | Imbalance Ratio |
|---|---|---|---|---|
| c1 | 21 | -13 | 810 | -0.016 |
| c2 | 16 | -3 | 456 | -0.007 |
| c3 | 8 | 1 | 267 | 0.004 |
| c4 | 9 | -1 | 344 | -0.003 |
| c5 | 13 | 26 | 648 | 0.040 |
| c6 | 12 | 7 | 422 | 0.016 |
| c7 | 25 | -3 | 777 | -0.004 |
| c8 | 6 | 1 | 273 | 0.004 |
STMIP: This approach rebalances the global system based on the STMIP model, which is a centralized control system.
We use the following metrics to evaluate the performance of different approaches:
Additional Profit: The additional profit is the improved profit brought by system rebalancing for the all-day, compared to the profit without any system rebalancing.
Lost Demand: Lost demand is the number of unserviced orders. Less lost demand signifies higher service level and customer satisfaction.
5.2 FCDAlgorithmResults
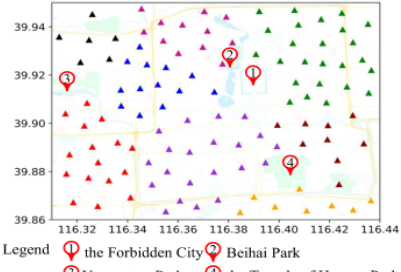
The result of the FCD algorithm is shown in Figure 1. Combining the cartographic information and station distribution, we can find that stations are mainly located on both sides of the city's main roads, and few stations are distributed in residential areas. Particularly, there is no station located in the scenic spots. The reason is that the scenic spot managers forbid customers to ride bikes into the scenic spot. Meanwhile, the FCD algorithm finally generates 8 station communities. To illustrate the property of inner-balanced, we count the inter net flow and inner flow of each community for every time-slot. The imbalance ratio is calculated by inter net f low / inner f low and reflects the better innerbalanced characteristic of the community when the value is closer to 0. In Table 2, we present the average results of the above three statistics for each community.
5.3 Rebalancing Results
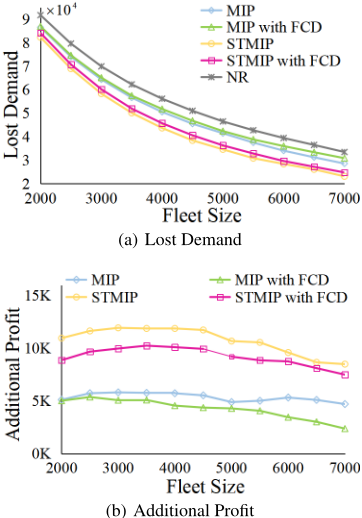
We compare our proposed approaches with baselines in three aspects of lost demand, additional profit, and algorithm complexity. For the experiment, the number of trucks allocated for the whole system is 24, and we respectively assign trucks of 5, 4, 1, 2, 3, 2, 6, and 1 to c1 to c8, which is approximately linear with the number of stations for each community. Then we consider two cases of R = 2 and R = 4. Meanwhile, we set Nd +Np = R for the MIP model to guarantee the same total number of visited stations during one time-slot.
Figure 2(a) shows that rebalancing the system can reduce the lost demand with varying fleet size from 2000 to 7000. Comparing to NR approach, our STMIP with FCD approach and STMIP approach reduce the lost demand by 19.11% and 22.48% on average, which achieve better performance than others. It can be seen from Figure 2(b) that our approaches bring nearly twice additional profit to the system than others. While in the worst case of 7000 fleet, the additional profit of STMIP with FCD approach is still nearly 3000 RMB more than the MIP approach. Meanwhile, with the fleet size increasing, the additional profit is the trend of rising first and then decreasing slowly. The reason could be that when the fleet size is lower, the distribution of lost demand is concentrated. In this case, moving one idle bike might reduce more than one lost demands, which brings higher profit improvement. However, for the larger fleet size, the lost demand is mainly distributed in the remote areas and scattered. Hence, moving one bike might reduce only one lost demand.
Figure 3 presents the results about lost demand and additional profit when the maximum of the visited station is
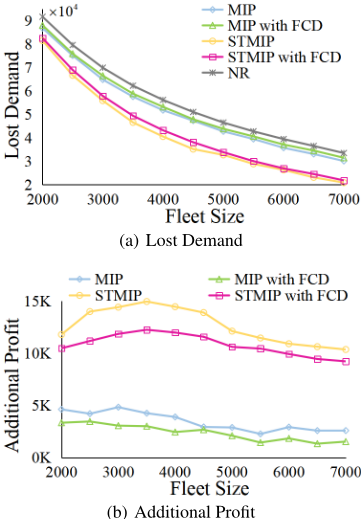
4. And the additional profit has the same phenomenon as R = 2. Significantly, comparing Figure 3(a) with Figure 2(a), the lost demand of our proposed approaches when R = 4 is lower than the lost demand when R = 2, and the lost demand is essentially unchanged for MIP with FCD approach and MIP approach. Figure 3(b) and Figure 2(b) show that changing R from 2 to 4, our proposed approaches provide a significant improvement in the additional profit. For the best case when the fleet size is 3500, the additional profit of the STMIP approach is 11870.5 RMB when R = 2 and is increased to 14939.0 RMB when R = 4. However, for MIP with FCD approach and MIP approach, the additional profit is slightly lower. Increasing the maximum of visited stations means that the truck can pick up bikes more than once, which increases the total number of moving bikes for one time-slot. Our STMIP model takes into account the sequence of visited stations and velocity of trucks. Thus, the results of our approaches reveal that greater mobility is often associated with the better performance of the dynamic rebalancing approach. Oppositely, the results of approaches applied MIP model fail to decrease the lost demand and bring about the invalid moving of bikes, which altogether contribute to reducing the additional profit. This can be attributed to the MIP model's ignorance of the spatial and temporal information.
Solving the mixed integer program is a NP-hard problem with exponential time complexity. The complexity can be denoted by O(np ), where p is the number of integer variables. We compare the number of integer variables about four approaches in Table 3. For the STMIP model, the number of variables is related to R, so the complexity of approaches applied STMIP model increases with the increase of R. Differently, the complexity of MIP and MIP with FCD approaches is independent of R, because R only changes the constraints and not affects the number of variables. However, the complexity of STMIP with FCD approach is always the lowest. In particular, when R = 2, the number of STMIP with FCD approach's integer variables is reduced by 93.26%, 89.02%, 58.25% compared to the STMIP approach, MIP approach, and MIP with FCD approach, respectively. Meanwhile, every time an integer variable is added, the computing time for solving the exact solution will be doubled in the worst case. In our experiment, the average running time of the STMIP with FCD approach is only 2 seconds, so our proposed approach can be effectively applied in practice.
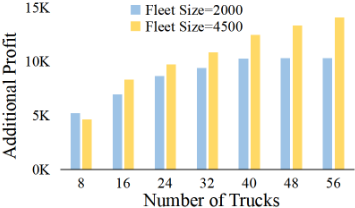
For the STMIP with FCD approach, we illustrate the effect of truck's number on additional profit under different fleet sizes in Figure 4. In general, additional profit improves with the increasing of truck's number. With 8 trucks, the performance of 4500 fleet is worse, where 8 trucks are too few for the larger fleet. When the truck is more than 40, the additional profit of 2000 fleet remains constant. That is because 40 trucks are enough to move all the idle bikes for 2000 fleet. Additionally, the results demonstrate that we can increase the number of trucks to bring more profits to large-scale systems.
| MIP | MIP with FCD | STMIP | STMIP with FCD | |
|---|---|---|---|---|
| R=2 | 9790 | 2575 | 15950 | 1075 |
| R=4 | 9790 | 2575 | 31790 | 2125 |
6 Conclusion
In this paper, we propose the STMIP with FCD approach to solve the dynamic rebalancing problem for Dockless BSS to maximize total profit. Firstly, we propose the FCD algorithm to define the abstract stations and discover the community structure of stations. The traditional centralized rebalancing system is decomposed into a distributed multi-communities system, which highly reduces the algorithm complexity. Secondly, the STMIP model is designed to generate the repositioning policy, which takes into account both temporal and spatial information of trucks. At last, we design a simulator to test the algorithm performance. The results of the experiment confirm that our proposed approach achieves a better performance than baseline approaches in three aspects, which are service level, profit, and complexity.
Acknowledgments
This paper is supported by National key R & D plan (2020YFB1806602).
@inproceedings{ijcai2021p569,
  title     = {Dynamic Rebalancing Dockless Bike-Sharing System based on Station Community Discovery},
  author    = {Li, Jingjing and Wang, Qiang and Zhang, Wenqi and Shi, Donghai and Qin, Zhiwei},
  booktitle = {Proceedings of the Thirtieth International Joint Conference on
               Artificial Intelligence, {IJCAI-21}},
  publisher = {International Joint Conferences on Artificial Intelligence Organization},
  editor    = {Zhi-Hua Zhou},
  pages     = {4136--4143},
  year      = {2021},
  month     = {8},
  note      = {Main Track},
  doi       = {10.24963/ijcai.2021/569},
  url       = {https://doi.org/10.24963/ijcai.2021/569},
}
TY - CPAPER TI - Dynamic Rebalancing Dockless Bike-Sharing System based on Station Community Discovery AU - Li, Jingjing AU - Wang, Qiang AU - Zhang, Wenqi AU - Shi, Donghai AU - Qin, Zhiwei T2 - Proceedings of the Thirtieth International Joint Conference on Artificial Intelligence, IJCAI-21 PB - International Joint Conferences on Artificial Intelligence Organization PY - 2021 SP - 4136 EP - 4143 DO - 10.24963/ijcai.2021/569 UR - https://doi.org/10.24963/ijcai.2021/569 ER -Copied
Machine-readable versions of this paper, for tools and AI agents:





