
SPADE: A Semi-supervised Probabilistic Approach for Detecting Errors in Tables
Proceedings of the Thirtieth International Joint Conference on Artificial Intelligence. Main Track. Pages 3543-3551.
https://doi.org/10.24963/ijcai.2021/488
© 2021 International Joint Conferences on Artificial Intelligence
Keywords
- Machine Learning Applications: Applications of Supervised Learning
- Data Mining: Anomaly/Outlier Detection
Abstract
Error detection is one of the most important steps in data cleaning and usually requires extensive human interaction to ensure quality. Existing supervised methods in error detection require a significant amount of training data while unsupervised methods rely on fixed inductive biases, which are usually hard to generalize, to solve the problem. In this paper, we present SPADE, a novel semi-supervised probabilistic approach for error detection. SPADE introduces a novel probabilistic active learning model, where the system suggests examples to be labeled based on the agreements between user labels and indicative signals, which are designed to capture potential errors. SPADE uses a two-phase data augmentation process to enrich a dataset before training a deep learning classifier to detect unlabeled errors. In our evaluation, SPADE achieves an average F1-score of 0.91 over five datasets and yields a 10% improvement compared with the state-of-the-art systems.
- [Abedjan et al., 2016] Ziawasch Abedjan, Xu Chu, Dong Deng, Raul Castro Fernandez, Ihab F Ilyas, Mourad Ouz- zani, Paolo Papotti, Michael Stonebraker, and Nan Tang. Detecting data errors: Where are we and what needs to be done? Proceedings of the VLDB Endowment, 9(12):993- 1004, 2016.
- [Bach et al., 2017] Stephen H Bach, Matthias Broecheler, Bert Huang, and Lise Getoor. Hinge-loss markov random fields and probabilistic soft logic. The Journal of Machine Learning Research, 18(1):3846-3912, 2017.
- [Bojanowski et al., 2017] Piotr Bojanowski, Edouard Grave, Armand Joulin, and Tomas Mikolov. Enriching word vec- tors with subword information. Transactions of the Asso- ciation for Computational Linguistics, 5:135-146, 2017.
- [Breiman, 2001] Leo Breiman. Random forests. Machine learning, 45(1):5-32, 2001.
- [Chen and Guestrin, 2016] Tianqi Chen and Carlos Guestrin. Xgboost: A scalable tree boosting system. In Proceedings of the 22nd ACM SIGKDD International Conference on Knowledge Discovery and Data Mining, KDD '16, page 785-794, 2016.
- [Chu et al., 2015] Xu Chu, John Morcos, Ihab F Ilyas, Mourad Ouzzani, Paolo Papotti, Nan Tang, and Yin Ye. Katara: A data cleaning system powered by knowledge bases and crowdsourcing. In Proceedings of the 2015 ACM SIGMOD International Conference on Management of Data, pages 1247-1261, 2015.
- [Dallachiesa et al., 2013] Michele Dallachiesa, Amr Ebaid, Ahmed Eldawy, Ahmed Elmagarmid, Ihab F Ilyas, Mourad Ouzzani, and Nan Tang. Nadeef: a commod- ity data cleaning system. In Proceedings of the 2013 ACM SIGMOD International Conference on Management of Data, pages 541-552, 2013.
- [Das et al., 2015] Sanjib Das, AnHai Doan, Paul Suganthan G. C., Chaitanya Gokhale, Pradap Konda, Yash Govind, and Derek Paulsen. The magellan data repository. https: //sites.google.com/site/anhaidgroup/projects/data, 2015. Link
- [Heidari et al., 2019] Alireza Heidari, Joshua McGrath, Ihab F Ilyas, and Theodoros Rekatsinas. Holodetect: Few- shot learning for error detection. In Proceedings of the 2019 International Conference on Management of Data, pages 829-846, 2019.
- [Hu et al., 2019] Kevin Hu, Snehalkumar'Neil'S Gaik- wad, Madelon Hulsebos, Michiel A Bakker, Emanuel Zgraggen, César Hidalgo, Tim Kraska, Guoliang Li, Arvind Satyanarayan, and C ¸agatay Demiralp. Viznet: Towards a large-scale visualization learning and bench- marking repository. In Proceedings of the 2019 CHI Conference on Human Factors in Computing Systems, pages 1-12, 2019.
- [Huang and He, 2018] Zhipeng Huang and Yeye He. Auto- detect: Data-driven error detection in tables. In Proceed- ings of the 2018 International Conference on Management of Data, pages 1377-1392, 2018.
- [Huang et al., 2014] Sheng-Jun Huang, Rong Jin, and Zhi- Hua Zhou. Active learning by querying informative and representative examples. IEEE Transactions on Pattern Analysis and Machine Intelligence, 36(10):1936-1949, 2014.
- [Krishnan et al., 2016] Sanjay Krishnan, Jiannan Wang, Eu- gene Wu, Michael J Franklin, and Ken Goldberg. Ac- tiveclean: Interactive data cleaning for statistical model- ing. Proceedings of the VLDB Endowment, 9(12):948- 959, 2016.
- [Li et al., 2012] Xian Li, Xin Luna Dong, Kenneth Lyons, Weiyi Meng, and Divesh Srivastava. Truth finding on the deep web: Is the problem solved? Proceedings of the VLDB Endowment, 6(2), 2012.
- [Mahdavi et al., 2019] Mohammad Mahdavi, Ziawasch Abedjan, Raul Castro Fernandez, Samuel Madden, Mourad Ouzzani, Michael Stonebraker, and Nan Tang. Raha: A configuration-free error detection system. In Proceedings of the 2019 International Conference on Management of Data, pages 865-882, 2019.
- [Mariet et al., 2016] Zelda Mariet, Rachael Harding, Sam Madden, et al. Outlier detection in heterogeneous datasets using automatic tuple expansion. 2016.
- [Neutatz et al., 2019] Felix Neutatz, Mohammad Mahdavi, and Ziawasch Abedjan. Ed2: A case for active learning in error detection. In Proceedings of the 28th ACM Inter- national Conference on Information and Knowledge Man- agement, pages 2249-2252, 2019.
- [Ouzzani et al., 2016] Mourad Ouzzani, Hossam Hammady, Zbys Fedorowicz, and Ahmed Elmagarmid. Rayyan-a web and mobile app for systematic reviews. Systematic reviews, 5(1):210, 2016.
- [Pedregosa et al., 2011] F. Pedregosa, G. Varoquaux, A. Gramfort, V. Michel, B. Thirion, O. Grisel, M. Blon- del, P. Prettenhofer, R. Weiss, V. Dubourg, J. Vanderplas, A. Passos, D. Cournapeau, M. Brucher, M. Perrot, and E. Duchesnay. Scikit-learn: Machine learning in Python. Journal of Machine Learning Research, 12:2825-2830, 2011.
- [Pham et al., 2019] Minh Pham, Craig A Knoblock, and Jay Pujara. Learning data transformations with minimal user effort. In 2019 IEEE International Conference on Big Data (Big Data), pages 657-664. IEEE, 2019.
- [Rekatsinas et al., 2017] Theodoros Rekatsinas, Xu Chu, Ihab F Ilyas, and Christopher Ré. Holoclean: Holistic data repairs with probabilistic inference. Proceedings of the VLDB Endowment, 10(11), 2017.
- [Singh, 2016] Rishabh Singh. Blinkfill: Semi-supervised programming by example for syntactic string transforma- tions. Proceedings of the VLDB Endowment, 9(10):816- 827, 2016.
- [Wang and He, 2019] Pei Wang and Yeye He. Uni-detect: A unified approach to automated error detection in tables. In Proceedings of the 2019 International Conference on Management of Data, pages 811-828, 2019.
References were extracted automatically from the PDF and may contain errors.
Full text extracted automatically from the PDF; figures, tables and equations may differ. The PDF is the version of record.
1 Introduction
Error detection is a major challenge in data cleaning and plays an essential role in ensuring data quality for downstream tasks. Traditionally, data curators are in charge of manually performing error-detection tasks. Such manual error detection is generally done based on human knowledge and experience. A data error can be defined as "a deviation from its given ground truth" [Abedjan et al., 2016]. The deviations can come from different criteria such as rarity in values, misspellings, or uncommon formats and may be detected using indicative signals. In practice, error detection is an iterative process where errors detected by curators need to be reviewed by other experts [Mahdavi et al., 2019; Rekatsinas et al., 2017].
In recent years, much research effort on learning-based error-detection methods [Heidari et al., 2019; Neutatz et al., 2019; Mahdavi et al., 2019; Krishnan et al., 2016] has focused on reducing a data curator's workload by automating or semi-automating the detection task. Such methods leverage machine-learning techniques to characterize the properties of labeled errors and apply learned models to detect unseen errors. However, learning-based error-detection systems require a significant amount of training data to achieve satisfactory performance, especially deep-learning-based ones [Heidari et al., 2019]. Labeling errors in a large and noisy dataset is time-consuming and can be a burden for users to train their models. On the other hand, unsupervised approaches [Wang and He, 2019; Huang and He, 2018; Dallachiesa et al., 2013; Mariet et al., 2016], which do not need labeled data, rely heavily on a fixed inductive bias for detection. However, values that are erroneous in one database may be normal in another database. Therefore, existing methods that work intrinsically in one domain often fall short of adapting extrinsically to other domains [Mahdavi et al., 2019].
To cope with the lack of training data and support more generalizable error detection, we present a novel semisupervised error detection system called SPADE ♠. As machine learning techniques have been proven to have high performance in error detection [Heidari et al., 2019; Neutatz et al., 2019], we integrate a machine learning classifier with an active learning process to reduce the amount of labeled data and an accompanying data augmentation algorithm to synthesize additional training data automatically.
SPADE introduces an active learning process where it initially improvises a set of signal functions to detect potential errors. We categorize our signal functions into two categories: internal and external. Internal signal functions analyze values within data attributes to determine the outliers. External signal functions leverage external knowledge, such as pre-trained language models and Web table data, to identify other errors. In the active learning process, the reliability scores of signal functions are equally initialized and continuously updated based on their agreement with user labels using Probabilistic Soft Logic (PSL) [Bach et al., 2017]. By accepting user feedback and progressively optimizing our active learning model, we can reduce the number of labeled examples required and improve our system's generalization.
To generate more training data, SPADE includes a twophase data-augmentation module where it propagates the labels of user-labeled examples based on the similarity of signals and PSL inference scores and generates synthetic examples with string transformation learned from user-corrected values. The combination of user-labeled and syntheticallyaugmented data ensures that our deep learning classifier has enough training data to achieve high performance, as shown in our evaluation.
| GDP per capita | Voluntary expenditure | Household income | Passenger transport |
|---|---|---|---|
| 41 450 | 2.3 | -0.5 | 138 643 |
| 43 746 | 2.3 | | 1.1 | 132 125 |
| 44 720 | 2.3 | 0.4 | 134 954 e |
Contribution. The main contribution of this paper is our semi-supervised solution for error detection that can accurately detect errors with limited user labels. Our solution provides two key technologies: (i) A novel active-learning process that uses probabilistic models to model the agreements between user labels and error signals to adaptively identify the actual errors; (ii) A two-phase data augmentation algorithm, which propagates user labels based on signal functions and generates synthetic errors using string transformations, to obtain enough training data for deep classification training.
2 Motivating Example
We provide a motivating example to explain how SPADE simulates human error detection approaches under three different scenarios. In this example, we use a snippet of a real-world dataset about Belgium statistical profiles from the Organisation for Economic Co-operation and Development (OECD) library, 1 as shown in Table 1.
Scenario 1. Suppose that we want to detect errors in the GDP per capita column. It is easy to see that all GDP per capita column values have the same format, and their values seem to be comparable. Therefore, using only internal information, users may conclude that there is no error in the column. However, with external information, curators may notice that the pattern like "XXX XXX" (where X represents a digit) for numbers is uncommon since numbers are either stored in "XXX.XXX" or "XXX,XXX" formats. In practice, these "XXX XXX" numbers should be flagged as errors for curation before being used in downstream tasks. In this case, we can learn from our Web table corpora that the pattern "XXX XXX" rarely appears and can conclude that values with "XXX XXX" pattern are more likely to be errors.
Scenario 2. We can look at column Voluntary expenditure where cell values that end with "|" are rare cases in the column and more likely to be errors. In this scenario, we can use an internal signal function that computes the format pattern frequency to detect the "2.3 |" since it is a rare pattern.
Scenario 3. There are situations when the initial potential errors are incorrect. For example, in the column Household disposable income, value "-0.5" is a potential error based on internal signals since it is the only negative value. However, based on user verification, "-0.5" is indeed a normal value. To allow our active learning model to handle these cases, we develop a probabilistic graphical model to model the agreement between our signals and user feedback.
1 https://www.oecd-ilibrary.org/economic
3 Learning to Detect Errors
In this section, we define the error detection problem and discuss our approach in SPADE to solve the problem.
3.1 ProblemDefinition
In this paper, we focus on solving the error detection problem where errors can be found by examining each attribute independently since the majority of errors found in data sources are single-attribute errors. Errors that require examining the dependency between columns to detect are also important but are not considered in this paper. We can define the problem of single-attribute error detection as:
Definition 1 (Single-attribute Error Detection). Given a data attribute A with n cells {A[1],A[2], ...,A[n]}, find a label vector L of size n so that L[i] = 0 if A[i] is an error and L[i] = 1 if A[i] is a normal cell value.
Using the above definition, we can also formulate error detection as a binary classification where normal values are positive examples and errors are negative.
For the rest of the paper, when we refer to error detection in a data source with n attributes {a1, a2, ..., an}, we consider it as a set of n multiple error detection sub-problems where each sub-problem targets a single attribute ai. Also, since attributes usually correspond to columns in tables, we will use the two terms interchangeably throughout the paper.
3.2 Overall Approach
The main purpose of our active learning process is to identify representative examples quickly for user labeling. In SPADE, it can be achieved by using signal functions and the PSL model. Signal functions cover a set of indicative signals that can detect potential errors such as rarity in values, misspellings, or uncommon formats. The PSL model assigns a reliability score for each signal function and updates it throughout the active learning process based on user feedback. By focusing only on reliable signal functions, SPADE can select representative errors for user labeling in a large and noisy dataset.
As shown in Section 3.1, the error detection problem can be formulated into a binary classification problem. Since the number of labeled cells in active learning is limited, SPADE includes a two-phase data augmentation algorithm that enriches both positive and negative examples to ensure that our binary classifier has enough training data.
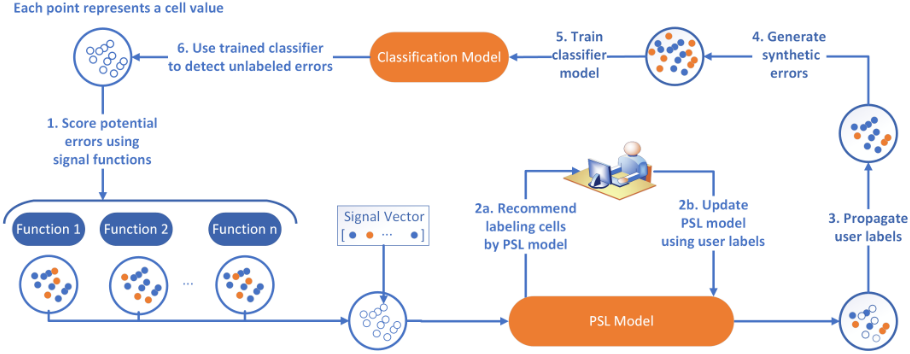
Figure 1 shows the overall workflow in SPADE. In the figure, blank circles represent unlabeled cells, while color-coded circles represent normal (blue) and erroneous (orange) cells. The system starts by initializing the set of unlabeled cells. For each active iteration, SPADE first computes the signal values for each cell (Step 1). Next, these signal values are fed into our PSL model, and the model infers the error probabilities for all cell values. SPADE selects the cell with the highest error probability A[i∗ ] for user labeling (Step 2a). The label is then used to update our PSL model (Step 2b). The loop repeats until SPADE reaches the number of active iterations. The set of labeled cells are fed to our two-phase data augmentation algorithm (Step 3 and 4). The augmented data are then used to train a binary classifier (Step 5) to detect unlabeled errors (Step 6).
3.3 Signal Functions
SPADE contains two different sets of signal functions that capture internal and external signals for potential errors. We define a signal function as follows:
Definition 2 (Signal function). A signal function is a function that maps a cell value ci to range [0, 1] to indicate the error probability of ci.
This section explains the general ideas and reasons why we include specific signal functions.
Internal Signal Functions. Internal signal functions are signal functions that can be computed using values within the column, and errors related to internal signals concern the rarity of the attribute data. Therefore, our internal signal functions focus on analyzing the frequencies of cell values within the column and then report the rarity. We apply the hierarchical syntactic patterns widely used in transformation learning systems [Pham et al., 2019; Singh, 2016] and compute data frequency under four levels of abstractions: characters, symbols, grouped symbols, and punctuation marks. In symbol sequence, all characters are converted into their symbols using regex as follows: [A - Z] ⇒ A, [a - z] ⇒ a and [0 - 9] ⇒ 0. In a grouped symbol sequence, we allow quantified regex so that one symbol can replace a sequence of adjacent same-class characters. For example, with the string "1900, San Francisco CA", its symbol sequence is "0000, Aaa Aaaaaaaaa AA" and its grouped symbol sequence is "0 Aa, Aa A". Our internal signal functions consist of:
- Value frequency: compute the frequency of cell values
- Symbolic frequency: compute the symbol frequency of cell values in a column.
- Grouped symbolic frequency: compute the grouped symbol frequency of cell values in a column.
- Punctuation frequency: compute the frequency of punctuation set for each cell value in a column.
External Signal Functions. External signal functions aim to locate errors by leveraging information outside the tables, such as general human knowledge. We leverage the FastText embedding model [Bojanowski et al., 2017] to characterize the information in human general knowledge. As FastText is trained using billions of tokens, their vocabulary can represent human vocabulary, and tokens missing in FastText have a high chance of errors. Moreover, we preprocess VizNet [Hu et al., 2019], a large Web table corpora, and compute statistics such as n-gram frequencies and word frequencies. As Web tables usually contain numerical or mixed data, analyzing VizNet can help identify potential errors, such as uncommon numerical formats or rare mixed values. SPADE currently supports the following external functions:
- VizNet N-gram frequency: compute the minimum 2grams frequency of cell values in VizNet Web table corpora. In particular, a list of 2-gram character-based sequences is generated from a cell value. SPADE then computes the frequency of each n-gram and reports the minimum frequency.
- FastText out-of-vocabulary: check if any word in the cell values is out of FastText's vocabulary.
- f(A[i]) = |{outOfFastText(t) : t ∈ tokenize(A[i])}| > 0
- English out-of-vocabulary: check if any word in the cell values is unknown in English vocabulary 2 .
2 https://github.com/barrust/pyspellchecker
- Missing Value: check if a cell is a missing value
3.4 Probabilistic Soft Logic
We use PSL to model the relationships between signal functions and user annotated labels. PSL is a probabilistic graphical modeling framework built upon hinge-loss Markov Random Fields (HL-MRF) [Bach et al., 2017]. PSL eases HLMRF modeling by allowing model definition using first-order logic syntax. A PSL model consists of a set of predicates and first-order logic weighted rules constructed from the predicates. An example of the PSL rule is shown below:
where w is the weight of the rule, LABEL, HASSIGNAL and BADSIGNAL are three predicates, c and s are variables, and 1 is a constant. In cases where w is undefined, the PSL rules become hard-constraints and need to be followed in the inference. During inference, the predicates are grounded by constants, and probabilities of the grounded predicates are inferred using convex optimization with relaxation.
PSL Model
In SPADE, we have four different predicates: ERROR(c) indicates if a cell c is error or not, BADSIGNAL(s) denotes if a signal s is reliable or not, LABEL(c, l) shows the user label of cell c (normal value l = 1 , error l = 0 or unlabeled l = -1), and HASSIGNAL(c, s) corresponds to the value of signal function s on cell value c. Based on these four predicates, we have a set of PSL rules in SPADE as follows:
Rule 1 is the prior rule that states that cell values are generally normal. We set the prior rule to have a low weight since we want them to be dominated by other PSL rules. Rules 2 and 3 are to enforce that user labeling is always correct, and Rule 4 ensures that the sum of three probabilities, if a cell is either normal, error or unlabeled, is 1. These rules are unweighted since they are hard-constraints in PSL. Rules 5 and 6 model the relationships between signal functions and user labels. Functions that agree with users are more reliable than functions that disagree with user labeling. Rules 7 and 8 require that cells scored highly by good signal functions are more likely to be errors and vice versa. We use the same weight for all these rules.
PSL Inference
As shown in Figure 1, SPADE conducts collective inference using the above PSL model and output probabilities of two predicates: ERROR and BADSIGNAL. Values of BADSIGNAL
predicate denote the quality of each signal function and represent the importance of each signal function in active example selection. ERROR predicates indicate the error probability of cell values, and the cell with the highest error probability is reported to users for labeling. Two of the most common criteria to select active examples are informative and representative [Huang et al., 2014]. In SPADE, the cell with the highest error probability is selected since it is the most informative example for updating the PSL model. Our active learning relies on PSL inference to select a set of reliable signal functions to detect potential errors. By labeling the cell Ci with the highest error probability, users can help verify the correctness of a subset of signal functions that predict Ci as an error. Therefore, our PSL model can quickly select the set of most reliable signal functions. Example 1 illustrate how SPADE's PSL inference works.
Example 1. Using the dataset in Table 1, in column Household disposable income, value "-0.5" is a potential error if we use a format frequency signal function since it is the only value with the minus sign "-". However, after user labeling, "-0.5" is indeed a normal value. Using Rules 5 and 6, signal functions that conflict with user labels are more likely to become BADSIGNAL. Then using Rule 7 and 8, if a signal function is BADSIGNAL, it will have a weight penalty in error inference and vice versa. For the column Household disposable income, signal functions that rely on format frequency will receive the penalty.
After each active learning iteration, we update values of LABEL predicates to reflect the labels of newly labeled cells before the inference.
3.5 Data Augmentation
Using the labeled data from users, SPADE performs a twophase data augmentation process: synthetic labeling and error generation. The main goal of data augmentation is to increase the quantity and coverage of training data in SPADE. Existing supervised error detection approaches usually suffer from the lack of labeled data, and obtaining user labels is very time-consuming. We use label propagation to extend the labeled data to similar values within close distances. Moreover, since the errors are usually rare cases in data, we generate additional synthetic errors to balance the data before binary classifier training.
Label Propagation
In SPADE, we propagate user labels of labeled cells to other cell values with similar signal vectors. We called two signal vectors similar if:
where F is the set of signal functions in SPADE and ϵ is a predefined threshold. Smaller ϵ means that propagation has reached fewer examples and may require more active learning iterations to reach the maximum performance. In comparison, larger ϵ can result in labels spreading to other values with different properties, resulting in wrong synthetic labels. We investigate the effect of different ϵ values in Section 4.4. In this paper, SPADE uses ϵ with value 0.01.
Error Generation
Inspired by the idea of data augmentation in HOLODETECT [Heidari et al., 2019], we apply their error generation algorithm to enrich our training data. However, to increase the transformation accuracy, we extend the set of transformation operations to include:
- InsertAt(s, i): Insert s at position i.
- InsertAfter(s, c): Insert s after character c .
- InsertBefore(s, c): Insert s before character c.
- Replace(s, c): Replace an occurrence of string c with string s.
- ReplaceAll(s, c): Replace all occurrences of string c with string s.
- Delete(s): Delete an occurrence of substring s.
- DeleteAll(s): Delete all occurrences of substring s.
Example 2 shows how our system can generate better examples compared to HOLODETECT.
Example 2. To transform "Los Angeles" into "Los Angeles CA", HOLODETECT can learn the transformation: Insert(" CA"). However, when applying the transformation function to a new string "San Jose", HOLODETECT randomizes the inserting position and can create multiple different results such as "San JoCAse" or "SCAan Francisco". In SPADE, by using the operation InsertBefore("$") where "$" is the end-of-string character, we can ensure that the generated errors are more accurate.
3.6 Feature Extraction.
To create a representation for cell values and provide information to our classification model, we extract semantic and syntactic features to ensure that we can create the most informative cell value representation. We included both semantic and syntactic features since errors are usually related to one of these two aspects. For example, format inconsistencies are related to syntactic features while typos are usually related to semantic features.
Syntactic Features. To capture the syntactic patterns, we follow the same hierarchical syntactic patterns used for internal signal functions. SPADE calculates the Bag-of-character vectors for each cell value in three different syntactic abstraction levels: characters, symbols, and grouped symbols.
Semantic Features. To capture the meanings of string values, pre-trained word embeddings are a common technique that is widely used. In this work, we use FastText [Bojanowski et al., 2017] embedding to capture our cell semantic meanings. For each cell value, the average character embeddings and word embeddings are used as our semantic features.
3.7 Classifier Training
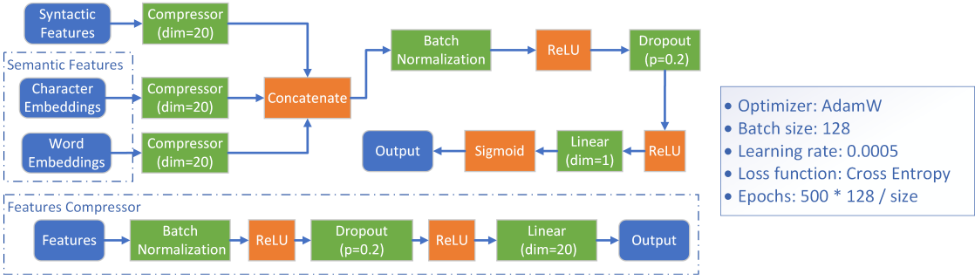
The overall architecture of our classification model is shown in Figure 2. While the number of dimensions in syntactic features, which includes Bag-of-character vectors, can vary between different datasets, the size of semantic features is equal to the dimensionality of FastText (300) embedding. To ensure that the model is not biased toward the features with more dimensions, we provide a feature compression module where we reduce the dimensions of each feature group to a fixed size of 20. Our compressor module contains a linear fully connected layer that reduces the number of dimensions and two intermediate ReLU activation functions, which encourages sparse representation in the data and prevents overfitting. The main network concatenates all compressor outputs and processes the concatenated vectors in another compressor module with one-dimension output. In the end, SPADE applies sigmoid activation so that the output is in the range of [0, 1]. All values with error probabilities higher than 0.5 are identified as errors.
4 Evaluation
We conduct multiple experiments to compare SPADE against the state-of-the-art error detection systems using different datasets and different quantities of labeled cells. We also investigate SPADE's running time, the importance of various features, and classification models in SPADE. Our system and datasets are available online 3 .
4.1 Experimental Setup
We evaluate our system on 5 different datasets as shown in Table 2. The Hospital dataset is a benchmark dataset used in several data cleaning papers [Heidari et al., 2019; Neutatz et al., 2019; Mahdavi et al., 2019]. Beers 4 , Rayyan [Ouzzani et al., 2016], Flights [Li et al., 2012] and Movies [Das et al., 2015] are real-world datasets manually collected and cleaned by users. Rayyan, Flight, and Movies datasets contain multicolumn errors, which are not covered in this paper. However, we want to include them in our evaluation since they are used in previous research [Mahdavi et al., 2019; Neutatz et al., 2019] and more evaluation datasets can show that SPADE is not fine-tuned to work in a specific domain.
We compare SPADE with RAHA [Mahdavi et al., 2019] and ED2 [Neutatz et al., 2019], the two state-of-the-art systems in active-learning error detection. We also include four other error detection tools that are widely used as baselines in error detection research: DBOOST [Mariet et al., 2016], NADEEF [Dallachiesa et al., 2013], KATARA [Chu et al., 2015] and ACTIVECLEAN [Krishnan et al., 2016]. We report precision, recall, and F1-score to evaluate the performance in the error detection task. Since our PSL model is a probabilistic model, we report the performance as the average of 10
3 https://github.com/minhptx/spade
4 https://www.kaggle.com/nickhould/craft-cans
| Dataset | Size | Error rate | Multi-column errors |
|---|---|---|---|
| Hospital | 1000 x 20 | 0.048 | No |
| Beers | 2410 x 11 | 0.159 | No |
| Rayyan | 1000 x 11 | 0.086 | Yes |
| Flights | 2376 x 7 | 0.298 | Yes |
| Movies | 7390 x 17 | 0.062 | Yes |
independent runs. For readability, we omit the ±0.01 in our tables when the standard deviations (SD) are less than 0.01 unless otherwise specified.
In the evaluation, we set the maximum number of labeled cells for each column in SPADE to be 20. We collect 20 labeled cells by running four active learning iterations with five active learning examples per iteration. To ensure fairness, for systems that detect errors at the dataset level such as RAHA and ED2, we set the maximum number of labeled cells in a dataset of n columns to be 20n. We run all the experiments on a CentOS 7.8 machine with 72 cores, 754GB memory, and an NVIDIA RTX 2080 GPU.
4.2 Performance Evaluation
Table 3 shows that SPADE outperforms all baseline methods on five datasets in terms of F1, except for Flights, where we have a comparable result with RAHA. Specifically, SPADE excels over the best baseline system in each setting by 0.05 to 0.24 in terms of F1 scores. It is worth noting that both RAHA and ED2 can detect multi-column errors, and thus they have a clear advantage compared to SPADE on datasets with multicolumn errors such as Flight, Rayyan, and Movies. SPADE's superior performance is strongly supported by our high recall. Due to the proposed data augmentation algorithm in SPADE, which can generate significantly more unseen errors for our system, SPADE is more generalizable than its competitors and is better at detecting unseen errors.
As observed in Table 3, in datasets with only single-column errors such as Hospital and Beers, SPADE achieves a very high F1-score and a perfect recall. SPADE's performance drops in the other datasets with multi-column errors, which is understandable since there is always a set of multi-column errors that SPADE cannot detect in each dataset. The multicolumn errors also contribute to SPADE's higher standard deviations in these datasets. There are multiple cases where a value can be both error and normal value within the same column depending on its functional dependency from other columns. This results in false positive and false negatives predictions in these datasets. Therefore, SPADE's performance in datasets with multi-column errors usually fluctuates.
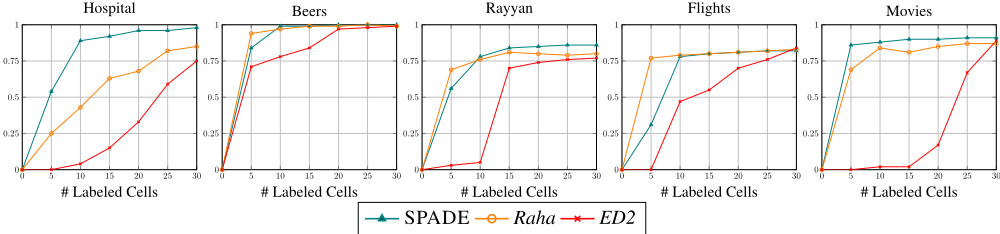
Figure 3 shows that SPADE requires fewer labeled examples than the other two systems to reach its maximum F1score. In Rayyan and Flights datasets, SPADE has a lower F1-score compared to RAHA with five labeled cells. This is because SPADE's first batch of active learning examples is suggested purely on average signal function scores without any user feedback. Starting from the second iteration (10 labeled cells), by leveraging user feedback and filtering reliable signals, SPADE reaches a near-peak performance and outperforms the baselines in all five datasets. Given more labeled examples, RAHA and ED2 can eventually catch up with SPADE in datasets with multi-column errors since SPADE is capped by our coverage of only single-column errors.
4.3 Running Time Evaluation
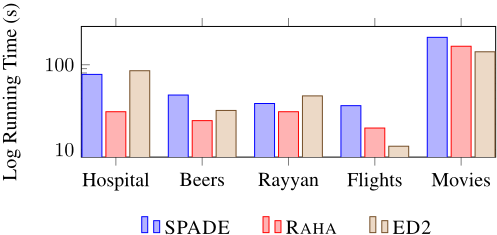
In this experiment, we evaluate SPADE's running time against two other active learning baselines: RAHA and ED2. To ensure fairness between different systems, we calculate the running time needed for each system to finish an iteration of active learning. As shown in Figure 4, RAHA has the fastest active learning time and SPADE is the slowest system among the three. However, as we can see, the differences between SPADE and other baselines are marginal across most of the datasets. In the Hospital dataset, SPADE has a much higher active learning time compared to RAHA because SPADE handles error detection on each column separately and thus the active learning time increases linearly with the number of columns. Since the Hospital dataset has the most columns in the five evaluation datasets, the differences in active learning time are the most noticeable.
4.4 Model Analysis
In this evaluation, we evaluate the importance of different components in SPADE and how removing or modifying these components will affect the system's performance.
Classifier Analysis. Table 4 shows SPADE's error detection performance using various classification models:
| Approach | Hospital | Beers | Rayyan | Flights | Movies | ||||||||||
|---|---|---|---|---|---|---|---|---|---|---|---|---|---|---|---|
| P | R | F | P | R | F | P | R | F | P | R | F | P | R | F | |
| dBoost | 0.07 | 0.37 | 0.11 | 0.34 | 1.00 | 0.50 | 0.05 | 0.18 | 0.08 | 0.25 | 0.34 | 0.29 | 0.25 | 0.79 | 0.38 |
| NADEEF | 0.05 | 0.37 | 0.09 | 0.13 | 0.06 | 0.08 | 0.30 | 0.85 | 0.44 | 0.42 | 0.93 | 0.58 | 1.00 | 0.08 | 0.16 |
| KATARA | 0.44 | 0.11 | 0.18 | 0.00 | 0.00 | 0.00 | 0.00 | 0.00 | 0.00 | 0.00 | 0.00 | 0.00 | 0.00 | 0.00 | 0.00 |
| ActiveClean | 0.02 | 0.15 | 0.04 | 0.16 | 1.00 | 0.28 | 0.09 | 1.00 | 0.16 | 0.30 | 0.99 | 0.46 | 0.06 | 1.00 | 0.12 |
| ED2 | 0.45 | 0.29 | 0.33 | 1.00 | 0.96 | 0.98 | 0.80 | 0.69 | 0.74 | 0.79 | 0.63 | 0.68 | 0.93 | 0.05 | 0.13 |
| Raha | 0.94 | 0.59 | 0.72 | 0.99 | 0.99 | 0.99 | 0.81 | 0.78 | 0.79 | 0.82 | 0.81 | 0.81 | 0.85 | 0.88 | 0.86 |
| SPADE | 0.93 | 1.00 | 0.96 | 1.00 | 1.00 | 1.00 | 0.80∗ | 0.92∗ | 0.85 | 0.81∗∗ | 0.81∗∗ | 0.81* | 0.99 | 0.83 | 0.90 |
Random Forest [Breiman, 2001] and XGBoost [Chen and Guestrin, 2016]. Both classifiers are implemented using the scikit-learn library [Pedregosa et al., 2011] used with the default parameters. As shown in Table 4, SPADE's deeplearning classifier outperforms all other classifiers in the five experimental datasets by 0.01 to 0.18 in terms of F1-score. As SPADE's deep classifier contains more parameters, it can exploit features and capture errors' properties better. Therefore, it is better at detecting unseen errors. When comparing RandomForest and XGBoost, the XGBoost classifier yields a more robust result across five experimental datasets. Random Forest's performance, while excels in Rayyan and Movies datasets, decrease severely in Hospital.
Feature Analysis. In this experiment, we analyze the importance of features in SPADE's classifier. We run SPADE with all feature groups and then exclude each feature group, one at a time, to analyze its impact. As shown in Table 5, the system that uses only semantic features outperforms the one with syntactic features. Since we use character embeddings in our semantic feature group, our semantic features also include syntactic information such as occurrences of characters and their frequencies. Therefore, using only semantic features gives superior performance compared to using only syntactic features and is also comparable with SPADE.
Propagation Analysis. In this experiment, we investigate the effect of different values of ϵ in SPADE. Table 6 shows that changing values of epsilon has a minimal effect on the performance of SPADE. It is also worth noting that despite the decrease in performance, using any ϵ reported in Table 6, SPADE still outperforms other baselines (Table 3).
5 RelatedWork
Previous work on error detection includes supervised [Heidari et al., 2019] and unsupervised [Huang and He, 2018; Wang and He, 2019] approaches. The current trend in supervised error detection reduces the number of labeled examples required to detect errors while still maintaining good performance. Heidari et al. [2019] apply data augmentation to solve error detection as a few-shot learning problem. On the other hand, existing unsupervised methods exploit massive Web table corpora to understand the data distributions and statistically detect the values that are not aligned with the learned distributions. AUTO-DETECT [Huang and He, 2018] uses co-occurrence between values in Web table corpora to train an unsupervised model for detecting syntactic outliers. In contrast, UNI-DETECT [Wang and He, 2019] leverages different statistical hypothesis tests for different types of errors on web table corpora to identify errors in pre-defined types. The major drawback of these unsupervised systems is their prior user settings, such as co-occurrence dependency in AUTO-DETECT or the set of pre-defined error types in UNIDETECT, which prevent them from generalizing. SPADE aims to solve the issues of both supervised and unsupervised approaches by accepting a minimal number of labeled examples to remove the prior user settings while still ensuring that the system can perform without a lot of training data.
| Approach | Hospital | Beers | Rayyan | Flights | Movies | ||||||||||
|---|---|---|---|---|---|---|---|---|---|---|---|---|---|---|---|
| P | R | F | P | R | F | P | R | F | P | R | F | P | R | F | |
| SPADE | 0.93 | 1.00 | 0.96 | 1.00 | 1.00 | 1.00 | 0.80 | 0.92 | 0.85 | 0.81 | 0.81 | 0.81 | 0.99 | 0.83 | 0.90 |
| Random Forest | 0.57 | 0.99 | 0.73 | 0.94 | 1.00 | 0.97 | 0.79 | 0.85 | 0.82 | 0.86 | 0.76 | 0.81 | 0.99 | 0.83 | 0.90 |
| XGBoost | 0.86 | 0.99 | 0.92 | 0.99 | 0.99 | 0.99 | 0.80 | 0.85 | 0.83 | 0.90 | 0.70 | 0.79 | 0.85 | 0.85 | 0.85 |
| Features | Hospital | Beers | Rayyan | Flights | Movies |
|---|---|---|---|---|---|
| All features | 0.96 | 1.00 | 0.85 | 0.81 | 0.90 |
| Syntactic only | 0.58 | 0.98 | 0.76 | 0.75 | 0.91 |
| Semantic only | 0.96 | 0.98 | 0.85 | 0.81 | 0.91 |
| ϵ | Hospital | Beers | Rayyan | Flights | Movies |
|---|---|---|---|---|---|
| ϵ = 0.01 | 0.96 | 1.00 | 0.85 | 0.81 | 0.90 |
| ϵ = 0.001 | 0.96 | 0.99 | 0.86 | 0.81 | 0.86 |
| ϵ = 0.005 | 0.86 | 0.98 | 0.86 | 0.81 | 0.91 |
| ϵ = 0.02 | 0.97 | 1.00 | 0.86 | 0.81 | 0.89 |
The idea of SPADE also applies to other interactive error detection systems. NADEEF [Dallachiesa et al., 2013] takes assertion rules as inputs and outputs the violated cell values. KATARA [Chu et al., 2015] marks errors that do not follow the entity relationships in given knowledge bases, and DBOOST [Mariet et al., 2016] uses histogram and Gaussian modeling to detect outliers. However, these systems, which require user inputs initially, usually suffer from low recall detection. Users need to understand the data errors before specifying the configurations, requiring going through the entire dataset. SPADE's active learning process is initialized by the system's signal functions, helping SPADE detect potential errors and overcome the low recall problem.
Another direction in interactive error detection is active learning. In recent years, this research direction has drawn a lot of attention from researchers. ED2 [Neutatz et al., 2019] uses a double-dimensional active learning approach that recommends both suspicious columns and rows for user labeling. On the other hand, RAHA [Mahdavi et al., 2019] incorporates an ensemble method to apply detection strategies from existing systems to cluster data and produce representative examples for user labeling. Our study of SPADE also follows the methodology in this line of research. However, by incorporating PSL, we present a more reliable way of integrating information from users. As a result, SPADE can create a flexible active learning strategy compared to existing methods. In addition to that, SPADE proactively leverages data augmentation to generate more training data to overcome the small amount of labeled data in active learning systems.
6 Conclusion
We presented SPADE, a novel learning-based system for error detection that can effectively reduce the number of labels required for training while maintain excellent performance in error detection. SPADE incorporates a probabilistic active learning model that allows signals captured for both internal and external information. During the active learning process, SPADE flexibly updates the active learning model using user labels. Therefore, SPADE achieves better performance in all five experimental datasets when compared to previous stateof-the-art systems. Furthermore, SPADE utilizes a data augmentation process where we enrich our training datasets with synthetic data. The process generates additional errors and helps SPADE generalize better to unseen errors. As a result, SPADE has a better recall in the evaluation.
In the future, we plan to extend SPADE to detect multicolumn errors by leveraging relationships from knowledge bases. We also plan to apply incremental learning for our classifiers to reduce the system's running time since the classifiers currently needs to be trained for each data attribute.
Acknowledgements
This research was sponsored by the Army Research Office and the Defense Advance Research Projects Agency and was accomplished under Grant Number W911NF-18-1-0027. The views and conclusions contained in this document are those of the authors and should not be interpreted as representing the official policies, either expressed or implied, of the Army Research Office and Defense Advance Research Projects Agency or the U.S. Government. The U.S. Government is authorized to reproduce and distribute reprints for Government purposes notwithstanding any copyright notation herein.
@inproceedings{ijcai2021p488,
  title     = {SPADE: A Semi-supervised Probabilistic Approach for Detecting Errors in Tables},
  author    = {Pham, Minh and Knoblock, Craig A. and Chen, Muhao and Vu, Binh and Pujara, Jay},
  booktitle = {Proceedings of the Thirtieth International Joint Conference on
               Artificial Intelligence, {IJCAI-21}},
  publisher = {International Joint Conferences on Artificial Intelligence Organization},
  editor    = {Zhi-Hua Zhou},
  pages     = {3543--3551},
  year      = {2021},
  month     = {8},
  note      = {Main Track},
  doi       = {10.24963/ijcai.2021/488},
  url       = {https://doi.org/10.24963/ijcai.2021/488},
}
TY - CPAPER TI - SPADE: A Semi-supervised Probabilistic Approach for Detecting Errors in Tables AU - Pham, Minh AU - Knoblock, Craig A. AU - Chen, Muhao AU - Vu, Binh AU - Pujara, Jay T2 - Proceedings of the Thirtieth International Joint Conference on Artificial Intelligence, IJCAI-21 PB - International Joint Conferences on Artificial Intelligence Organization PY - 2021 SP - 3543 EP - 3551 DO - 10.24963/ijcai.2021/488 UR - https://doi.org/10.24963/ijcai.2021/488 ER -Copied
Machine-readable versions of this paper, for tools and AI agents:





