
Understanding the Effect of Bias in Deep Anomaly Detection
Proceedings of the Thirtieth International Joint Conference on Artificial Intelligence. Main Track. Pages 3314-3320.
https://doi.org/10.24963/ijcai.2021/456
Keywords
- Data Mining: Anomaly/Outlier Detection
- Machine Learning: Semi-Supervised Learning
- Machine Learning: Deep Learning
Abstract
Anomaly detection presents a unique challenge in machine learning, due to the scarcity of labeled anomaly data. Recent work attempts to mitigate such problems by augmenting training of deep anomaly detection models with additional labeled anomaly samples. However, the labeled data often does not align with the target distribution and introduces harmful bias to the trained model. In this paper, we aim to understand the effect of a biased anomaly set on anomaly detection. Concretely, we view anomaly detection as a supervised learning task where the objective is to optimize the recall at a given false positive rate. We formally study the relative scoring bias of an anomaly detector, defined as the difference in performance with respect to a baseline anomaly detector. We establish the first finite sample rates for estimating the relative scoring bias for deep anomaly detection, and empirically validate our theoretical results on both synthetic and real-world datasets. We also provide an extensive empirical study on how a biased training anomaly set affects the anomaly score function and therefore the detection performance on different anomaly classes. Our study demonstrates scenarios in which the biased anomaly set can be useful or problematic, and provides a solid benchmark for future research.
- [Chalapathy and Chawla, 2019] Raghavendra Chalapathy and Sanjay Chawla. Deep learning for anomaly detection: A survey. arXiv preprint arXiv:1901.03407, 2019.
- [Chandola et al., 2009] Varun Chandola, Arindam Banerjee, and Vipin Kumar. Anomaly detection: A survey. ACM Comput. Surv., 41(3), July 2009.
- [Dua and Graff, 2017] Dheeru Dua and Casey Graff. UCI machine learning repository, 2017.
- [Emmott et al., 2015] Andrew Emmott, Shubhomoy Das, Thomas Dietterich, Alan Fern, and Weng-Keen Wong. A meta-analysis of the anomaly detection problem. arXiv preprint arXiv:1503.01158, 2015.
- [Golan and El-Yaniv, 2018] Izhak Golan and Ran El-Yaniv. Deep anomaly detection using geometric transformations. In Proc. of NeurIPS, pages 9758-9769, 2018.
- [Goyal et al., 2020] Sachin Goyal, Aditi Raghunathan, Moksh Jain, Harsha Vardhan Simhadri, and Prateek Jain. Drocc: Deep robust one-class classification. In Proc. of ICML, 2020.
- [Hendrycks et al., 2019] Dan Hendrycks, Mantas Mazeika, Saurav Kadavath, and Dawn Song. Using self-supervised learning can improve model robustness and uncertainty. In Proc. of NeurIPS, pages 15663-15674, 2019.
- [Johnson and Khoshgoftaar, 2019] Justin M Johnson and Taghi M Khoshgoftaar. Survey on deep learning with class imbalance. Journal of Big Data, 6(1):27, 2019.
- [Lee et al., 2018] Kimin Lee, Honglak Lee, Kibok Lee, and Jinwoo Shin. Training confidence-calibrated classifiers for detecting out-of-distribution samples. In Proc. of ICLR, 2018.
- [Li et al., 2019] Zhijing Li, Zhujun Xiao, Bolun Wang, Ben Y. Zhao, and Haitao Zheng. Scaling deep learning models for spectrum anomaly detection. In Proc. of Mobi- Hoc, page 291-300, 2019.
- [Liu and Ma, 2019] Kun Liu and Huadong Ma. Explor- ing background-bias for anomaly detection in surveillance videos. In Proc. of MM, pages 1490-1499, 2019.
- [Liu et al., 2018] Si Liu, Risheek Garrepalli, Thomas Diet- terich, Alan Fern, and Dan Hendrycks. Open category de- tection with PAC guarantees. In Proc. of ICML, 2018.
- [Massart, 1990] Pascal Massart. The tight constant in the dvoretzky-kiefer-wolfowitz inequality. Ann. Probab., 18(3):1269-1283, 07 1990.
- [Panareda Busto and Gall, 2017] Pau Panareda Busto and Juergen Gall. Open set domain adaptation. In Proc. of ICCV, pages 754-763, 2017.
- [Pang et al., 2019] Guansong Pang, Chunhua Shen, and An- ton van den Hengel. Deep anomaly detection with devia- tion networks. In Proc. of KDD, pages 353-362, 2019.
- [Parzen, 1980] Emanuel Parzen. Quantile functions, conver- gence in quantile, and extreme value distribution theory. Technical report, Texas A & M University, 1980. [Ruff et al., 2018]
- Lukas Ruff, Robert A. Vandermeulen, Nico Görnitz, Lucas Deecke, Shoaib A. Siddiqui, Alexan- der Binder, Emmanuel Müller, and Marius Kloft. Deep one-class classification. In Proc. of ICML, 2018.
- [Ruff et al., 2020a] Lukas Ruff, Robert A. Vandermeulen, Billy Joe Franks, Klaus-Robert Müller, and Marius Kloft. Rethinking assumptions in deep anomaly detection. arXiv preprint arXiv:2006.00339, 2020.
- [Ruff et al., 2020b] Lukas Ruff, Robert A. Vandermeulen, Nico Görnitz, Alexander Binder, Emmanuel Müller, Klaus-Robert Müller, and Marius Kloft. Deep semi- supervised anomaly detection. In Proc. of ICLR, 2020.
- [Saenko et al., 2010] Kate Saenko, Brian Kulis, Mario Fritz, and Trevor Darrell. Adapting visual category models to new domains. In Proc. of ECCV, pages 213-226. Springer, 2010.
- [Schölkopf et al., 1999] Bernhard Schölkopf, Robert Williamson, Alex Smola, John Shawe-Taylor, and John Platt. Support vector method for novelty detection. In Proc. of NIPS, page 582-588, 1999.
- [Siddiqui et al., 2016] Md Amran Siddiqui, Alan Fern, Thomas G Dietterich, and Shubhomoy Das. Finite sam- ple complexity of rare pattern anomaly detection. In UAI, 2016.
- [Tong et al., 2020] Alexander Tong, Guy Wolf, and Smita Krishnaswamy. Fixing bias in reconstruction-based anomaly detection with lipschitz discriminators. In Proc. of MLSP, 2020.
- [Valiant, 1984] Leslie G Valiant. A theory of the learnable. Communications of the ACM, 27(11):1134-1142, 1984.
- [Vapnik, 1992] Vladimir Vapnik. Principles of risk mini- mization for learning theory. In Proc. of NIPS, pages 831- 838, 1992.
- [Xiao et al., 2017] Han Xiao, Kashif Rasul, and Roland Vollgraf. Fashion-MNIST: a novel image dataset for benchmarking machine learning algorithms. arXiv preprint arXiv:1708.07747, 2017.
- [Yamanaka et al., 2019] Yuki Yamanaka, Tomoharu Iwata, Hiroshi Takahashi, Masanori Yamada, and Sekitoshi Kanai. Autoencoding binary classifiers for supervised anomaly detection. arXiv preprint arXiv:1903.10709, 2019.
- [Ye et al., 2021] Ziyu Ye, Yuxin Chen, and Haitao Zheng. Understanding the effect of bias in deep anomaly detec- tion. arXiv preprint arXiv:2105.07346, 2021.
- [Zhou and Paffenroth, 2017] Chong Zhou and Randy C. Paf- fenroth. Anomaly detection with robust deep autoen- coders. In Proc. of KDD, 2017.
References were extracted automatically from the PDF and may contain errors.
Full text extracted automatically from the PDF; figures, tables and equations may differ. The PDF is the version of record.
1 Introduction
Anomaly detection [Chandola et al., 2009] trains a formal model to identify unexpected or anomalous instances in incoming data, whose behavior differs from normal instances. It is particularly useful for detecting problematic events such as digital fraud, structural defects, and system malfunctions. Building accurate anomaly detection models is a well-known challenge in machine learning, due to the scarcity of labeled anomaly data. The classical and most common approach is to train anomaly detection models using only normal data 1 , i.e., first train a model using a corpus of normal data to capture normal behaviors, then to configure the model to flag instances with large deviations as anomalies. Researchers have also developed deep learning methods to better capture the complex structure in the data [Ruff et al., 2018; Zhou and Paffenroth, 2017]. Following the terminology introduced by [Chandola et al., 2009], we refer to these models as deep semi-supervised anomaly detection models.
∗Contact Author
1 Existing literature has used different terms to describe such models, e.g., semi-supervised anomaly detection [Chandola et al., 2009] and unsupervised anomaly detection [Ruff et al., 2018].
Recently, a new line of anomaly detection models propose to leverage available labeled anomalies during model training, i.e., train an anomaly detection model using both normal data and additional labeled anomaly samples as they become available [Ruff et al., 2020b; Yamanaka et al., 2019; Ruff et al., 2020a]. Existing works show that these new models achieve considerable performance improvements beyond the models trained using only normal data. We hereby refer to these models as deep supervised anomaly detection models 2 [Chandola et al., 2009].
When exploring these models, we found when the labeled anomalies (used to train the model) do not align with the target distribution (typically unknown), they can introduce harmful bias to the trained model. Specifically, when comparing the performance of a supervised anomaly detector to its semi-supervised version, the performance difference varies significantly across test anomaly data, some better and some worse. That is, using labeled anomalies during model training does not always improve model performance; instead, it may introduce unexpected bias in anomaly detection outcomes.
In this paper, we aim to devise a rigorous and systematic understanding on the effect of labeled anomalies on deep anomaly detection models. We formally state the anomaly detection problem as a learning task aiming to optimize the recall of anomalous instances at a given false positive ratea performance metric commonly used by many real-world anomaly detection tasks [Liu et al., 2018; Li et al., 2019]. We then show that different types of anomalous labels produce different anomaly scoring functions. Next, given any reference anomaly scoring function, we formally define the relative scoring bias of an anomaly detector as its difference in performance with the reference scoring function.
2 Some works termed these models as semi-supervised anomaly detection [Ruff et al., 2020b; Yamanaka et al., 2019; Ruff et al., 2020a] while others termed them as supervised anomaly detection [Chandola et al., 2009].
| Task Type | Distribution Shift | Known Target Distribution | Known Target Label Set |
|---|---|---|---|
| Imbalanced Classification [Johnson and Khoshgoftaar, 2019] Closed Set Domain Adaptation [Saenko et al., 2010] Open Set Domain Adaptation [Panareda Busto and Gall, 2017] Anomaly Detection [Chalapathy and Chawla, 2019] | No Yes Yes Yes | N/A Yes Yes No | N/A Yes No No |
Following our definition 3 , we establish the first finite sample rates for estimating the relative scoring bias for deep anomaly detection. We empirically validate our assumptions and theoretical results on both synthetic and three real-world datasets 4 (Fashion-MNIST, StatLog (Landsat Satellite), and Cellular SpectrumMisuse [Li et al., 2019]).
Furthermore, we provide an extensive empirical study on how additional labeled data affects the anomaly score function and the resulting detection performance. We consider the above three real-world datasets and six deep anomaly detection models. Our study demonstrates a few typical scenarios in which the labeled anomalies can be useful or problematic, and provides a solid benchmark for future research. Our main contributions are as follows:
- We systematically expose the bias effect and discover the issue of large performance variance in deep anomaly detectors, caused by the additional labeled anomalies in training.
- We model the effect of biased training as relative scoring bias, and establish the first finite sample rates for estimating the relative scoring bias of the trained models.
- We conduct empirical experiments to verify and characterize the impact of the relative scoring bias on six popular anomaly detection models, and three real-world datasets.
To the best of our knowledge, we are the first to formally study the effect of additional labeled anomalies on deep anomaly detection. Our results show both significant positive and negative impacts from them, and suggest model trainers must treat additional labeled data with extra care. We believe this leads to new opportunities to improve anomaly detectors and deserves more attention from the research community.
2 RelatedWork
Anomaly detection models. While the literature on anomaly detection models is extensive, the most relevant to our work are deep learning based models. Following the term in Chandola et al. [2009], we consider two types of models:
- Semi-supervised anomaly detection refers to models trained on only normal data, e.g., [Zhou and Paffenroth, 2017; Ruff et al., 2018; Goyal et al., 2020];
- Supervised anomaly detection refers to models trained on normal data and a small set of labeled anomalies [Pang et al., 2019; Yamanaka et al., 2019; Ruff et al., 2020a; Ruff et al., 2020b; Goyal et al., 2020]. Due to the increasing need of making use of labled anomalies in real-world applications, this type of work has gain much attention recently.
3 Our definition of scoring bias for anomaly detection aligns with the classical notion of bias in the supervised learning setting, with the key difference being the different performance metric.
4 The Appendix containing additional proofs and experiement results can be found in the long version of our paper [Ye et al., 2021].
Another line of recent work proposes to use synthetic anomalies [Golan and El-Yaniv, 2018; Hendrycks et al., 2019; Lee et al., 2018], "forcing" the model to learn a more compact representation for normality. While the existing work has shown empirically additional labeled anomalies in training may help detection, it does not offer any theoretical explanation, nor does it consider the counter-cases when additional labeled anomalies hurt detection.
Deep anomaly detection models can also be categorized by architectures and objectives, e.g., hypersphere-based models [Ruff et al., 2018; Ruff et al., 2020b] and reconstruction based models [Zhou and Paffenroth, 2017; Yamanaka et al., 2019] (see Table 2). We consider both types in this work.
Bias in anomaly detection. While the issue of domainmismatch has been extensively studied as transfer learning in general supervised learning scenarios, it remains an open challenge for anomaly detection tasks. Existing work on anomaly detection has explored bias in semi-supervised setting when noise exists in normal training data [Tong et al., 2020; Liu and Ma, 2019], but little or no work has been done on the supervised setting (i.e., models trained on both normal data and some labeled anomalies). Other well-studied supervised tasks, as summarized in Table 1, generally assume that one can draw representative samples from the target domain. Unlike those studies, anomaly detection tasks are constrained by limited information on unknown types of anomalies in testing, thus additional labeled data in training can bring significant undesired bias. This poses a unique challenge in inferring and tackling the impact of bias in anomaly detection (e.g., defending against potential data poisoning attacks). To the best of our knowledge, we are the first to identify and systematically study the bias caused by an additional (possibly unrepresentative) labeled anomaly set in deep anomaly detection models (as shown in Section 5).
PAC guarantees for anomaly detection. Despite significant progress on developing theoretical guarantees for classification [Valiant, 1984], little has been done for anomaly detection tasks. Siddiqui et al. [2016] first establish a PAC framework for anomaly detection models by the notion of pattern space, but it is challenging to be generalized to deep models. Liu et al. [2018] propose a model-agnostic approach with PAC guarantees on unsupervised models. We follow the basic setting from this line to address the convergence of the relative scoring bias. Closely aligned with the empirical risk minimization framework [Vapnik, 1992], our definition for bias facilitates connections to fundamental concepts in learning theory and brings rigor in theoretical study of anomaly detection. In contrast to prior work, our proof relies on a novel adaption of the key theoretical tool from Massart et al. [1990], which allows us to extend our theory to characterize the notion of scoring bias as defined in Section 3.2.
3 ProblemFormulation
We now formally state the anomaly detection problem. Consider a model class Θ for anomaly detection, and a (labeled) training set D sampled from a mixture distribution D over the normal and anomalous instances. A model θ maps each input instance x to a continuous output, which corresponds to anomaly score sθ(x). The model uses a threshold τθ on the score function to produce a binary label for x.
Given a threshold τθ, we define the False Positive Rate (FPR) of θ on the input data distribution as FPR(sθ, τθ) = P [sθ(x) > τθ | y = 0], and the True Positive Rate (TPR, a.k.a. Recall) as TPR(sθ, τθ) = P [sθ(x) > τθ | y = 1]. The FPR and TPR are competing objectives-thus, a key challenge for anomaly detection algorithms is to identify a configuration of the score, threshold pair (sθ, τθ) that strikes a balance between the two metrics. W.l.o.g. 5 , in this paper we focus on the following scenario, where the objective is to maximize TPR subject to a target FPR. Formally, let 1 - q be the target FPR; we define the optimal anomaly detector as 6
3.1 AGeneral Anomaly Detection Framework
The performance metric (namely TPR) in Problem 3.1 depends on the entire predictive distribution, and cannot be easily evaluated on any single data point. Thus, rather than directly solving Problem 3.1, practical anomaly detection algorithms (e.g., Deep SVDD [Ruff et al., 2018]) often rely on a two-stage process: (1) learning the score function sθ from training data via a surrogate loss, and (2) given sθ from the previous step, computing the threshold function τθ on the training data. Formally, given a model class Θ, a training set D, a loss function ℓ, and a target FPR 1 - q, a two-staged anomaly detection algorithm outputs:
The first part of Equation 3.2 amounts to solving a supervised learning problem. Here, the loss function ℓ could be instantiated into latent-space-based losses (e.g., Deep SVDD), margin-based losses (e.g., OCSVM [Sch¨olkopf et al., 1999]), or reconstruction-based losses (e.g., ABC [Yamanaka et al., 2019]); therefore, many contemporary anomaly detection models fall into this framework. To set the threshold ˆ τθ , we consider using the distribution of the anomaly scores ˆ sθ(·) from a labeled validation set Dval ∼ D. Let Dval := Dval 0 ∪ Dval a where Dval 0 and Dval a denote the subset of normal data and the subset of abnormal data of Dval . Denote the empirical CDFs for anomaly scores assigned to x in Dval 0 and Dval a as ˆ F0 and ˆ Fa, respectively. Given a target FPR value 1-q, similar to Liu et al. [2018], one can compute the threshold as ˆ τθ = max{u ∈ R : ˆ F0(u) ≤ q}. Algorithm 1 summarizes the steps to solve the second part of Equation 3.2.
5 Our results can be easily extended to the setting where the goal is to minimize FPR subject to a given TPR (cf. Appendix B).
6 This formulation aligns with many contemporary works in deep anomaly detection. For example, [Li et al., 2019] show that in real world, it is desirable to detect anomalies with a prefixed low false alarm rate; [Liu et al., 2018] formulate anomaly detection in a similar way, where the goal is to minimize FPR for a fixed TPR.
Algorithm 1: Computing the anomaly detection threshold for Problem 3.2
Data: A validation dataset Dval and a scoring function s(·).
Result: A score threshold achieving a target FPR and the corresponding recall on Dval .
- 1 Get anomaly score s(x) for each x in Dval .
- 2 Compute empirical CDF ˆ F0(x) and ˆ
- Fa(x) for anomaly scores of x in Dval 0 and Dval a .
- 3 Output detection threshold
- 4 Output TPR (recall) on Dval r = 1- ˆ Fa(ˆ τ ).
- ˆ τ =max{u ∈ R : ˆ F0(u) ≤ q}. a as ˆ
3.2 Scoring Bias
Given a model class Θ and a training set D, we define the scoring bias of a detector (ˆ sθ, ˆ τθ) as:
We call (ˆ sθ, ˆ τθ) a biased detector if bias(ˆ sθ, ˆ τθ) > 0. In practice, due to the biased training distribution and the fact that the two-stage process in Equation 3.2 is not directly optimizing TPR, the resulting anomaly detectors are often biased by construction. One practically relevant performance measure is the relative scoring bias, defined as the difference in TPR between two anomaly detectors, subject to the constraints in Equation 3.2. It captures the relative strength of two algorithms in detecting anomalies, thus is an important indicator for model evaluation and selection 7 . Formally, given two arbitrary anomaly score functions s, s′ and corresponding threshold functions τ, τ ′ obtained from Algorithm 1, we define the relative scoring bias between s and s′ as:
Note that when s′ = s∗θ , the relative scoring bias (equation 3.4) reduces to the scoring bias (equation 3.3). We further define the empirical relative scoring bias between s and s′ as
where ̂ TPR(s, τ) = 1n ∑nj=1 1s(xj)>τ;yj=1 denotes the TPR (recall) estimated on a finite validation set of size n. In the following sections, we will investigate both the theoretical properties and the empirical behavior of the empirical relative scoring bias for contemporary anomaly detectors.
7 This TPR-based definition for bias is also useful for group fairness study. For example, in Figure 3, we have shown how model performances vary across different sub-groups of anomalies.
| Type | Semi-supervised (trained on normal data) | Supervised (trained on normal & some abnormal data) |
|---|---|---|
| Hypersphere-based | Deep SVDD [Ruff et al., 2018] | Deep SAD [Ruff et al., 2020b], Hypersphere Classifier (HSC) [Ruff et al., 2020a] |
| Reconstruction-based | Autoencoder (AE) [Zhou and Paffenroth, 2017] | Supervised AE (SAE), Autoencoding Binary Classifier (ABC) [Yamanaka et al., 2019] |
4 Finite Sample Analysis for Empirical Relative Scoring Bias
In this section, we show how to estimate the relative scoring bias (Equation 3.4) given any two scoring functions s, s′ . As an example, s could be induced by a semi-supervised anomaly detector trained on normal data only, and s′ could be induced by a supervised anomaly detector trained on a biased anomaly set. We then provide a finite sample analysis of the convergence rate of the empirical relative scoring bias, and validate our theoretical analysis via a case study.
4.1 Finite Sample Guarantee
Notations. Assuming when determining ˆ τ, scoring functions s, s′ are evaluated on the unbiased empirical distribution of normal data; the empirical TPR ˆ r are estimated on the unbiased empirical distribution of abnormal data. Let {si := s(xi) | xi, yi = 0}n0 i=1 be anomaly scores evaluated by s(·) on n0 i.i.d. random normal samples. Let F0(t) := P [s(x) ≤ t | y = 0] be the CDF of s(x), and ˆ F0(t) := 1 n0 ∑n0 i=1 1si≤t;yi=0 be its empirical CDF. For n1 i.i.d. samples {sj := s(xj) | xj, yj = 1}n1 j=0 , we denote the CDF as Fa(t) := P [s(x) ≤ t | y = 1], and the emprical CDF as ˆ Fa(t) := 1 n1 ∑n1 j=1 1sj≤t;yj=1. Similarly, we denote the CDF and emiprical CDF for {s′i | yi = 0}n0 i=0 as F ′0 (t) and ˆ F ′0 (t), and those for {s′ j | yj = 1}n1 j=0 as F ′a (t) and ˆ F ′a (t).
Infinite sample case. In the limit of infinite data (both normal and abnormal), ˆ F0, ˆ Fa, ˆ F ′0and ˆ F ′a converge to the true CDFs (cf. Skorokhod's representation theorem and Theorem 2A of [Parzen, 1980]), and hence the empirical relative scoring bias also converges. Proposition 1 establishes a connection between the CDFs and the relative scoring bias.
Proposition 1. Given two scoring functions s, s′ and a target FPR 1 - q, the relative scoring bias is ξ(s, s′ ) = Fa(F -1 0 (q)) - F ′a (F ′0-1 (q)).
Here, F -1 (·) is the quantile function. The proof of Proposition 1 follows from the fact that for corresponding choice of τ, τ ′ in Algorithm 1, TPR(s, τ) = 1 - Fa(F -1 0 (q)), and TPR(s′ , τ ′ ) = 1 - F ′a (F ′0-1 (q)).
Next, a direct corollary of the above result shows that, for the special cases where both the scores for normal and abnormal data are Gaussian distributed, one can directly compute the relative scoring bias. The proof is listed in Appendix A.
Corollary 2. Let 1-q be a fixed target FPR. Given two scoring functions s, s′ , assume that s(x) | (y = 0) ∼ N(µ0, σ0), s(x) | (y = 1) ∼ N(µa, σa), s′ (x) | (y = 0) ∼ N(µ′0 , σ′0 ), s′ (x) | (y = 1) ∼ N(µ′a , σ′a ). The relative scoring bias is
where Φ denotes the CDF of the standard Gaussian.
Finite sample case. In practice, when comparing the performance of two scoring functions, we only have access to finite samples. Thus, it is crucial to bound the estimation error due to insufficient samples. We now establish a finite sample guarantee for estimating the relative scoring bias. Our result extends the analysis of Liu et al. [2018]. The validation set contains a mixture of n = n0 + n1 i.i.d. samples, with n0 normal samples and n1 abnormal samples where n1 n = α.
The following result shows that under mild assumptions of the continuity of the CDFs and quantile functions, the sample complexity for achieving |ˆ ξ - ξ| ≤ ϵ:
Theorem 3. Assume that Fa, F ′a , F -1 0 , F ′0-1 are Lipschitz continuous with Lipschitz constant ℓa, ℓ′a , ℓ-0 , ℓ′0-, respectively. Let α be the fraction of abnormal data among n i.i.d. samples from the mixture distribution. Then, w.p. at least 1 - δ, with
the empirical relative scoring bias satisfies |ˆ ξ - ξ| ≤ ϵ.
We defer the proof of Theorem 3 to Appendix B. The sample complexity for estimating the relative scoring bias n grows as O ( 1 α2 ϵ2 log 1δ ). Note the analysis of our bound involves a novel two-step process which first bounds the estimation of the threshold for the given FPR, and then leverages the Lipschitz continuity condition to derive the final bound.
4.2 Case Study
We conduct a case study to validate our main results above using a synthetic dataset and three real-world datasets. We consider six anomaly detection models listed in Table 2, and they lead to consistent results. For brevity, we show results when using Deep SVDD as the baseline model trained on normal data only and Deep SAD as the supervised model trained on normal and some abnormal data. Later in Appendix D, we include results of other models, including Deep SVDD vs. HSC, AE vs. SAE, and AE vs. ABC.
Synthetic dataset. Similar to Liu et al. [2018], we generate our synthetic dataset by sampling data from a mixture data distribution S, w.p. 1 - α generating the normal data distribution S0 and w.p. α generating the abnormal data distribution Sa. Data in S0 are sampled randomly from a 9dimensional Gaussian distribution, where each dimension is independently distributed as N(0, 1). Data in Sa are sampled from another 9-dimensional distribution, which w.p. 0.4 have 3 dimensions (uniformly chosen at random) distributed as N (1.6, 0.8), w.p. 0.6 have 4 dimensions (uniformly chosen at random) distributed as N(1.6, 0.8), and have the remaining dimensions distributed as N(0, 1). This ensures meaningful feature relevance, point difficulty and variation for the abnormal data distribution [Emmott et al., 2015].
We obtain score functions s and s′ by training Deep SVDD and Deep SAD respectively on samples from the synthetic dataset (10K data from S0, 1K data from Sa). We configure the training, validation and test set so they have no overlap. Thus, the training procedure will not affect the sample complexity for estimating the bias. To set the threshold, we fix the target FPR to be 0.05, and vary the number of normal data in the validation set n from {100, 1K, 10K}. We then test the score function and threshold on a fixed test dataset with a large number (20K) of normal data and α×20K of abnormal data. We vary α from {0.01, 0.05, 0.1, 0.2}.
Real-world datasets. We consider 3 real-world datasets targeting disjoint subjects: Fashion-MNIST [Xiao et al., 2017], StatLog [Dua and Graff, 2017] and Cellular Spectrum Misuse [Li et al., 2019]. Detailed descriptions of datasets and training configurations are in Appendix C.
Distribution of anomaly scores. Figure 1 is a sample plot of score distributions on the test set of the synthetic dataset with α = 0.1. We make two key observations. First, the distribution curves follow a rough bell shape. Second and more importantly, while the abnormal score distribution can closely mimic the normal score distribution under the unsupervised model, it deviates largely from the normal score distribution after semi-supervised training. This confirms that semi-supervised training does introduce additional bias.
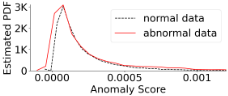
We also examine the anomaly score distributions for models trained on real-world datasets, including Fashion-MNIST and Cellular Spectrum Misuse. While the score distributions are less close to Gaussian, we do observe the same trend where normal and abnormal score distributions become significantly different after applying semi-supervised learning. The results are shown in 7 and 8 in Appendix D.
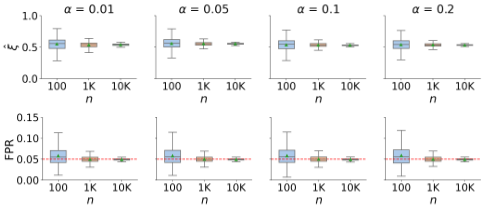
Convergence of relative scoring bias (ˆ ξ) and FPR. Here we present the convergence results in Figure 2 for the synthetic dataset in terms of the quantile distribution of ˆ ξ (computed as the difference of the empirical TPR according to Equation 3.5) between Deep SVDD and Deep SAD and the quantile distribution of Deep SAD's FPR. Results for other models and three real-world datasets are in Appendix D, and show consistent trends.
Similar to our theoretical results, we observe a consistent trend of convergence in FPR and ˆ ξ as the sample complexity goes up. In particular, as n goes up, FPR converges to the prefixed value of 0.05 and ˆ ξ also converges to a certain level.
We also examine the rate of convergence w.r.t to n. Section 4.1 shows that n required for estimating ˆ ξ grows in the same order as 1 α2 ϵ2 log 1δ . That is, the estimation error ϵ decreases at the rate of 1 √n ; furthermore, as α increases, n required for estimating ˆ ξ decreases. This can be seen from Figure 2 (top figure) where at n = 10000, the variation of ˆ ξ at α = 0.2 is 50% less than that at α = 0.01.
5 Impact of Scoring Bias on Anomaly Detection Performance
We perform experiments to study the end-to-end impact of relative scoring bias on deep anomaly detection models. Our goal is to understand the type and severity of performance variations caused by different anomaly training sets.
Experiment setup. We consider six deep anomaly detection models previously listed in Table 2, and three real-world datasets: Fashion-MNIST, Statlog and Cellular Spectrum Misuse. For each dataset, we build normal data by choosing a single class (e.g., top in Fashion-MNIST), and treat other classes as abnormal classes. From those abnormal classes, we pick a single class as the abnormal training data, and the rest as the abnormal test data on which we test separately. We then train θ0 := (sθ0 , τθ0 ), a semi-supervised anomaly detector using normal training data, and θs := (sθs , τθs ) a supervised anomaly detector using both normal and abnormal training data. We follow the original paper of each model to implement the training process. Detailed descriptions on datasets and training configurations are listed in Appendix C.
We evaluate the potential bias introduced by different abnormal training data by comparing the model recall (TPR) value of both θ0 and θs against different abnormal test data. We define the bias to be upward (↑) if TPR(θs) > TPR(θ0), and downward (↓) if TPR(θs) < TPR(θ0).
We group experiments into three scenarios: (1) abnormal training data is visually similar to normal training data; (2) abnormal training data is visually dissimilar to normal training data; and (3) abnormal training data is a weighted combination of (1) and (2). We compute visual similarity as the L2 distance, which are listed in Appendix E.
We observe similar trends across all three datasets and all six anomaly detection models. For brevity, we summarize and illustrate our examples by examples of two models (Deep SVDD as θ0 and Deep SAD as θs), and two datasets (FashionMNIST and Cellular Spectrum Misuse). We report full results on all the models and datasets in Appendix E.
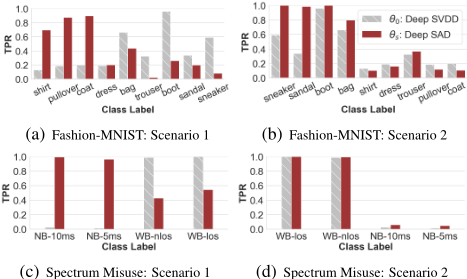
Figure 3: Model TPR under Scenario 1 and 2, trained on FashionMNIST and Cellular SpectrumMisuse. In each figure, we compare the performance of θ0 = Deep SVDD and θs = Deep SAD when tested on abnormal data. We arrange abnormal test data (by their class label) in decreasing similarity with training abnormal data. The leftmost entry in each figure is the class used for abnormal training. For Fashion-MNIST, the normal data is top; for Cellular Spectrum Misuse, the normal data is normal.
Scenario 1: Abnormal training data visually similar to normal training data. In this scenario, the use of abnormal data in model training does improve detection on the abnormal training class, but also creates considerable performance changes, both upward and downward, for other test classes. The change direction depends heavily on the similarity of the abnormal test data to the training abnormal data. The model performance on test data similar to the training abnormal data moves upward significantly while that on test data dissimilar to the training abnormal moves downward significantly.
For Fashion-MNIST, the normal and abnormal training classes are top and shirt, respectively, which are similar to each other. Figure 3(a) plots the recalls of model θ0 and θs for all abnormal classes, sorted by their similarity to the training abnormal class (shirt). We see that TPR(θs) on classes similar to shirt (e.g., pullover) is significantly higher than TPR(θ0). But for classes dissimilar from shirt (e.g., boot), TPR(θs) is either similar or significantly lower. For Cellular Spectrum Misuse, the normal and abnormal training classes are normal and NB-10ms, respectively. The effect of training bias is highly visible in Figure 3(c), where TPR(θs) on NB-10ms and NB-5ms rises from almost 0 to >93% while TPR(θs) on WB-nlos and WB-los drops by over 50%.
Scenario 2: Abnormal training data visually dissimilar to normal training data. Like in Scenario 1, abnormal training examples improve the detection of abnormal data belonging to the training class and those similar to the training class. Different from Scenario 1, there is little downward changes at abnormal classes dissimilar to the training abnormal.
This is illustrated using another Fashion-MNIST example in Figure 3(b). While the normal training class is still top, we use a new abnormal training class of sneaker that is quite dissimilar from top. TPR(θs) on sneaker, sandal, boot and bag are largely elevated to 0.8 and higher, while TPR(θs) on other classes are relatively stable. Finally, the same applies to another example of Cellular Spectrum Misuse in Figure 3(d) where the abnormal training class is WB-los, which is quite different from the normal data. In this case, we observe little change to the model recall.
Scenario 3: Mixed abnormal training data. We run three configurations of group training on Fashion-MNIST (normal: top; abnormal: shirt & sneaker) by varying weights of the two abnormal classes in training. Detailed results for each configuration are in Appendix E. Overall, the use of group training does improve the model performance, but it can still introduce downward bias on some classes. However, under all three configurations, there is a consistent pattern of downward bias for an abnormal test class (trouser) and upward bias for most other abnormal classes. Specifically, trouser is relatively more dissimilar to both training abnormal classes.
Summary. Our empirical study shows that training with biased anomalies can have significant impact on deep anomaly detection, especially on whether using labeled anomalies in training would help detect unseen anomalies. When the labeled anomalies are similar to the normal instances, the trained model will likely face large performance degradation on unseen anomalies different from the labeled anomalies, but improvement on those similar to the labeled anomalies. When the labeled anomalies are dissimilar to the normal instances, the supervised model is more useful than its semisupervised version. Such difference is likely because different types of abnormal data affect the training distribution (thus the scoring function) differently. In particular, when the labeled anomalies are similar to the normal data, they lead to large changes to the scoring function and affect the detection of unseen anomalies "unevenly". Our results suggest that model trainers must treat labeled anomalies with care.
6 Conclusions and FutureWork
To the best of our knowledge, our work provides the first formal analysis on how additional labeled anomalies in training affect deep anomaly detection. We define and formulate the impact of training bias on anomaly detector's recall (or TPR) as the relative scoring bias of the detector when comparing to a baseline model. We then establish finite sample rates for estimating the relative scoring bias for supervised anomaly detection, and empirically validate our theoretical results on both synthetic and real-world datasets. We also empirically study how such relative scoring bias translates into variance in detector performance against different types of unseen anomalies, and demonstrate scenarios in which additional labeled anomalies can be useful or harmful. As future work, we will investigate how to construct novel deep anomaly detection models by exploiting upward scoring bias while avoiding downward scoring bias, especially when one can actively collect/synthesize new labeled anomalies.
Acknowledgements
This work is supported in part by NSF grants CNS-1949650 and CNS-1923778, and a C3.ai DTI Research Award 049755. Any opinions, findings, and conclusions or recommendations expressed in this material are those of the authors and do not necessarily reflect the views of any funding agencies.
@inproceedings{ijcai2021p456,
  title     = {Understanding the Effect of Bias in Deep Anomaly Detection},
  author    = {Ye, Ziyu and Chen, Yuxin and Zheng, Haitao},
  booktitle = {Proceedings of the Thirtieth International Joint Conference on
               Artificial Intelligence, {IJCAI-21}},
  publisher = {International Joint Conferences on Artificial Intelligence Organization},
  editor    = {Zhi-Hua Zhou},
  pages     = {3314--3320},
  year      = {2021},
  month     = {8},
  note      = {Main Track},
  doi       = {10.24963/ijcai.2021/456},
  url       = {https://doi.org/10.24963/ijcai.2021/456},
}
TY - CPAPER TI - Understanding the Effect of Bias in Deep Anomaly Detection AU - Ye, Ziyu AU - Chen, Yuxin AU - Zheng, Haitao T2 - Proceedings of the Thirtieth International Joint Conference on Artificial Intelligence, IJCAI-21 PB - International Joint Conferences on Artificial Intelligence Organization PY - 2021 SP - 3314 EP - 3320 DO - 10.24963/ijcai.2021/456 UR - https://doi.org/10.24963/ijcai.2021/456 ER -Copied
Machine-readable versions of this paper, for tools and AI agents:





