
Transfer Learning via Optimal Transportation for Integrative Cancer Patient Stratification
Proceedings of the Thirtieth International Joint Conference on Artificial Intelligence. Main Track. Pages 2760-2766.
https://doi.org/10.24963/ijcai.2021/380
Keywords
- Machine Learning: Transfer, Adaptation, Multi-task Learning
- Machine Learning Applications: Bio/Medicine
- Machine Learning Applications: Applications of Unsupervised Learning
Abstract
The Stratification of early-stage cancer patients for the prediction of clinical outcome is a challenging task since cancer is associated with various molecular aberrations. A single biomarker often cannot provide sufficient information to stratify early-stage patients effectively. Understanding the complex mechanism behind cancer development calls for exploiting biomarkers from multiple modalities of data such as histopathology images and genomic data. The integrative analysis of these biomarkers sheds light on cancer diagnosis, subtyping, and prognosis. Another difficulty is that labels for early-stage cancer patients are scarce and not reliable enough for predicting survival times. Given the fact that different cancer types share some commonalities, we explore if the knowledge learned from one cancer type can be utilized to improve prognosis accuracy for another cancer type. We propose a novel unsupervised multi-view transfer learning algorithm to simultaneously analyze multiple biomarkers in different cancer types. We integrate multiple views using non-negative matrix factorization and formulate the transfer learning model based on the Optimal Transport theory to align features of different cancer types. We evaluate the stratification performance on three early-stage cancers from the Cancer Genome Atlas (TCGA) project. Comparing with other benchmark methods, our framework achieves superior accuracy for patient outcome prediction.
- [Bashiri et al., 2017] Azadeh Bashiri, Marjan Ghazisaeedi, Reza Safdari, Leila Shahmoradi, and Hamide Ehtesham. Improving the prediction of survival in cancer patients by using machine learning techniques: experience of gene ex- pression data: a narrative review. Iranian journal of public health, 46(2):165, 2017.
- [Chen et al., 2012] Minmin Chen, Zhixiang Xu, Kilian Weinberger, and Fei Sha. Marginalized denoising autoencoders for domain adaptation. arXiv preprint arXiv:1206.4683, 2012.
- [Cheng et al., 2017] Jun Cheng, Jie Zhang, Yatong Han, Xusheng Wang, Xiufen Ye, Yuebo Meng, Anil Parwani, Zhi Han, Qianjin Feng, and Kun Huang. Integrative anal- ysis of histopathological images and genomic data predicts clear cell renal cell carcinoma prognosis. Cancer research, 77(21):e91-e100, 2017.
- [Cuturi, 2013] Marco Cuturi. Sinkhorn distances: Light- speed computation of optimal transport. In Advances in neural information processing systems, pages 2292-2300, 2013.
- [Dai et al., 2007] Wenyuan Dai, Qiang Yang, Gui-Rong Xue, and Yong Yu. Boosting for transfer learning. In Pro- ceedings of the 24th international conference on Machine learning, pages 193-200, 2007.
- [Ding et al., 2008] Chris HQ Ding, Tao Li, and Michael I Jordan. Convex and semi-nonnegative matrix factoriza- tions. IEEE transactions on pattern analysis and machine intelligence, 32(1):45-55, 2008.
- [Flamary and Courty, 2021] Rémi Flamary and Nicolas Courty. Pot: Python optimal transport. Journal of Machine Learning Research, 22(78):1-8, 2021.
- [Ganin and Lempitsky, 2015] Yaroslav Ganin and Victor Lempitsky. Unsupervised domain adaptation by backprop- agation. In International conference on machine learning, pages 1180-1189. PMLR, 2015.
- [Hanahan and Weinberg, 2011] Douglas Hanahan and Robert A Weinberg. Hallmarks of cancer: the next generation. cell, 144(5):646-674, 2011.
- [He et al., 2019] Yiwei He, Yingjie Tian, and Dalian Liu. Multi-view transfer learning with privileged learning framework. Neurocomputing, 335:131-142, 2019.
- [Kourou et al., 2015] Konstantina Kourou, Themis P Exar- chos, Konstantinos P Exarchos, Michalis V Karamouzis, and Dimitrios I Fotiadis. Machine learning applications in cancer prognosis and prediction. Computational and structural biotechnology journal, 13:8-17, 2015.
- [Liu et al., 2018] Jianfang Liu, Tara Lichtenberg, Kather- ine A Hoadley, Laila M Poisson, Alexander J Lazar, An- drew D Cherniack, Albert J Kovatich, Christopher C Benz, Douglas A Levine, Adrian V Lee, et al. An integrated tcga pan-cancer clinical data resource to drive high-quality sur- vival outcome analytics. Cell, 173(2):400-416, 2018.
- [Long et al., 2013] Mingsheng Long, Jianmin Wang, Guiguang Ding, Jiaguang Sun, and Philip S Yu. Transfer feature learning with joint distribution adaptation. In Proceedings of the IEEE international conference on computer vision, pages 2200-2207, 2013.
- [Lu et al., 2020] Zixiao Lu, Siwen Xu, Wei Shao, Yi Wu, Jie Zhang, Zhi Han, Qianjin Feng, and Kun Huang. Deep- learning-based characterization of tumor-infiltrating lym- phocytes in breast cancers from histopathology images and multiomics data. JCO Clinical Cancer Informatics, 4:480-490, 2020.
- [Pan et al., 2010] Sinno Jialin Pan, Ivor W Tsang, James T Kwok, and Qiang Yang. Domain adaptation via transfer component analysis. IEEE Transactions on Neural Net- works, 22(2):199-210, 2010.
- [Shao et al., 2019] Wei Shao, Zhi Han, Jun Cheng, Liang Cheng, Tongxin Wang, Liang Sun, Zixiao Lu, Jie Zhang, Daoqiang Zhang, and Kun Huang. Integrative analysis of pathological images and multi-dimensional genomic data for early-stage cancer prognosis. IEEE Transactions on Medical Imaging, 39(1):99-110, 2019.
- [Shen et al., 2012] Ronglai Shen, Qianxing Mo, Nikolaus Schultz, Venkatraman E Seshan, Adam B Olshen, Jason Huse, Marc Ladanyi, and Chris Sander. Integrative sub- type discovery in glioblastoma using icluster. PloS one, 7(4):e35236, 2012.
- [YANG and Gao, 2013] Pei Yang YANG and Wei Gao. Multi-view discriminant transfer learning. In Proceedings of the 23rd Int. Joint Conf. Artif. Intell, page 1848-1854, 2013.
- [Zhang et al., 2018] Changqing Zhang, Huazhu Fu, Qinghua Hu, Xiaochun Cao, Yuan Xie, Dacheng Tao, and Dong Xu. Generalized latent multi-view subspace clustering. IEEE transactions on pattern analysis and machine intelligence, 42(1):86-99, 2018.
- [Zhang et al., 2020] Guang-Yu Zhang, Yu-Ren Zhou, Xiao- Yu He, Chang-Dong Wang, and Dong Huang. One-step kernel multi-view subspace clustering. Knowledge-Based Systems, 189:105126, 2020.
- [Zhao et al., 2017] Handong Zhao, Zhengming Ding, and Yun Fu. Multi-view clustering via deep matrix factoriza- tion. In Proceedings of the AAAI Conference on Artificial Intelligence, volume 31, 2017.
- [Zhu et al., 2019] Yongchun Zhu, Fuzhen Zhuang, Jindong Wang, Jingwu Chen, Zhiping Shi, Wenjuan Wu, and Qing He. Multi-representation adaptation network for cross- domain image classification. Neural Networks, 119:214- 221, 2019.
- [Zhu et al., 2020] Yongchun Zhu, Fuzhen Zhuang, Jindong Wang, Guolin Ke, Jingwu Chen, Jiang Bian, Hui Xiong, and Qing He. Deep subdomain adaptation network for im- age classification. IEEE Transactions on Neural Networks and Learning Systems, 2020.
References were extracted automatically from the PDF and may contain errors.
Full text extracted automatically from the PDF; figures, tables and equations may differ. The PDF is the version of record.
1 Introduction
Cancer is one of the major public health problems worldwide. The occurrence of cancer is increasing annually due to the aging of the population, as well as the prevalence of risk factors such as pollution. During the past decade, precision medicine approaches have been developed to reduce mortality rate and increase patient survival time. For precision medicine, the stratification for early-stage cancer patient into correct risk groups is critical for clinical decision-making [Bashiri et al., 2017]. This process helps to estimate prognosis especially survival duration as well as response to treatment. To achieve this goal, advanced statistical and machine learning (ML) algorithms are often needed [Kourou et al., 2015].
∗Contact Author
Despite the wide applications of ML models in biomedical problems, there still exists large challenges in predicting clinical outcome for cancer patients. Firstly, most of the ML methods only used one specific modality of biomarkers (e.g., image or genomic data) for the prognosis of human cancers. However, such single data modality cannot fully capture the overall mechanism and development of human cancers and thus lacks sufficient predictive power. Accordingly, many researchers have developed integrative analysis pipelines to combine multi-modal data such as imaging (e.g., histopathological and CT images) and genomic data (e.g., gene mutation and gene expression) for cancer outcome prediction [Shao et al., 2019]. Another challenge is that the collection of multimodal data for cancer patients is costly and difficult while the sample size is often too small to train prediction models on a specific cancer type. Accordingly, it is of great interest to examine if the knowledge learned from other cancer types can be transferred to improve the prediction results on the target cancer type [Hanahan and Weinberg, 2011]. As one widely used ML paradigm, transfer Learning (TL) enables us to leverage knowledge from multiple cancer types and increase the prediction accuracy on the target cancer type. In recent years, Optimal Transport (OT) has been introduced in solving TL problems. In comparisonwith other domain adaption strategies in TL, OT defines a metric (distance) between probability distributions which can better exploit the geometry of the underlying feature spaces [Flamary and Courty, 2021].
Based on the above consideration, we propose an OT-based multi-view TL algorithm for the prognosis of early-stage cancers by integrating histopathological images with gene expression profiles frommultiple types of cancers. Specifically, with the help of the OT framework , our proposed TL approach conducts integrative analysis using non-negative matrix factorization (NMF) techniques and seeking common latent features between two cancer types (e.g., breast invasive carcinoma and kidney renal papillary cell carcinoma), followed by iCluster [Shen et al., 2012], an integrative genomic data clustering tool to improve patient stratification performance for different cancer types. To the best of knowledge, this is the first study that utilize the OT framework to solve the multi-view TL algorithm. The experimental results show that the proposed method outperforms other benchmark algorithms on both synthetic data and real datasets from The Cancer Genome Atlas (TCGA). These results not only confirm the superiority of our method for clinical outcome prediction, but also suggest that transferring knowledge between different cancer types has great potential for improving cancer precision medicine. Furthermore, this work demonstrates the advantage of incorporating OT in multi-view TL problems.
2 RelatedWorks
A large number of biomarkers have been discovered for cancer prognosis, such as histopathological images, genetic alterations, epigenomic changes, gene, and protein expression signatures [Liu et al., 2018]. With the recent availability of large-scale computing resources and the fast development of digital image technology, we can extract meaningful features from the whole slide histopathological images that are highly associated with the development of cancers. They have shown great promise for the diagnosis and prognosis of different types of cancers such as breast cancer [Lu et al., 2020]. In addition, some researchers also integrated pathological images with genomic profiles for the survival analysis of human cancer, since different biomarkers may provide complementary information that can improve the prognosis performance [Cheng et al., 2017]. However, most of the existing studies treat the prediction task on different cancer types independently and they overlook the fact that clinical knowledge derived from one cancer type can also help the prediction task on other cancer types. Recently, the TL approach has received a lot of attention. Generally, existing TL algorithms can be categorized into the following two strategies: instance weighting strategy and feature transformation strategy. The instance weighting strategy adopts an instance and domain weighting strategy to adapt the source distribution from the source to the target domain [Dai et al., 2007], while the feature transformation strategy aims at minimizing the marginal and the conditional distribution differences while preserving the underlying data structure [Pan et al., 2010; Long et al., 2013]. Our proposed method belongs to the second category, which uses the OT framework to align the distributions of multi-view features between different cancer types. In comparison with previous related works, our proposed Multi-view TL via OT (MVTOT) method has three main contributions: 1) we transfer multiple data modalities from the source to the target domain at the same time without utilizing source domain labels; 2) we design an update rule which ensures the objective function to decrease monotonically at each iteration and eventually converge to the Karush-Kuhn-Tucker (KKT) point; and 3) we not only verify the effectiveness of the proposed MVTOT method on synthetic data but also demonstrate its superiority on multiple TCGA datasets for stratifying early-stage cancer patients.
3 ProposedMethod
3.1 Notations
We first introduce the notations for the proposed unsupervised multi-view transfer learning algorithm. Given a set of unlabeled source domain instances with two views, Ds = {xs,v i }v=1,2,i=1,··· ,Ns , where xs,1 i and xs,2 i represent the extracted genomic and pathological image features for the ith patient in the source domain, respectively. Similar to the source domain instance, we also define the examples in the target domain as Dt = {xt,v j }v=1,2,j=1,··· ,Nt . In this study, we have applied the same pre-processing pipelines to extract features from pathological images and gene expression data and their corresponding dimensionalities are identical across different cancer types, i.e. xs,v i , xt,v j ∈ Rdv , ∀v = 1, 2, i = 1, · · · ,Ns, j = 1, · · · ,Nt. For the simplicity of calculation, we rewrite the data matrix of the v-th view of the source and the target domain in a concise form: Xl,v = [xl,v 1 , · · · , xl,v Nl ] ∈ Rdv×Nl , v = 1, 2, l = s, t.
3.2 Non-negative Matrix Factorization for Multi-view Learning
We firstly define the traditional Non-negative Matrix Factorization problem as follows:
Definition 1 (Non-Negative Matrix Factorization (NMF)). Given a non-negative input data matrix X = [x1, · · · , xN] ∈ Rd×N + , we can factorize X into a basis matrix W and a low-rank coefficient matrix H as X ≈ WH, where W = [w1, · · · ,wK] ∈ Rd×K + , H = [h1, · · · , hN] ∈ RK×N + , and K ≪min(d,N) (K is the number of basis vectors). To preserve as much information as possible, we need to minimize the discrepancy defined by the squared Frobenius norm,
For the better fusion of multi-view data, our goal is to seek one common representation across all modalities. Based on definition 1, we formulate the Non-negative Matrix Factorization problem for multi-view learning as follows:
where the first term aims at factorizing the data of each view Xv , v = 1, 2 into a dictionary matrix Wv and a low-rank coefficient matrix Hv . The second term is used to seek a common representation H∗ and enforce the disagreement between the representation of each view i.e., Hv as small as possible.
3.3 Optimal Transportation
By considering the fact that different cancer types share some commonalities, in this paper, we focus on transferring the knowledge from the source cancer cohort to improve the prediction performance on target cancer type.
Traditionally, researchers apply metrics such as Maximum Mean Discrepancy (MMD), Cross Entropy (CE), and Kullback-Leibler (KL) divergence to directly measure the discrepancy of feature distributions on different domains. The main drawback of CE and KL divergence is that they fail to utilize the geometric information in the space. MMD summaries the distributional differences using the distance between weighted feature means from two domains. It can hardly represent the data distribution unless we have adequate labels. Compared with these methods, the OT framework can capture the intrinsic geometry structure of feature spaces in the setting that no label is available in both domains. In this section, we will briefly introduce the OT framework, and the regularized OT problem can be defined as follows, Definition 2 (Regularized OT). Given two discrete probability distributions µα = ∑mi=1 aiδws i (on Ds) and µβ = ∑nj=1 bjδwtj (on Dt), where δw is the Dirac function at location w ∈ Rd , {ai}mi=1 , {bj}nj=1 are probability mass associated with {ws i }mi=1 , {wtj }nj=1 , the relaxed version of earth moving distance (EMD) problem seek to find an optimal coupling matrix P ∈ Rm×n + to minimize the total cost,
where C ∈ Rm×n
+ is the cost matrix, C(i, j) represents the cost of moving a probability mass from ws i to wtj , P ∈ Π(a, b) := {T ∈ Rm×n + |T1n = a,TT 1m = b}, P(i, j) represents the amount of mass we move from location ws i to location wtj . Later works [Cuturi, 2013] converted the objective function into computational effective version by adding an entropy regularization term. The regularized OT problem reads,
where Ω(P) = - ∑i,j Pi,jlog(Pi,j) is the entropy of the coupling matrix.
3.4 Multi-view Transfer Learning via Optimal Transportation (MVTOT).
In the previous studies [Ding et al., 2008], they demonstrated the equivalency of NMF and spectral clustering, matrix factorization and K-means clustering. Specifically, columns of W represent the clustering centroids while H contains the cluster membership indicators. Remark that for MMD, the distance between Ds and Dt is defined by the distance between weighted sample feature means, which could be interpreted as centroids of data distributions in the feature space. Inspired by MMD, we utilize OT distance to define the distance between empirical distributions of clustering centers,
where a and b are probability mass associated to {ws,v i }Ki=1 and {wt,v j }Kj=1 , v is the view indicator (v ∈ {1, 2}).
Remark 1. Although we require a common latent dimension K across different domains, it's easy to extend our method to the condition that the number of basis vectors in Ws,v and Wt,v are different. Another assumption is that weights for each feature is the same, i.e. a = b = 1K/K ∈ RK (1K is a K dimensional all one column vector). Nevertheless, it's not an intrinsic constraint.
Remark 2. Since we calculate the OT distance between ˆµs,v and ˆµt,v for each data modality (v = 1, 2) separately, we can parallelly define two cost matrices {Cv }2v=1 ∈ RK×K . In our work, we use the squared Euclidean distance as the cost, i.e. Cv (i, j) := ∥∥ws,v i -wt,v j ∥∥22 . We then re-write the cost matrix in the following matrix function form,
where 1K is a K-dimensional all-ones column vector. For a fixed coupling matrix Pv , we can take derivative of the regularized OT distance (3) with respect to Ws,v and Wt,v . It enables us to update the basis matrix based on the gradient information.
To accommodate more general data matrices with mixed signs, we adopt the Semi-nonnegative matrix factorization (Semi-NMF) [Ding et al., 2008], which is an extension of traditional NMF. The objective function is the same as NMF but without the non-negative constraint onW. Then, the objective function of the proposed MVTOT method reads,
where Xl,v ,Wl,v ,Hl,v (l ∈ {s, t}, v ∈ {1, 2}) indicate the data, basis and coefficient matrices for the v-th view in the source or target domain, respectively. Hl,∗ (l ∈ {s, t}) denotes the common representation for the source or target domain. The second term is the optimal distance between ˆµs,v = ∑Ki=1 1K/Kδws,v i and ˆµt,v = ∑Kj=1 1K/Kδwt,v j . By defining a = b = 1K/K ∈ RK , Cv follows (5), we can represent the regularized OT distance defined by (3) as LϵCv(1K/K, 1K/K). Finally, JW and JH are two regularization terms with respect to W and H. Here, we use the squared Frobenius norm in equation (6) to control the magnitude of W and H.
4 Description of the Algorithm
Before optimizing the objective function using an alternative manner, we introduce two lemmas about convergence properties. They ensure that the value of the objective function will decrease monotonically after each iteration and the converged H satisfies the Karush-Kuhn-Tucker (KKT) conditions.
Lemma 1. If a function J : Rn×K + → R has the following form:
where B ∈ Rn×K , A ∈ RK×K , A is symmetric. By letting B+ij = (Bij + |Bij|)/2, B-ij = (|Bij| -Bij)/2, the update rule:
will lead J(·) to decrease monotonically after each iteration. Lemma 2. When the algorithm converge, the limit solution of (7) (i.e. Y(t) = Y(t+1) for updating time t large enough) satisfies the KKT condition.
Proof. Both proofs can be found in the supplementary material.
Based on the above two lemmas, we apply an alternative way to update the coefficient matrix H and basis matrix W as follows.
4.1 Update the Coefficient Matrix H
When we update Hl,v for a domain l and view v, we fix all basis matrix Wl′ ,v′ , l′ = s, t, v′ = 1, 2, the common expression matrix Hl′ ,∗ , l′ = s, t and Hl′′ ,v′′ with l′′ ̸= l or v′′ ̸= v. Then, we can simplify the objective function by dropping superscripts for domains and views,
where IK is a K by K indentity matrix. Let Y = HT , ˜B = β(H∗ )T +XT W, and ˜A = WT W+ (β + γ2)IK, we can use (7) to update H,
4.2 Update the Basis MatrixW
When we update the basis matrix Ws,v for the v-th view of the source domain, since the basis matrix for each view is updated separately, we can drop the superscript for view. We fix coefficient matrices Hl,v , l = s, t, v = 1, 2, coupling matrices Pv , v = 1, 2, and the basis matrix of the target domain Wt,v . The object function can be re-formulated as:
Since we impose no constraint on Wl , we can calculate the stationary point of Ws directly and obtain the following update rule,
Ws � (Xs (Hs )T +αWtPT )(Hs (Hs )T + ˜αIK)-1 , (9) where ˜α = (α/K + γ1). Notice that we use the fact that P ∈ Π(1K/K, 1K/K) when we calculate the derivative. The same technique can be applied to calculate the derivative of Wt . More details can be found in the supplementary material.
4.3 Update the CouplingMatrix P
Since we update dictionary matrices for each data modality separately, the superscript for view is dropped. Notice that when we fixWs andWt , the cost matrix (5) is fixed. Then, we can solve the regularized OT problem (3) by directly using the Optimal Transport solver [Flamary and Courty, 2021].
Algorithm 1 Multi-view transfer learning via Optimal Transport
- 1: Input: {Xl,v }l=s,t,v=1,2 and hyper-parameters K, α, β, γ1, γ2, ϵ (regularization weight in (3)).
- 2: Initialization: Use Semi-NMF algorithms [Ding et al., 2008] to factorize {Xl,v }l=s,t,v=1,2 and get {Wl,v }l=s,t,v=1,2, {Hl,v }l=s,t,v=1,2; Initialize {Cv }2v=1 , {Pv }2v=1 , and Hl,∗ with regard to (5), (3) and (10) respectively.
3: repeat
- 4: For each data view v = 1, 2,
- UpdateWs,v with regard to (9); Reconstruct the cost function Cv with regard to (5); Solve Pv in (3) using the OT solver [Flamary and Courty, 2021].
- Repeat the same process forWt,v .
- 5: Update {Hl,v }l=s,t,v=1,2 with regard to (8); Recompute Hl,∗ with regard to (10).
- 6: until convergence criterion is satisfied.
- 7: Output: Ht,∗ .
4.4 Update the Common RepresentationH∗
When updating Hl,∗ , we fix all other matrices. By taking derivative of (6) with regard to Hl,∗ and setting it to be zero, we obtain,
Hl,∗ is non-negative since it's an average of non-negative matrices.
5 Experiments and Results
In this section, we verify our proposed method by two sets of experiments. The first set of experiments are performed on a synthetic dataset. By comparing classification accuracy, Silhouette score and NMI (normalized mutual information) score for clustering, we demonstrate that our method outperforms other benchmark methods. The second set of experiments are performed on the TCGA datasets. We verify the advantages of our method by comparing P-values of log-rank tests for survival analysis.
5.1 Results on Synthetic Data
In the first set of experiment, we generate Nc = 3 centroids with dimension d1 = 20 on the source domain Ds, where each centroid represents one class. Then, we generate 100 samples following a Gaussian distribution with standard deviation σ1 = 2 around each centroids. In order to generate two different views of each samples, we project each sample onto two higher dimensional spaces (d3 = 50, d4 = 100) by multiplying two random matrices V1 ∈ Rd1×d3 , V2 ∈ Rd1×d4 . We use a similar strategy to generate samples (latent dimension d2 = 20) on the target domain, the only difference is that the standard deviation for each centroid is set as σ2 = 4. Besides the above synthetic dataset, we generate another dataset using the same approach but specify d1 = 25, d2 = 18, σ1 = 2, σ2 = 3.
| d1 = d2 = 20 | d1 = 25, d2 = 18 | |||||
|---|---|---|---|---|---|---|
| Methods | ACC | Silh | NMI | ACC | Silh | NMI |
| Kmeans | 0.70 | 0.36 | 0.37 | 0.44 | 0.27 | 0.16 |
| TCA | 0.49 | -0.05 | 0.22 | 0.34 | -0.12 | 0.01 |
| TAB | 0.66 | 0.31 | 0.73 | 0.66 | 0.18 | 0.73 |
| mSDA | 0.33 | / | 0 | 0.33 | / | 0 |
| OKMSC | 0.45 | -0.03 | 0.06 | 0.95 | 0.15 | 0.82 |
| MDT | 0.28 | 0.01 | 0.02 | 0.23 | 0.25 | 0.04 |
| MVTOT | 0.91 | 0.11 | 0.71 | 0.97 | 0.16 | 0.89 |
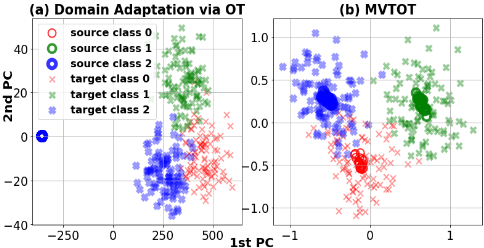
We compare our method with other benchmark methods, including: TCA [Pan et al., 2010], TAB [Dai et al., 2007], mSDA [Chen et al., 2012], OKMSC [Zhang et al., 2020], MDT [YANG and Gao, 2013]. From Table 1, we conclude that our method achieves the highest accuracy and NMI score among all methods. This indicates that our MVTOT can more effectively transfer knowledge from the multi-view source data to promote the prediction task on the target domain. The reason is that OT directly compares distributions of features in the source and the target domain while other methods are not as informative as the OT method. In Figure 1 (a), we use OT [Flamary and Courty, 2021] to map samples from the source domain data to the target domain and visualize them using a principle component analysis (PCA) plot. However, this mapping is meaningless since all of source domain samples are mapped to a single point (1st PC ≈ -400, 2nd PC ≈ 0). On the right hand side, by using MVTOT, we extract low-rank representationHs andHt for the source and the target domain respectively. By using OT to map Hs on the target feature space, all of source domain samples are mapped to the center of the corresponding class on the target domain. It demonstrates that MVTOT can help us to explore common low-rank structure of datasets from different sources.
5.2 TCGA Patients Stratification
TCGA contains genomic and histopathological image data for 32 cancer types. We focus on three cancer types including breast invasive carcinoma (BRCA), kidney renal papillary cell carcinoma (KIRP), and lung squamous cell carcinoma (LUSC). For each cancer type, we select early-stage (stages I and II) patients with matched gene expression data, histopathological images, and clinical outcomes. We apply the MVTOT method to integrate eigen-genes and tissue morphological features and transfer knowledge from one cancer type to the other. Eigen-genes are obtained by clustering genes into co-expressed modules and summarizing each module into an eigen-vector using singular value decomposition [Cheng et al., 2017]. Finally we get 66 eigen-genes for each sample. For the tissue morphological features derived from the histopathological images, we follow the feature extraction pipeline described in [Cheng et al., 2017]. Using this pipeline to extract and aggregate cell-level morphological features, we obtain a 150-dimensional feature for each patient.
For the implementation of the proposed MVTOT method, we adapt knowledge from the source domain (e.g., BRCA) to the target domain (e.g., LUSC) and represent target samples by the low-rank matrix Ht,∗ shown in Eq.(6). Then, We apply iCluster to cluster early-stage cancer patients based on Ht,∗ . Finally, we test if these two groups have distinct survival times using the Kaplan-Meier (KM) estimator and logrank test. We compare that the prognostic power of different approaches by stratifying cancer patients into two subgroups (i.e., the high and low survival risk groups) as shown in Fig. 2. In Fig. 2, cancer 1 � cancer 2 means that we transfer knowledge from cancer type 1 to cancer type 2 and perform stratification on cancer type 2. We can observe that most of the KM curves for low-risk and high-risk patients are separable. In Fig. 2 (a), (b), (c), (e), and (f), gaps between survival curves increasing as time goes by, indicating that MVTOT can stratify patients into groups with distinct survival rates (Pvalue = 0.006, 0.008, 0.005, 0.0004, and 0.006 respectively). The only insignificant (P-value = 0.0758) scenario is transferring KIRP dataset to LUSC dataset (Fig. 2 (d)). We summarize the proposed methods and ablation study results in Table 2. We observe that the P-values for MVTOT is smaller than single view TL via OT (SVTOT) in most conditions (except K � L and L � K). This means combining these two data L � K
| Methods | B�K | B�L | K�B | K�L | L�B | L�K |
|---|---|---|---|---|---|---|
| Clinical | 0.4569 | 0.0635 | 0.8651 | 0.0635 | 0.8651 | 0.4569 |
| MVTOT | 0.0062 | 0.0078 | 0.0053 | 0.0758 | 0.0004 | 0.0061 |
| SVTOT (g) | 0.0143 | 0.0797 | 0.0456 | 0.0899 | 0.0028 | 0.0046 |
| SVTOT (i) | 0.0189 | 0.0971 | 0.0174 | 0.0390 | 0.0007 | 0.0643 |
| MVNMF | 0.0106 | 0.0503 | 0.0029 | 0.0503 | 0.0029 | 0.0106 |
| TL Pairs | JDA (g) | JDA (i) | TCA (g) | TCA (i) | DSAN (g) | DSAN (i) | mSDA (g) | mSDA (i) | RGrad (g) | RGrad (i) |
|---|---|---|---|---|---|---|---|---|---|---|
| B K | 0.212 | 0.968 | 0.128 | 0.986 | 0.080 | 0.526 | 0.064 | 0.294 | 0.791 | 0.533 |
| � B L | 0.492 | 0.032 | 0.248 | 0.032 | 0.774 | / | 0.178 | 0.021 | 0.405 | 0.527 |
| � K B | 0.216 | 0.318 | 0.006 | 0.399 | 0.373 | 0.802 | 0.513 | 0.638 | 0.606 | 0.099 |
| � K L | 0.197 | 0.990 | 0.366 | 0.875 | 0.207 | 0.782 | 0.910 | 0.526 | 0.155 | 0.363 |
| � L B | 0.572 | 0.110 | 0.093 | 0.110 | 0.950 | 0.592 | 0.681 | 0.630 | 0.130 | 0.186 |
| � L K | 0.891 | 0.656 | 0.242 | 0.956 | 0.047 | 0.211 | 0.590 | 0.316 | 0.204 | 0.915 |
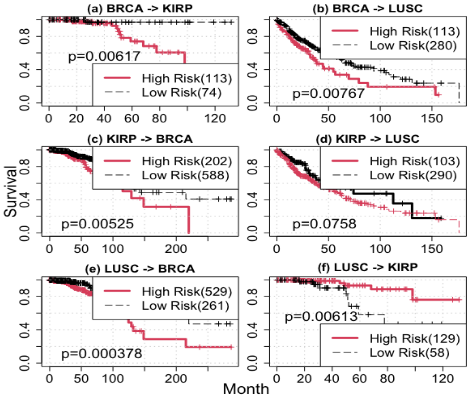
Figure 2: KM curves by applying MVTOT on pair-wise cancer types
modalities with compatible and complementary information can improve the performance of early-stage cancer stratification. We also investigate the condition when TL components in our model is removed. This multi-view NMF (MVNMF) model is inferior or equivalent to MVTOT in most conditions (B � K, B � L, L � K, L�B). It provides superior results than MVTOT in stratification breast and lung patients without borrowing knowledge from kidney cancer to cluster them. Nevertheless, its performance on the K � L task is worse than SVTOT (i). It implies that knowledge from kidney cancer may be ineffective for understanding breast cancer.
| Methods | B�K | B�L | K�B | K�L | L�B | L�K |
|---|---|---|---|---|---|---|
| LMSC | 0.137 | 0.728 | 0.050 | 0.728 | 0.050 | 0.137 |
| OKMSC | 0.886 | 0.160 | 0.837 | 0.160 | 0.837 | 0.886 |
| DMFMV | / | / | 0.190 | / | 0.190 | / |
| MRAN | 0.002 | / | / | / | 0.800 | / |
| MDT | 0.745 | 0.957 | 0.673 | 0.051 | 0.196 | 0.130 |
| MDTM | 0.428 | 0.998 | 0.821 | 0.132 | 0.064 | 0.021 |
We also compare our method with other benchmark methods, including: 1) TL benchmarks: JDA [Long et al., 2013], TCA [Pan et al., 2010], DSAN [Zhu et al., 2020], mSDA [Chen et al., 2012], and RevGrad [Ganin and Lempitsky, 2015]; 2) Multi-view clustering benchmarks: LMSC [Zhang et al., 2018], OKMSC [Zhang et al., 2020], and deepMFMV [Zhao et al., 2017]; 3) Multi-view TL benchmarks: MRAN [Zhu et al., 2019], MDT [YANG and Gao, 2013], and MDTM [He et al., 2019]. Since these TL methods require training data on the source domain to be labeled, we use the clinical stage (stage I and stage II) as their labels. As shown in Table 2, 3, 4, MVTOT achieves superior stratification results (P-value < 0.05) than other methods. Some of these methods (i.e. JDA (i), TCA (i), mSDA (i), TCA, MRAN, and MDTM) yield significant stratification results (P-val < 0.05) on some TL pairs. However, they fail to provide plausible performances on other TL tasks. The main reason is that their labels (clinical stage I and II) are less reliable for earlystage cancer patients stratification (see the first row in Table 2). Furthermore, these benchmarks methods are highly dependent on the choice of training set and hyper-parameters. These results indicate that our method is more reliable for making clinical decisions. More numerical experiments for convergence, stability, and complexity of our methods can be found in the supplementary material.
6 Conclusion
Our proposed method MVTOT uses NMF and OT to integrate multiple data views and transfer knowledge from one data domain to another one. Since OT gives us an informative description of the distance between two empirical distributions, it helps us to compare feature spaces of the source and the target domain. Although MVTOT is an unsupervised method, it outperforms all semi-supervised benchmark methods when we evaluate them on synthetic data classification task and early-stage cancer patient stratification task. Our work demonstrated the feasibility and advantage of transferring knowledge learnt from one cancer type to improve the accuracy of prognosis to another cancer type.
Acknowledgments
This work is partially supported by IU Precision Health Initiative (ZL, JZ), NIH R01EB025018 grant (KH), and NIH R01 GM131491 (MZ).
@inproceedings{ijcai2021p380,
  title     = {Transfer Learning via Optimal Transportation for Integrative Cancer Patient Stratification},
  author    = {Liu, Ziyu and Shao, Wei and Zhang, Jie and Zhang, Min and Huang, Kun},
  booktitle = {Proceedings of the Thirtieth International Joint Conference on
               Artificial Intelligence, {IJCAI-21}},
  publisher = {International Joint Conferences on Artificial Intelligence Organization},
  editor    = {Prof. Zhi-Hua Zhou},
  pages     = {2760--2766},
  year      = {2021},
  month     = {8},
  note      = {Main Track},
  doi       = {10.24963/ijcai.2021/380},
  url       = {https://doi.org/10.24963/ijcai.2021/380},
}
TY - CPAPER TI - Transfer Learning via Optimal Transportation for Integrative Cancer Patient Stratification AU - Liu, Ziyu AU - Shao, Wei AU - Zhang, Jie AU - Zhang, Min AU - Huang, Kun T2 - Proceedings of the Thirtieth International Joint Conference on Artificial Intelligence, IJCAI-21 PB - International Joint Conferences on Artificial Intelligence Organization PY - 2021 SP - 2760 EP - 2766 DO - 10.24963/ijcai.2021/380 UR - https://doi.org/10.24963/ijcai.2021/380 ER -Copied
Machine-readable versions of this paper, for tools and AI agents:





