
Neighborhood Intervention Consistency: Measuring Confidence for Knowledge Graph Link Prediction
Proceedings of the Thirtieth International Joint Conference on Artificial Intelligence. Main Track. Pages 2090-2096.
https://doi.org/10.24963/ijcai.2021/288
© 2021 International Joint Conferences on Artificial Intelligence
Keywords
- Knowledge Representation and Reasoning: Semantic Web
- Knowledge Representation and Reasoning: Reasoning about Knowledge and Belief
- Knowledge Representation and Reasoning: Action, Change and Causality
Abstract
Link prediction based on knowledge graph embeddings (KGE) has recently drawn a considerable momentum. However, existing KGE models suffer from insufficient accuracy and hardly evaluate the confidence probability of each predicted triple. To fill this critical gap, we propose a novel confidence measurement method based on causal intervention, called Neighborhood Intervention Consistency (NIC). Unlike previous confidence measurement methods that focus on the optimal score in a prediction, NIC actively intervenes in the input entity vector to measure the robustness of the prediction result. The experimental results on ten popular KGE models show that our NIC method can effectively estimate the confidence score of each predicted triple. The top 10% triples with high NIC confidence can achieve 30% higher accuracy in the state-of-the-art KGE models.
- [Balazevic et al., 2019] Ivana Balazevic, Carl Allen, and Timothy M. Hospedales. Tucker: Tensor factorization for knowledge graph completion. In Proceedings of the 2019 Conference on Empirical Methods in Natural Language Processing, EMNLP-IJCNLP, pages 5184-5193, 2019.
- [Bordes et al., 2013] Antoine Bordes, Nicolas Usunier, Alberto García-Durán, Jason Weston, and Oksana Yakhnenko. Translating embeddings for modeling multi-relational data. In Proceedings of Advances in Neural Information Processing Systems (NIPS), pages 2787-2795, 2013.
- [Bordes et al., 2014] Antoine Bordes, Xavier Glorot, Jason Weston, and Yoshua Bengio. A semantic matching energy function for learning with multi-relational data. Machine Learning, 94:233-259, 2014.
- [Chami et al., 2020] Ines Chami, Adva Wolf, Da-Cheng Juan, Frederic Sala, Sujith Ravi, and Christopher Ré. Low- dimensional hyperbolic knowledge graph embeddings. In Proceedings of the 58th Annual Meeting of the Association for Computational Linguistics, ACL 2020, Online, July 5- 10, 2020, pages 6901-6914, 2020.
- [Dettmers et al., 2018] Tim Dettmers, Pasquale Minervini, Pontus Stenetorp, and Sebastian Riedel. Convolutional 2d knowledge graph embeddings. In Proceedings of the 32th AAAI Conference on Artificial Intelligence, pages 1811- 1818, 2018.
- [Guo et al., 2017] Chuan Guo, Geoff Pleiss, Yu Sun, and Kilian Q. Weinberger. On calibration of modern neural networks. In Proceedings of the 34th International Con- ference on Machine Learning, pages 1321-1330, 2017.
- [Lin et al., 2020] Xuan Lin, Zhe Quan, Zhi-Jie Wang, Tengfei Ma, and Xiangxiang Zeng. KGNN: knowledge graph neural network for drug-drug interaction prediction. In Proceedings of the Twenty-Ninth International Joint Conference on Artificial Intelligence, IJCAI 2020, pages 2739-2745, 2020. IJCAI
- [Nguyen et al., 2017] Dai Quoc Nguyen, Tu Dinh Nguyen, Dat Quoc Nguyen, and Dinh Q. Phung. A novel em- bedding model for knowledge base completion based on convolutional neural network. In Proceedings of the 2017 Conference of the North American Chapter of the Associa- tion for Computational Linguistics, volume 2, pages 327- 333, 2017.
- [Niculescu-Mizil and Caruana, 2005] Alexandru Niculescu- Mizil and Rich Caruana. Predicting good probabilities with supervised learning. In Proceedings of the 22nd Inter- national Conference on Machine learning, pages 625-632, 2005.
- [Pearl and Mackenzie, 2018] Judea Pearl and Dana Macken- zie. The Book of Why: the New Science of Cause and Effect. American Association for the Advancement of Sci- ence, 2018.
- [Pearl, 2000] Judea Pearl. Causality: Models, Reasoning, and Inference. Cambridge University Press, 2000.
- [Platt, 1999] John Platt. Probabilistic outputs for support vector machines and comparisons to regularized likelihood methods. Advances in Large Margin Classifiers, 10(3):61- 74, 1999.
- [Ruffinelli et al., 2020] Daniel Ruffinelli, Samuel Broscheit, and Rainer Gemulla. You can teach an old dog new tricks! on training knowledge graph embeddings. In Proceedings of the Eighth International Conference on Learning Rep- resentations, ICLR, 2020.
- [Safavi et al., 2020] Tara Safavi, Danai Koutra, and Edgar Meij. Evaluating the calibration of knowledge graph em- beddings for trustworthy link prediction. In Proceedings of the 2020 Conference on Empirical Methods in Natural Language Processing, EMNLP 2020, Online, November 16-20, 2020, pages 8308-8321. Association for Computa- tional Linguistics, 2020.
- [Sun et al., 2019] Zhiqing Sun, Zhihong Deng, Jianyun Nie, and Jian Tang. Rotate: Knowledge graph embedding by relational rotation in complex space. In Proceedings of the Seventh International Conference on Learning Represen- tations, ICLR, 2019.
- [Tabacof and Costabello, 2020] Pedro Tabacof and Luca Costabello. Probability calibration for knowledge graph embedding models. In Proceedings of the Eighth Inter- national Conference on Learning Representations, ICLR, 2020.
- [Toutanova and Chen, 2015] Kristina Toutanova and Danqi Chen. Observed versus latent features for knowledge base and text inference. In Proceedings of the 3rd Workshop on Continuous Vector Space Models and their Composition- ality, pages 57-66, 2015.
- [Trouillon et al., 2016] Théo Trouillon, Johannes Welbl, Se- bastian Riedel, Éric Gaussier, and Guillaume Bouchard. Complex embeddings for simple link prediction. In Pro- ceedings of the 33th International Conference on Machine Learning, pages 2071-2080, 2016.
- [Wang et al., 2017] Quan Wang, Zhendong Mao, Bin Wang, and Li Guo. Knowledge graph embedding: A survey of ap- proaches and applications. IEEE Transactions on Knowl- edge and Data Engineering, 29:2724-2743, 2017.
- [Yang et al., 2015] Bishan Yang, Wen-tau Yih, Xiaodong He, Jianfeng Gao, and Li Deng. Embedding entities and relations for learning and inference in knowledge bases. In Proceedings of the Third International Conference on Learning Representations, ICLR, 2015.
- [Zhang et al., 2020] Fuxiang Zhang, Xin Wang, Zhao Li, and Jianxin Li. Transrhs: A representation learning method for knowledge graphs with relation hierarchical structure. In Proceedings of the Twenty-Ninth Interna- tional Joint Conference on Artificial Intelligence, IJCAI 2020, pages 2987-2993, 2020. IJCAI
- [Zhao et al., 2020] Yang Zhao, Jiajun Zhang, Yu Zhou, and Chengqing Zong. Knowledge graphs enhanced neural ma- chine translation. In Proceedings of the Twenty-Ninth In- ternational Joint Conference on Artificial Intelligence, IJ- CAI 2020, pages 4039-4045, 2020. IJCAI
References were extracted automatically from the PDF and may contain errors.
Full text extracted automatically from the PDF; figures, tables and equations may differ. The PDF is the version of record.
1 Introduction
Knowledge graphs (KGs), which record real-world factual triples in the form of (head entity, relation, tail entity), have been widely applied in various AI domains [Lin et al., 2020; Zhao et al., 2020]. To achieve automatic KG completion, link prediction based on the knowledge graph embedding (KGE) technologies have recently drawn considerable attention [Zhang et al., 2020; Ruffinelli et al., 2020]. Given an entity and a relation (we call it an e-r query), a typical KGE model scores all candidate entities and selects the entity with the optimal score to compose a new triple. However, the new predicted triples cannot be added into KGs directly because of the insufficient accuracy and unreliable confidence measurement [Safavi et al., 2020].
Researchers are recently devoted to improving the confidence measurement of KGE models using probability calibration methods [Platt, 1999; Guo et al., 2017]. Tabacof and Costabello [Tabacof and Costabello, 2020] find that KGE models are not well-calibrated, and the probability estimates for triple classification are unreliable. Safavi et al. [Safavi et al., 2020] demonstrate that calibration techniques can significantly reduce the calibration error of KGE models in the relation prediction task. These research efforts mainly work on classification tasks in the KGE domain, only predicting in a few categories. However, link prediction is a more challenging "learning to rank" problem, aiming to find the target entity from tens of thousands of candidate entities.
∗The Corresponding Author
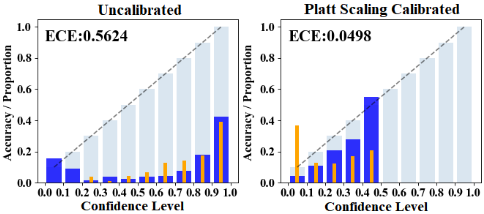
There are two main problems restricting the effectiveness of the probabilistic calibration methods for reliable link prediction in the KGE domain:
- Unsuitable confidence measurement. Previous measuring methods focus on the optimal score or compare it with other scores in the score sequence. However, as shown in Fig. 1(a), high optimal scores lead to high confidence but cannot achieve the same level accuracy. This is due to the fact that the score of each candidate only indicates its relative order among candidates in one prediction.
- Unreliable calibration metrics. Expected Calibration Error (ECE) [Niculescu-Mizil and Caruana, 2005] is commonly utilized to evaluate the calibration effect, but is not suitable for link prediction. Although ECE is greatly reduced after calibration in Fig. 1(b), most of the triples are compressed into the low confidence level, making it very hard to extract high-accuracy triples.
In this paper, we propose a novel confidence measurement method based on causal intervention, called Neighborhood Intervention Consistency (NIC). Different from previous methods focusing on the optimal scores, we evaluate the confidence score by verifying the robustness of prediction results. Benefiting from a causal inference analysis, we propose a NIC framework actively intervening the scoring process of KGE models. Specifically, we generate a series of neighborhood vectors for an input entity by adjusting the entity vector's value in different dimensions and observing whether the output sequences of the model changes or matches the original one. On this basis, we design several types of neighborhood intervention values and a dimension selection strategy for high-dimensional KGE models.
Furthermore, our link prediction experiments exploit new evaluation metrics to verify whether the predicted triples are valuable for KG completion, including the top 10% accuracy and confidence variance. Ten popular KGE models are selected for the evaluation, including six high-dimensional models and four low-dimensional ones. The experimental results show that NIC outperforms previous confidence measurement methods before and after calibration. The calibrated NIC score can effectively overcome the drawback of low confidence variance of the previous methods. Besides, the top 10% triples with high NIC confidence can achieve 30% higher accuracy in the state-of-the-art KGE models. Finally, we verify the optimal choices of the intervention value and prove that the dimension selection strategy can effectively balance the computational efficiency and prediction accuracy for high-dimensional KGE models.
2 Background
2.1 Knowledge Graph Embeddings
Let E and R denote the set of entities and relations, a knowledge graph (KG) G is a collection of factual triples (h, r, t), where h, t ∈ E and r ∈ R. |E| and |R| refer to the number of entities and relations in G, respectively. Knowledge Graph Embeddings aim to represent each entity e ∈ E (or relation r ∈ R) as a d-dimensional continuous vector, and learn a scoring function f : E × R × E → R to score each triple. Most KGE models are trained by minimizing a negative sampling loss, to make the score of the qualified triple higher than those of negative samples [Wang et al., 2017].
Link Prediction. Generalized link prediction tasks include entity prediction and relation prediction. In this paper, we focus on the more challenging entity prediction task. Given an e-r query (e, r), the typical link prediction aims to find the target entity m ∈ E satisfying that (e, r,m) or (m, r, e) belongs to knowledge graph G. As illustrated in Fig. 2(a), a KGE model needs to score all candidate triples and output a sorted score sequence. In the sequence, the entity with the optimal score is selected as m to construct the new triple.
Typical KGE Models. Various KGE models have been proposed, such as i) translation-based TransE [Bordes et al., 2013] and RotatE [Sun et al., 2019]; ii) factorization-based DistMult [Yang et al., 2015], ComplEx [Trouillon et al., 2016] and TuckER [Balazevic et al., 2019]; and iii) CNNbased ConvE [Dettmers et al., 2018] and ConvKB [Nguyen et al., 2017]. The major difference among them is the scoring function, because the negative sampling strategy or the loss function is generally universal.
| Model | Score Function | Model | Score Function |
|---|---|---|---|
| TransE | ‖h+ r - t‖ | TransH | Dhyp(h⊕ r, t) |
| DistMult | hT diag(Mr)t | DistH | Dhyp(h ◦ r, t) |
| ComplEx | Re(hcT diag(Mcr)tc ) | RotH | Dhyp(Rot(r)h, t) |
| ConvE | f(vec(f([¯h;¯r] ∗ ω))W)t | RefH | Dhyp(Ref(r)h, t) |
| RotatE | ‖h ◦ rc - t‖ | TuckER | W×h× r × t |
Based on the hyperbolic space, Chami et al. [Chami et al., 2020] recently propose two KGE models, RotH and RefH, which perform well in low-dimensional KGE situations. To ensure the breadth of the low-dimensional KGE evaluation, we further extend two hyperbolic-based variants, TransH and DistH, inspired by TransE and DistMult. Table 1 displays the scoring functions of the ten KGE models used in this paper.
2.2 Probability Calibration
The calibration of KGE models focuses on predicting confidence scores representing the actual correctness probabilities of predicted triples. Under an ideal situation, if the model predicts that a triple is true with a 0.9 confidence score, it should be correct 90% of the time. Model calibration requires reliable confidence measurement and effective calibration methods to fix the calibration errors.
Confidence Measurement Methods. In the KGE domain, two confidence measurement methods, SigmoidMax (SIG) and TopKSoftmax (TOP), have been applied in very recent literature [Tabacof and Costabello, 2020; Safavi et al., 2020]. Given the sorted score sequence S of a prediction, the two methods measure the confidence score by:
Both of them are computed by the single sequence S and focus on the optimal score.
Calibration Methods. There are also two typical calibration methods. Platt scaling [Platt, 1999] inputs prediction scores into a logistic regression, and learns scalar weights to output a confidence score for each sample. Isotonic regression [Guo et al., 2017] is a non-parametric calibration method, which fits a non-decreasing piece-wise constant function to the model output. Both methods can effectively improve calibration, but depend on reliable confidence measurement.
3 Neighborhood Intervention Consistency
We discuss a novel confidence measurement method, Neighborhood Intervention Consistency (NIC), in this section.
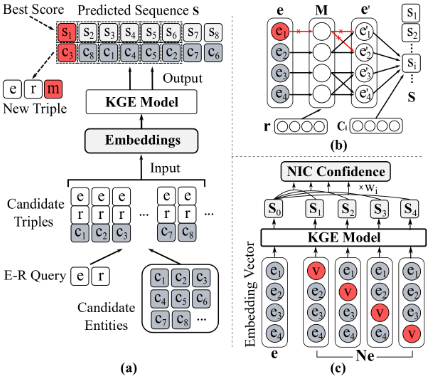
First, a causal graph is utilized to reveal the fundamental motivation of this method in Sec. 3.1, and then we introduce the basic framework of NIC in Sec. 3.2. After that, we detail two key technical components, neighborhood intervention and dimension selection, in Sec. 3.3 and 3.4, respectively.
3.1 Motivation and Causal Inference
For link prediction, a confidence score should reflect the possibility of whether the predicted triple is the optimal choice in the prediction. We argue that a high confidence contains two meanings: i) significance: the optimal score should obviously outperform the others; and ii) robustness: a disturbance of the input data should not affect the prediction results.
The two confidence measurement methods mentioned in Sec. 2.2 aim to measure the significance from the output score sequence. However, they fail in the link prediction task because the patterns among different scores vary unstably in different sequences. Therefore, we focus on the second aspect, the robustness of score sequences. Inspired by the causality theory [Pearl and Mackenzie, 2018], rather than observing the association among different scores in the single sequence, our approach actively intervenes the scoring process by using multiple similar input vectors, and then judges the consistency of the output sequences.
To intervene in the scoring process, the causes affecting the generation of score sequences should be analyzed. Given a trained KGE model M and multiple e-r queries Q = {(ei, r)|ei ∈ E, r ∈ R} with the same relation r, we formulate the causalities in the KGE model with a Structural Causal Model (SCM) [Pearl, 2000]. As illustrated in Fig. 2(b), the entity vector e are the exogenous variables containing d dimensions, and each dimensional value as a variable takes part in the whole inference process. After the calculations inM, the transformed entity vector e′ are the endogenous variables of e and also the direct cause of the score sequence S. Note that, one variable in the transformed vector e′ is determined by not only that of the same dimension in e, but also the other dimensional variables.
Benefiting from the causal graph, we can pinpoint the roles of different parts in the KGE model. To intervene in the score sequence, we use the causal intervention: P(S|e, do(ei). This process modifies one of the dimensions in the input entity vector and so as to exclude the effect of this variable on the score sequence. For d-dimensional embeddings, we can generate d different neighborhood input vectors by modifying each dimensional variable, and formally we have:
It should be noted that we intervene the input vector e rather than the direct cause e′ , because before modifying an endogenous variable in e′ , its exogenous variable has also affected the other dimensions of e′ .
3.2 The NIC Framework
Inspired by the causal intervention process, we propose the new confidence measurement which aims to evaluate the robustness of score sequences. The NIC framework is illustrated in Fig. 2(c) and contains three main steps:
Step 1. Neighborhood Intervention. To achieve causal intervention, we first modify each dimensional values of the input entity vector e in turn and generate d different neighborhood vectors. Specifically, the neighborhood vectors Ne ∈ Rd×d is computed by:
where Id ∈ Rd×d is an identity matrix, and v(e) is a function that outputs an intervention value used to replace the original value in e. We utilize multiple kinds of intervention values for different entity vectors, which will be detailed in Sec. 3.3.
Step 2. Sequence Generation. In this step, we first gather the original score sequence by inputting the original entity vector e into the KGE model. As the size of entity set is huge, we extract the top K scores S and the corresponding entities {ei ∈ E|0 < i ⩽ K} from the sorted sequence. Then, using the narrowed entity set and the neighborhood vectors Ne (instead of e) as inputs, we can gather neighborhood score sequences SN = {SNi |0 < i ⩽ d} from the model. The relative ranking of the K candidate entities in each sequence, is denoted by ϱ(SNi ) = Argsort(SNi ), which contains the sorted candidate indexes in length K.
Step 3. Computing Consistency. The ranking ϱ(SNi ) of each neighborhood sequence is expected to be consistent with ϱ(S) of the original sequence, especially the part with higher scores. For this, we define the consistency value ς between the original sequence S and each SNi , i.e.,
where σ(·) and Sgn(·) refer to the Softmax function and the Sign function, respectively. The consistency value ς = 1 when the two sequences having the same candidate index in the top J positions. Otherwise, a mismatching at the higher position would cause a larger decrease to ς. Therefore, ς can indicates the robustness of prediction results before and after intervention. The hyperparamter J determines the number of candidates when measuring consistency, it is usually lower than K to ensure the candidate rankings having enough differentiation.
Finally, given the consistency value of each neighborhood sequence, the NIC score pnic is defined by:
The value domain of pnic(S) is [0, 1], such that it can be used to measure the confidence score in KGE models.
3.3 Neighborhood Intervention
In the first step of the NIC framework, the i-th neighborhood vector is generated by modifying the i-th dimensional value of the original entity vector. There are still issues on how to define the intervention value v to replace the original value. The most straightforward way is setting v = 0 for all entity vectors, such that the i-th dimension of the i-th neighborhood vector is equal to zero. However, we find that its performance is not ideal in our empirical studies.
Therefore, we further propose several intervention values by considering the statistical specificity of different entity vectors. Given the entity embedding vector e, there are four kinds of intervention values, including zero, mean, maximum, and minimum, i.e., {0, avg(e),max(e),min(e)}. There are more choices of intervention values, but we argue that the above four are representative. In Sec. 4, we will compare the effectiveness of different intervention values.
The intervention value cannot be selected randomly, because the NIC score should maintain uniqueness for the same input. In addition, as the first attempt of neighborhood intervention, this paper focuses on intervening one dimension in each neighborhood vector. It might be feasible to modify multiple values in the entity vector to generate more neighborhood vectors, which will be our future investigation.
3.4 Dimension Selection
We consider the computational complexity of NIC. Measuring the consistency by intervening each dimension costs much less than the original prediction, as long as setting a small value for the hyperparameter K. But the time complexity of NIC is still linearly dependent on the embedding dimension size d. Facing a high-dimensional KGE model (with more than 200 dimensions), NIC using all neighborhood vectors would cause high calculation cost.
Therefore, we design a dimension selection strategy to accelerate the NIC calculation. Based on a hypothesis that a dimension with lower variance hardly reflects the difference among entities, we measure the variance of each dimension. Then, we select a limited number of high-variance dimensions, which contribute more in the d-dimensional vector.
Specifically, given the entity embedding matrix E ∈ R|E|×d of a trained KGE model, Ei,j refers to the j-th dimension of the i-th entity and the weight wj of the j-th dimension is defined as:
Given the weight vector w = [w0,w1, . . . ,wd], we can maintain the top D dimensions with the highest weights and set others to zero. Normalized by a Softmax function, the processed vector can be utilized to adjust the contribution of different dimensions.
4 Experiments
4.1 Experimental Setup
Our experimental studies are conducted on two widely used datasets, WN18RR [Bordes et al., 2014] and FB15k237 [Toutanova and Chen, 2015]. The statistics of the datasets are given in Table 2. With Train, Valid, and Test, we refer to the number of triples in the training, validation and test sets.
| Dataset | |R| | |E| | #Train | #Valid | #Test |
|---|---|---|---|---|---|
| FB15k237 | 237 | 14, 541 | 272, 115 | 17, 535 | 20, 466 |
| WN18RR | 11 | 40, 943 | 86, 845 | 3, 034 | 3, 134 |
Ten KGE models (see Table 1) are trained by following their original settings with the binary cross-entropy loss. For the six high-dimensional KGE models, such as TransE and TuckER, we set their embedding dimensions as 200, while the four low-dimensional models' embedding dimension is 32. We select the hyper-parameters in the NIC framework via grid search. Specifically, we empirically select the number of remeasured entities K among {3, 5, 10, 100} and the position number J for computing sequence consistency among {1, 3, 5, 10}. All experiments are performed on Intel Core i77700K CPU @ 4.20GHz and NVIDIA GeForce GTX1080 Ti GPU, and implemented in Python using the PyTorch framework.
4.2 EvaluationMetrics
Considering ECE (Expected Calibration Error) [NiculescuMizil and Caruana, 2005] cannot adequately reflect the calibration effects in the link prediction task, we introduce three additional new evaluation metrics:
- CVar: the variance of confidence scores of all triples,
- T10%MRR: the average inverse rank of the top 10% high-confidence triples, and
- T10%ACC: the average accuracy (equal to Hits@1) of the top 10% high-confidence triples.
The CVar metric makes up for the drawback of ECE. The lower ECE and higher CVar jointly indicate that the confidence score can match the correctness probability better. T10%MRR and T10%ACC are designed for the demand of practical KG completion. Instead of manually screening the roughly-predicted triples, KG builders expect the highconfidence triples having high enough accuracy. Therefore, higher T10%MRR and T10%ACC scores indicate a better model performance for link prediction.
| FB15K237 | WN18RR | ||||||||||||||
|---|---|---|---|---|---|---|---|---|---|---|---|---|---|---|---|
| Methods | Dim | ECE↓ | T10%ACC↑ | ACC↑ | ECE↓ | T10%ACC↑ | ACC↑ | ||||||||
| SIG | TOP | NIC | SIG | TOP | NIC | SIG | TOP | NIC | SIG | TOP | NIC | ||||
| TransE DistMult ConvE RotatE | 200d | .078 .010 .011 .013 | .015 .007 .008 .007 .025 | .009 .009 .008 .006 .021 | .457 .758 .790 .805 .544 | .695 .813 .840 .842 .665 | .714 .842 .866 .870 .714 | .152 .202 .202 | .259 .074 | .003 | .003 .018 .016 .027 | .278 | .125 | .123 .968 | .012 |
| .022 | .528 | .715 | .720 | .372 | |||||||||||
| ComplEx | .055 | .019 | .737 | .956 | .395 | ||||||||||
| .237 | .011 | .011 | .013 | .591 | .486 | .620 | .400 | ||||||||
| .043 | .241 | .012 | .017 | .016 | .985 | .975 | .991 | .428 | |||||||
| TuckER | .015 | .006 | .008 | .854 | .863 | .888 | .266 | .031 | .028 | .700 | .601 | .827 | .443 | ||
| RotH RefH | 32d | .025 | .029 | .012 | .761 | .817 | .838 | .223 | .017 | .018 | .016 | .875 | .902 | .918 | .428 |
| .020 | .019 | .013 | .801 | .854 | .869 | .219 | .012 | .016 | .020 | .928 | .868 | .948 | .414 | ||
| TransH | .040 | .030 | .021 | .663 | .705 | .798 | .217 | .014 | .015 | .012 | .244 | .109 | .252 | .081 | |
| DistH | .035 | .027 | .021 | .662 | .697 | .703 | .202 | .021 | .015 | .012 | .704 | .760 | .796 | .399 | |
4.3 Experimental Results of the TenModels
We first verify our NIC performance compared with existing confidence measurement methods, SigmoidMax (SIG) and TopKSoftmax (TOP), utilizing ten different KGE models on two datasets. NIC by default uses the intervention value "maximum" and no dimension weights. Given a trained KGE model and test triples, three confidence measurement methods are utilized respectively and then calibrated by two calibration methods, Platt scaling and Isotonic regression. To the best of our knowledge, this is the most comprehensive experimental study for the calibration of the link prediction task. We analyze the results in details in the rest of this section.
Table 3 shows the ECE and T10%ACC results of the ten KGE models after calibrated by isotonic regression. In terms of the ECE metric, all three confidence measurement methods can achieve low ECE values after calibration. NIC surpasses the other two methods on most of models, especially the 32-dimensional models. Comparing T10%ACC and the original accuracy ACC, all three methods can help distinguish high-accuracy triples. Our NIC outperforms the other two methods and significantly improves by more than 30% in some of the KGE models. Besides, TuckER and RotatE
with 200 dimensions achieves the best ACC on two datasets, respectively. The RefH model outperforms the other lowdimensional models and achieves much higher T10%ACC.
In summary, fitting both low- and high-dimensional conditions, NIC can maintain the high-confidence triples having much higher accuracy. When only the most accurate triples are required in practical applications, we can use lowdimensional models with NIC measurements to achieve highefficient link prediction.
4.4 Detailed Comparison in the RotHModel
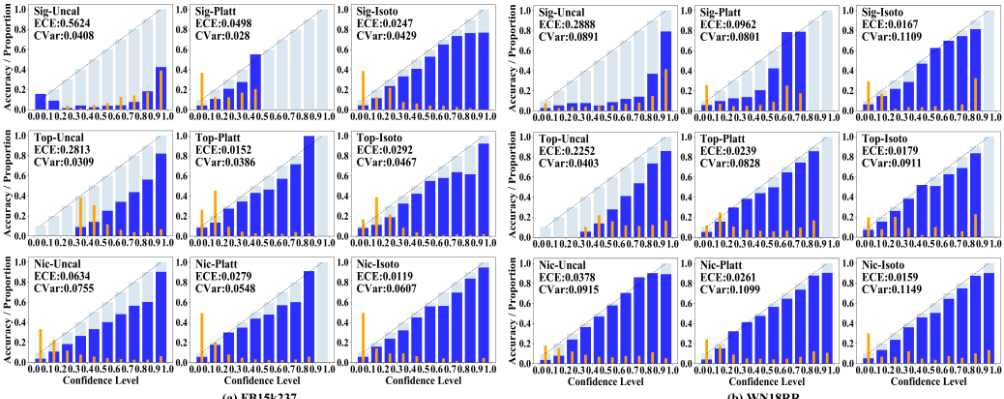
We then concentrate on the confidence calibration in a single model, to better compare three confidence measurement methods using two calibration methods. Following the previous work, reliability diagrams bin all predicted triples by confidence scores into ten equally-sized regions of [0,1]. To reflect the number distribution, we further add triple proportion (in marigold) to each confidence bin. The reliability diagrams for the RotH model using different confidence measurement methods before and after calibration are shown in Fig. 3. For other models, we observe the similar patterns.
The left three diagrams in each group illustrate the confidence distribution before calibration. On the two datasets, the average accuracy of SIG and TOP has obvious differences from the corresponding confidence level, while the accuracy of NIC is relatively close to the confidence level before calibration. It indicates that the conventional method used in other calibration tasks, is not suitable for confidence measurement in link prediction.
| FB15K237 | WN18RR | ||||||||
|---|---|---|---|---|---|---|---|---|---|
| Methods | Max | Min | Zero | Avg | Max | Min | Zero | Avg | |
| RotH | .063 | .065 | .130 | .131 | .038 | .039 | .057 | .058 | |
| ECE | RefH | .049 | .052 | .119 | .120 | .043 | .041 | .085 | .086 |
| TransH | .077 | .078 | .145 | .147 | .457 | .455 | .541 | .542 | |
| DistH | .095 | .087 | .181 | .182 | .086 | .085 | .133 | .133 | |
| RotH | .785 | .778 | .782 | .780 | .915 | .901 | .904 | .904 | |
| RefH | .830 | .840 | .844 | .846 | .943 | .935 | .951 | .951 | |
| TMRR | TransH | .740 | .727 | .735 | .718 | .026 | .030 | .029 | .029 |
| DistH | .642 | .657 | .646 | .646 | .804 | .799 | .788 | .788 | |
Comparing two calibration methods, Isotonic regression achieves lower ECE and higher CVar in most of experiments. After calibrated, the ECE scores of SIG and TOP significantly decrease but the confidence variances are relatively smaller than NIC's, especially on FB15k237. In contrast, NIC enables a precise alignment of confidence and accuracy after the calibration. Besides, NIC keeps a more divergent confidence distribution with the confidence variance more than 0.06 on FB15k237 and 0.11 on WN18RR.
4.5 Verification of Two Components
We deeply verify the effectiveness of two NIC components:
Neighborhood Intervention. We compare T10%MRR and ECE of NIC using four intervention values, i.e., zero, mean, maximum, and minimum. The results are shown in Table 4. For the four low-dimensional KGE models, using the maximum or minimum values achieve the best ECE in most models, and the zero and mean values perform slightly worse. Especially on FB15k237, their results are more than 50% lower than that of maximum and minimum. The similar trend can be found in the T10%MRR results, the maximum and minimum intervention precedes the others on RotH, TransH and DistH. The reason might be that the maximum and minimum values can provide better differentiation, while the others cannot change the original value significantly.
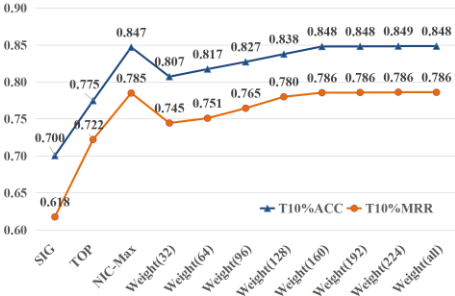
Dimension Selection. We select the RotH model with 256 dimensions to verify the effectiveness of dimension selection. Fig. 4 shows the T10%ACC and T10%MRR results on FB15K237. We can see that the T10%ACC of Weight(all) are slightly better than that of the original NIC (i.e., NIC-Max). As the improvement is not obvious, weighted summing is not needed when using all neighborhood vectors. However, the dimensional weight is valuable to reduce the number of neighborhood vectors for efficiency. When using only 32 neighborhood vectors, Weight(32) achieves slightly lower prediction accuracy than NIC-Max, but still outperforms significantly the other two methods (TopkSoftmax and Sigmoid- Max). With the increase of the dimensions, T10%ACC and T10%MRR gradually grow until reaching around 160 dimensions and then remain stable. It is feasible to select part of neighborhood vectors to take care of both accuracy and efficiency at the same time. Especially for the high-dimensional KGE models, the dimension selection strategy can significantly improve the computational efficiency of our proposed confidence measurement method.
5 Conclusion
Recent knowledge graph embedding (KGE) models can be rarely applied in the KG completion tasks in practice due to low prediction accuracy and unreliable confidence measurement. In this paper, we present a novel confidence measurement framework, namely Neighborhood Intervention Consistency (NIC). Based on the causal intervention, NIC actively intervenes the input entity vector to measure the prediction robustness. The experimental results show that our NIC method can effectively estimate the prediction accuracy while keeping an acceptable variance. Furthermore, NIC achieves 30% higher accuracy for the top 10% highestconfidence triples in the state-of-the-art KGE models. In the future, we will further improve our method by intervening multiple dimensions in one neighborhood vector, and by taking both statistical significance and prediction robustness into the consideration.
Acknowledgments
This research is supported by the National Natural Science Foundation in China (Grant: 61672128) and the Fundamental Research Fund for Central University (Grant: DUT20TD107). Quan Z. Sheng has been partially supported by Australian Research Council (ARC) Future Fellowship Grant FT140101247, and Discovery Project Grant DP200102298.
@inproceedings{ijcai2021p288,
  title     = {Neighborhood Intervention Consistency: Measuring Confidence for Knowledge Graph Link Prediction},
  author    = {Wang, Kai and Liu, Yu and Sheng, Quan Z.},
  booktitle = {Proceedings of the Thirtieth International Joint Conference on
               Artificial Intelligence, {IJCAI-21}},
  publisher = {International Joint Conferences on Artificial Intelligence Organization},
  editor    = {Zhi-Hua Zhou},
  pages     = {2090--2096},
  year      = {2021},
  month     = {8},
  note      = {Main Track},
  doi       = {10.24963/ijcai.2021/288},
  url       = {https://doi.org/10.24963/ijcai.2021/288},
}
TY - CPAPER TI - Neighborhood Intervention Consistency: Measuring Confidence for Knowledge Graph Link Prediction AU - Wang, Kai AU - Liu, Yu AU - Sheng, Quan Z. T2 - Proceedings of the Thirtieth International Joint Conference on Artificial Intelligence, IJCAI-21 PB - International Joint Conferences on Artificial Intelligence Organization PY - 2021 SP - 2090 EP - 2096 DO - 10.24963/ijcai.2021/288 UR - https://doi.org/10.24963/ijcai.2021/288 ER -Copied
Machine-readable versions of this paper, for tools and AI agents:





