
Forecasting Avian Migration Patterns using a Deep Bidirectional RNN Augmented with an Auxiliary Task
Proceedings of the Twenty-Ninth International Joint Conference on Artificial Intelligence. Special track on AI for CompSust and Human well-being. Pages 4382-4388.
https://doi.org/10.24963/ijcai.2020/604
Keywords
- Multidisciplinary Topics and Applications: AI for Life Science
- Machine Learning: Classification
- Machine Learning: Deep Learning: Sequence Modeling
- Data Mining: Mining Spatial, Temporal Data
Abstract
Early forecasting of bird migration patterns has important application for example in reducing avian biodiversity loss. An estimated 100 million to 1 billion birds are known to die yearly during migration due to fatal collisions with human made infrastructures such as buildings, high tension lines, wind turbines and aircrafts thus raising a huge concern for conservationists. Building models that can forecast accurate migration patterns is therefore important to enable the optimal management of these critical infrastructures with the sole aim of reducing biodiversity loss. While previous works have largely focused on the task of forecasting migration intensities and the onset of just one migration state, predicting several migration states at even finer granularity is more useful towards optimally managing the infrastructures that causes these deaths. In this work, we consider the task of forecasting migration patterns of the popular Turkey Vulture (Cathartes aura) collected with the aid of satellite telemetry for multiple years at a resolution of one hour. We use a deep Bidirectional-GRU recurrent neural network augmented with an auxiliary task where the state information of one layer is used to initialise the other. Empirical results on a variety of experiments with our approach show we can accurately forecast migration up to one week in advance performing better than a variety of baselines.
- [Berthold, 2001] Peter Berthold. Bird migration: a general survey. Oxford University Press on Demand, 2001.
- [Bildstein et al., 2016] Keith L Bildstein, David Barber, Marc J Bechard, and Maricel Grana Grilli. Data from: Wing size but not wing shape is related to migratory be- havior in a soaring bird. 2016.
- [Cao et al., 2018] Wei Cao, Dong Wang, Jian Li, Hao Zhou, Lei Li, and Yitan Li. Brits: bidirectional recurrent impu- tation for time series. In Advances in Neural Information Processing Systems, pages 6775-6785, 2018.
- [Cho et al., 2014] Kyunghyun Cho, Bart Van Merriënboer, Caglar Gulcehre, Dzmitry Bahdanau, Fethi Bougares, Holger Schwenk, and Yoshua Bengio. Learning phrase representations using rnn encoder-decoder for statistical machine translation. arXiv preprint arXiv:1406.1078, 2014.
- [Dodge et al., 2013] Somayeh Dodge, Gil Bohrer, Rolf Weinzierl, Sarah C Davidson, Roland Kays, David Dou- glas, Sebastian Cruz, Jiawei Han, David Brandes, and Martin Wikelski. The environmental-data automated track annotation (env-data) system: linking animal tracks with environmental data. Movement Ecology, 1(1):3, 2013.
- [Dodge et al., 2014] Somayeh Dodge, Gil Bohrer, Keith Bildstein, Sarah C Davidson, Rolf Weinzierl, Marc J Bechard, David Barber, Roland Kays, David Brandes, Jiawei Han, et al. Environmental drivers of variability in the movement ecology of turkey vultures (cathartes aura) in north and south america. Philosophical Trans- actions of the Royal Society B: Biological Sciences, 369(1643):20130195, 2014.
- [Ford et al., 1979] Hugh A Ford, David C Paton, and Neville Forde. Birds as pollinators of australian plants. New Zealand journal of botany, 17(4):509-519, 1979.
- [Gao et al., 2017] Weihao Gao, Sreeram Kannan, Sewoong Oh, and Pramod Viswanath. Estimating mutual infor- mation for discrete-continuous mixtures. In Advances in neural information processing systems, pages 5986-5997, 2017.
- [Grilli et al., 2017] Maricel Graña Grilli, Sergio A Lamber- tucci, Jean-Franc ¸ois Therrien, and Keith L Bildstein. Wing size but not wing shape is related to migratory behavior in a soaring bird. Journal of avian biology, 48(5):669-678, 2017.
- [Horton et al., 2019] Kyle G Horton, Frank A La Sorte, Daniel Sheldon, Tsung-Yu Lin, Kevin Winner, Garrett Bernstein, Subhransu Maji, Wesley M Hochachka, and Andrew Farnsworth. Phenology of nocturnal avian migra- tion has shifted at the continental scale. Nature Climate Change, pages 1-6, 2019.
- [Howard et al., 2018] Christine Howard, Philip A Stephens, Joseph A Tobias, Catherine Sheard, Stuart HM Butchart, and Stephen G Willis. Flight range, fuel load and the im- pact of climate change on the journeys of migrant birds. Proceedings of the Royal Society B: Biological Sciences, 285(1873):20172329, 2018.
- [Loss et al., 2014a] Scott R Loss, Tom Will, Sara S Loss, and Peter P Marra. Bird-building collisions in the united states: Estimates of annual mortality and species vulnera- bility. The Condor, 116(1):8-23, 2014.
- [Loss et al., 2014b] Scott R Loss, Tom Will, and Peter P Marra. Refining estimates of bird collision and electro- cution mortality at power lines in the united states. PLoS One, 9(7):e101565, 2014.
- [Railsback and Johnson, 2014] Steven F Railsback and Matthew D Johnson. Effects of land use on bird pop- ulations and pest control services on coffee farms. Proceedings of the National Academy of Sciences, 111(16):6109-6114, 2014.
- [Richardson, 1978] W John Richardson. Timing and amount of bird migration in relation to weather: a review. Oikos, pages 224-272, 1978.
- [Rosenberg et al., 2019] Kenneth V Rosenberg, Adriaan M Dokter, Peter J Blancher, John R Sauer, Adam C Smith, Paul A Smith, Jessica C Stanton, Arvind Panjabi, Laura Helft, Michael Parr, et al. Decline of the north american avifauna. Science, 366(6461):120-124, 2019.
- [Rozsa, 1997] Lajos Rozsa. Patterns in the abundance of avian lice (phthiraptera: Amblycera, ischnocera). Journal of Avian Biology, pages 249-254, 1997.
- [Schuster and Paliwal, 1997] Mike Schuster and Kuldip K Paliwal. Bidirectional recurrent neural networks. IEEE Transactions on Signal Processing, 45(11):2673-2681, 1997.
- [S ¸ekercioglu et al., 2004] C ¸agan H S ¸ekercioglu, Gretchen C Daily, and Paul R Ehrlich. Ecosystem consequences of bird declines. Proceedings of the National Academy of Sciences, 101(52):18042-18047, 2004.
- [Tomašev et al., 2019] Nenad Tomašev, Xavier Glorot, Jack W Rae, Michal Zielinski, Harry Askham, Andre Saraiva, Anne Mottram, Clemens Meyer, Suman Ravuri, Ivan Protsyuk, et al. A clinically applicable approach to continuous prediction of future acute kidney injury. Nature, 572(7767):116-119, 2019.
- [Trancart et al., 2013] T Trancart, A Acou, E De Oliveira, and E Feunteun. Forecasting animal migration using sari- max: an efficient means of reducing silver eel mortal- ity caused by turbines. Endangered Species Research, 21(2):181-190, 2013.
- G. A. United Nations. Transforming our world: the 2030 agenda for sustainable development. New York: United Nations, 2015.
- [Van Belle et al., 2007] J Van Belle, J Shamoun-Baranes, E Van Loon, and W Bouten. An operational model pre- dicting autumn bird migration intensities for flight safety. Journal of applied ecology, 44(4):864-874, 2007.
- [Van Doren and Horton, 2018] Benjamin M Van Doren and Kyle G Horton. A continental system for forecasting bird migration. Science, 361(6407):1115-1118, 2018.
References were extracted automatically from the PDF and may contain errors.
Full text extracted automatically from the PDF; figures, tables and equations may differ. The PDF is the version of record.
1 Introduction
Reducing biodiversity loss is fundamental towards achieving the 2030 agenda of the United Nations sustainable development goals [United Nations, 2015]. With 6% of avian life functionally extinct and 21% currently threatened [S¸ekercio˘glu et al., 2004], biodiversity loss with respect to global avifauna deserves serious attention [Rosenberg et al., 2019]. The importance of birds in nature's ecosystem cannot be overemphasized. Birds have important and multiple roles to play in the ecosystem as they serve as pollinators by processing and transporting plant seed from one geographical area to another [Ford et al., 1979], help control the population of insects [Railsback and Johnson, 2014] towards improving agricultural yield, play host to many host-specific parasites such as lice [Rozsa, 1997] as well as supply eggs as food to humans. However, an estimated 100 million to 1 billion birds are known to die annually during migration via collisions [Loss et al., 2014a; Loss et al., 2014b] with human made critical infrastructures such as wind turbines, buildings and high tension lines. These collisions can sometimes be due to partial blindness caused by excessive lights at night on several of these infrastructures or the inability to see these infrastructures when flying at night leading to high impact collisions. Optimal management of these infrastructures is therefore key towards reducing their negative impact on avian biodiversity loss across the world. These optimal management scheme for example can be an intelligent model that can switch off these infrastructures or reduce the intensity of light on buildings temporarily in advance given the likelihood of some migration states.
While previous works [Van Doren and Horton, 2018] and [Van Belle et al., 2007] have focused on forecasting the intensity of spring migration and autumn migration respectively, we state here that the onset and the end of these migration states are of utmost importance towards ensuring a concerted approach to reducing biodiversity loss for example when animals migrate between continents. In addition, we argue that forecasting the intensity of migration cannot be guaranteed to be optimal for managing critical infrastructures as different species of birds potentially have different migration dates along different routes. Rather, we argue for an independent model for each migrating avian specie most importantly the threatened species to handle the specific nuances associated with their migration patterns. To this end, we consider a much more difficult task of forecasting different avian migration states at a finer granularity and to be specific on an hourly basis.
In this work, we consider the task of predicting the onset and end of several migration states in birds. More specifically, we use publicly available datasets of Turkey Vulture (Cathartes aura) movement collected over multiple years at a resolution of one hour. We train a deep learning network consisting of Bidirectional-RNNs by casting the prediction problem as a supervised learning task with a cross entropy loss where we aim to forecast the onset of four movement states corresponding to breeding, fall migration, non-breeding and spring migration. We augment the network by adding an auxiliary task to help stabilize training and improve generalization by forecasting the longitude. Experimental results of forecasting at different temporal intervals in advance show we can achieve significant accuracy even when forecasting up to one week in advance. We compare our approach to a variety of baselines and empirically show that our approach outperforms them on a variety of experiments.
2 RelatedWork
The idea of forecasting animal migration has received relatively little attention until recently. Due to the proliferation of low cost sensors and advancement in telemetry technology, useful datasets of animal migration are becoming increasingly publicly available to enable animal behaviour researchers use a data driven approach towards answering important biological questions regarding animal migration. In this section, we discuss previous attempts similar to this work.
To mitigate the mortality of aquatic animals to be specific European eels (Anguilla anguilla) due to their collision with hydroelectric power plants, [Trancart et al., 2013] proposed a seasonal autoregressive integrated moving average to forecast their migration in advance using datasets of silver eel migration from two fishing sites in north-western France. The idea in this work was to minimize mortality by shutting down turbines. However, to minimize down time as much as possible and by extension losses to hydropower producers, they argued it is imperative to be able to precisely forecast the peak migration times of these animals. Our work differs in that while their aim was to minimize mortality as much as possible by switching off turbines at peak migration times using some threshold of the migration intensities, we are interested in predicting the onset of different migration states that span two continents. In addition, while it is not clear how environmental factors affect the migration of aquatic animals, avian migration states are known to be severely affected [Howard et al., 2018] making our task even more difficult.
Recently, [Van Doren and Horton, 2018] built a predictive model of spring migration intensity of birds in North America using radar and weather data with the aid of XGboost. In a similar vein, [Van Belle et al., 2007] used radar measurements of bird densities in the Netherlands to predict their migration intensities for applications in improved flight safety. Compared to these two works which considered one migration state and formulated there prediction problem as a regression task, we consider multiple fine grain migration states across two continents and formulate our prediction problem as a classification task which is more optimal for managing critical infrastructures. We also investigate new environmental and weather variables to know which are most influential with respect to the migration states using mutual information.
Even more recently, evidence for phenological shift due to climate change was provided by [Horton et al., 2019] using 24 years of archived radar data in North America. Their results revealed advancement in peak spring migration by 0.6 days per decade with effect highly correlated with latitudes. While it is unclear from their analyses where and when some of these changes did occur as well as how it varies across species, tracking bird movement at a finer scale as per the data used in this work has the potential to shed more light on some of these issues. Similarly, the relationships between short term weather conditions to daily migration intensities of different bird species was examined by [Richardson, 1978]. Their analysis revealed different populations and species respond to weather conditions in varying ways while a maximum number migrate when the average weather condition is fair.
Overall, previous works have largely focused on forecasting migration intensities across a huge taxa in most cases birds due to their penchant for mobility during adverse weather conditions. Analysing long-term migration patterns at a more fine grain scale will be key towards shedding more light on some of the problems associated with approaches discussed above. We focus only on the Turkey Vulture in this work and give a brief overview of this bird in the next section.
3 The Turkey Vulture
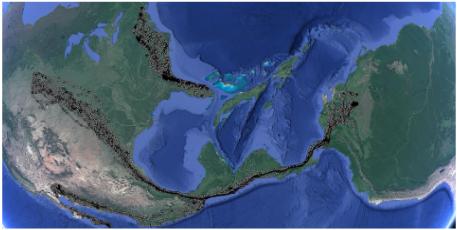
The Turkey Vulture (Cathartes aura) represents the most widely distributed scavenger in the world with global population in excess of five million spread across the two America continents and the west indies [Dodge et al., 2014]. Gregarious in nature, it has been regarded as a partial migrant [Berthold, 2001] as some population winter in North America while others move as far as South America during the winter months while returning to breed during spring. The latter population is considered in this work. Breeding including incubation responsibilities is usually carried out by both parents spanning late spring to early winter months. They are primarily scavengers with a good sense of smell to look for carcasses. By eating carcasses, they help make the environment cleaner and prevent the spread of diseases. Its main predators are owls, hawks and eagles with its eggs serving as food for raccoons and opossums. While the population of these birds is stable and they are not endangered, the approach proposed in this work can be extended to the endangered avian species given the relevant migration data.
4 ProblemFormulation &Model
4.1 Problem
Given a time series {X≤t, ymt}Tt=n where X≤t ∈ Rd and
ymt is a multi-dimensional vector representing input features
(X≤t = Xt-d, ....,Xt, d is the duration of the temporal con-
text relevant for the prediction task) and discrete migration
states respectively at each time-step t where m ≥ 2, the goal
t=n where k is the
is to estimate {ym(t+k)}Tt=n given {X≤t}T-k
temporal period in advance with respect to the migration state
we are interested in forecasting.
4.2 Model
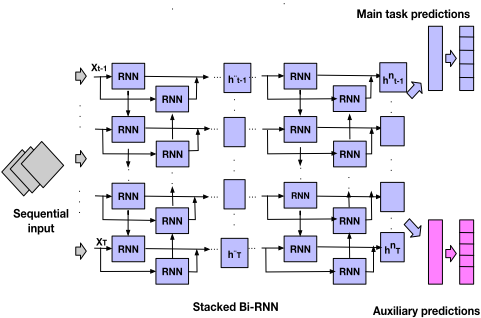
Stacked Bidirectional GRU (Bi-GRU). The gated recur-
rent unit (GRU) [Cho et al., 2014] network is a variant of the
recurrent neural network (RNN) that learns to integrate tem-
poral information over sequential data using a combination of
gates. Its advantage over the conventional RNN is its ability
to overcome the vanishing gradient problem. However, the
GRU only integrate information from one end of the data to
another. To add better context to a RNN, the Bidirectional
RNN [Schuster and Paliwal, 1997] was proposed. The Bi-
GRU thus, is a version of the Bidirectional RNN using the
GRU and works by training two GRUs where one is trained
reversed copy of this sequence ←-
on the forward hidden input sequence -→h and the other on the
h using two hidden layers to
compute the output sequence yt. Given that the GRU equa-
tions in [Cho et al., 2014] can be implemented by the function
G, the Bi-GRU can then be implemented via:
-→ht = G(-→h t-1, xt), ←-
yt = W-→h ht = G(←-
-→ht +W←-
h
←-
ht + b
This approach has been demonstrated to yield better re-
sults. For example it was used previously to fill in missing
values [Cao et al., 2018] and hence our choice in this regards
given geolocation data almost always have this characteris-
tics. With stacked Bi-GRU, the expressiveness of the Bi-GRU
is improved. Given N layers of the Bi-GRU, the hidden and
output sequences are updated as follows:
-→ht n = G(-→h nt-1 , -→h n-1
yt = W-→h t ), ←-
-→ht n + W←-
h
←-
ht ht n = G(←n + b
Auxiliary Tasks and Training Objectives. To help im-
prove training, ensure stable learning dynamics, as well as
learn robust representation that generalises to test data, auxil-
iary tasks have been used to provide even more denser train-
ing signals to support the main task. Given all the input features are continuous, we therefore augment the network loss with the mean square error (MSE) loss (single task) where we aim to forecast the longitude coordinate which is the most informative feature relevant to the main task (see section 7). At training time, we seek the the parameters θ1 and θ2 that minimizes the cross entropy loss (first term of equation 3) for forecasting the migration state and the MSE loss (second term of equation 3) for forecasting the longitude coordinates
h n-1
h nt+1 , ←t )
(2)
h t+1, xt)
(1)
.
.
Figure 2: Architecture of the proposed framework.
respectively. The overall training objective therefore is given by:
Where Xi, ymi and yli represents the input features, migration states and longitude coordinates respectively.
5 Datasets
Turkey Vulture movement datasets [Grilli et al., 2017] and [Bildstein et al., 2016] as part of an ongoing study were collected with the aid of GPS satellite transmitters. A significant portion of the data were collected at the resolution of one hour each while others at three hours. We discard the ones collected at three hours so as to be able to work at a more fine grained resolution with more data-points.
5.1 Migration States
There are four movement states in the datasets, see [Bildstein et al., 2016] for more information. In this work, we seek the onset of these states which are described in detail below. Here, onset is regarded as the first recorded instance of a migration or movement state. (1) End of spring migration / Onset of breeding. Period after spring migration when breeding starts. During breeding, birds mate, give birth and raise fledglings in preparation for fall migration. This is usually between March and April every year. (2) End of breeding / Onset of fall migration. Start of migration to the wintering ground usually in South America. This is usually between September and October every year. (3) End of fall migration / Onset of wintering. Arrival to the wintering ground in South America which heralds the start of the wintering season. This is usually around October each year. (4) End of wintering / Onset of spring migration. Start of migration back to North America when the weather must have improved enough for breeding to start. This is usually between March and April every year.
5.2 Environmental &Weather Data
The movement tracks were annotated with environmental data with the aid of the Env-DATA Track Annotation Service [Dodge et al., 2013]. Twenty-six features were collected and include population density, atmospheric water, downward ultraviolet radiation at the surface, plant canopy surface water at surface, incident solar radiation, elevation, dew point temperature, snow evaporation, water vapour concentration, snow albedo, temperature parameter in canopy conductance at surface, surface solar radiation downwards, albedo, soil temperature, surface solar radiation, maximum temperature, evaporation, ice temperature, land surface temperature night, land surface temperature day, snow temperature, surface thermal radiation, ten metre wind gust, sunshine duration, surface thermal radiation downwards and soil water content.
5.3 Data Preprocessing
We obtain the trajectories of three birds out of all the birds in the datasets corresponding to the ones with fewest missing data (Mac, Rosalie & Morongo) to determine the most relevant features to the migration states. We use the biggest of these three (Rosalie) for the actual forecasting experiments. All missing data in the environmental & weather data were replaced with the last observed points in the sequence. The bird used for the forecasting experiments has four years of movement trajectories collected with size 28613. We divide this trajectory into 75% (3 years) for training and the rest (1 year) for testing.
6 Experiments &Procedures
We use 3 layers of Bi-GRU as described in section 4.2 with a dropout layer for the main task. Given the size of the dataset, we train the network over 20 epochs three times with early stopping after two epochs without improvement in the loss. The epoch with the least loss across the three iterations is used. We evaluate all models using accuracy and F1 scores.
6.1 Thresholding
Predictions of machine learning models can only be reliable when the accuracy is perfect. Given the nature of real world data, it is unlikely any model would work perfectly thus rendering these models unusable for real world applications. Calibration methods such as platt scaling and isotonic regression are useful in reducing this problem. However, in this case they are ineffective for two reasons. First, [Tomaˇsev et al., 2019] argued that deep learning models with softmax output trained with cross-entropy loss are prone to errors. Second, the distribution of the training data is hardly the same as test data due to several factors affecting the migration states. While the obvious approach after calibrating is
| Data | Breeding | Fall M. | Wintering | Spring M. |
|---|---|---|---|---|
| Training | 0.5046 | 0.0495 | 0.3795 | 0.0664 |
| Test | 0.5123 | 0.0625 | 0.3639 | 0.0614 |
Algorithm 1 Calibration approach
- 1: Input: Training dataset (X≤t, ymt) 2: Output: thr 3: Pr(ymt|X≤t) ←equation 3 4: thl←Sequence of threshold th of length l (first instance) 5: for each unique m in ymt: 6: for each year in (ymt): 7: thr{m} ← thr{m} + (tonset of m(ground tr.) - tthl ) 8: end 9: thr{m}← thr{m} / No of years in (X≤t, ymt) 10: end 11: return thr
to select a threshold of the class probability scores given the ROC curve, the prediction around the boundary surrounding the transition from one state to another can be problematic. To get around this problem, we instead propose an algorithm that is model dependent and leverages a sequence of thresholds to predict the migration states. The intuition behind the algorithm is that we decide migration has started or ended if there is a continuous sequence of a threshold value of the probability scores given the migration state of interest. The temporal difference between the end of the first instance of this sequence and the ground truth averaged over the number of years for each migration state in the training data is then used in the test data probability distribution to predict the migration states. We use a probability threshold score th = 0.71 and sequence length l of 24 in this work.
6.2 Baselines
We compare our approach to several baselines including deep and non deep learning methods.
Logistic regression (LR), Adaboost (AB) & Support Vector Machine (SVM). We use a multinomial variant with a lbfgs solver for logistic regression and one versus one strategy for SVM.
Deep Neural Network (DNN). With two layers and 256 neurons each, dropout = 0.2, softmax layer and adam opimizer. Recurrent Neural Network (GRU). A GRU network with 1 layer, 50 cells, dropout = 0.2, softmax layer and adam optimizer. We train the neural networks given the procedures described for our approach above.
6.3 Experiments
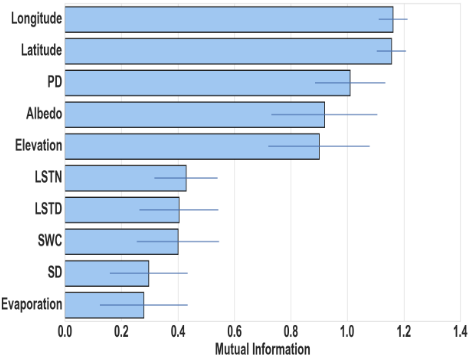
We design several experiments described in detail below to answer several important questions bordering on migration with respect to this avian specie given the dataset we possess. Q1. What environmental and movement factors are most indicative of migration patterns? To answer this, we quantify the mutual information between the continuous environmental and movement features and discrete migration states using
- the approach proposed in [Gao et al., 2017].
Q2. Can we forecast migration in advance at different temporal intervals and how does our approach compare to a variety of baselines? Also, to what extent does our prediction deviate from the ground truth with respect to the migration states described in section 5.1? To answer Q2, we design series of experiments where we aim to forecast the migration states one day, three and seven days in advance given our approach. Q3. How is the forecasting accuracy affected when there is a significant difference in the migration dates encountered in the training set compared to the test set? To answer this, we query the date of the onset of all the migration states described in section 5 in the training and test dataset.
Q4. Finally we aim to ask, is migration restricted to specific period of the day? To answer this, we query the time of all the migration states described above in the test and training datasets.
7 Results &Discussion
We discuss the results and answer to several questions asked in section 6.3 in the order listed here.
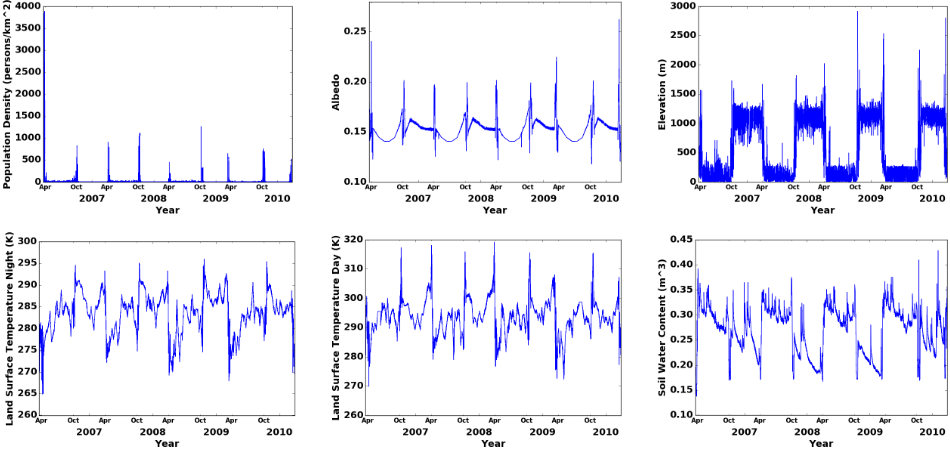
A1. We plot the results of the experiment described in Q1 in Figures 3 & 4. The top six most relevant features shows that apart from the movement coordinates, population density, albedo, elevation, temperature and soil water content represents the greatest indicators of different migration states in this bird. This is a result consistent with previous study [Van Doren and Horton, 2018]. We also observe from the time-series plots that the onset of fall and spring migration is preceded by a continuous drop in temperature and soil water content in both continents. Furthermore, we notice the bird winter and breed away from areas where human population density is low. This has huge implications, as previous wintering and breeding grounds are lost to human development activities, the start of the corresponding migration states can be affected as the birds seek new grounds for these activities. In addition, the elevation of flight can be seen to be low during breeding as the birds focus on production of offspring with abundant resources, and high during wintering as they move from one place to another in search of carrions and warmer climes. Also worthy of mentioning is the albedo, a measure of light reflected from the surface of the earth. It decreases and then increases prior to autumn migration and vice versa prior to spring migration. This is a pattern in alignment with change in activities by human as well as all fauna and flora. There is high albedo for example when temperature drops due to inactivity and low albedo as the temperature improves.
A2. Results in Table 2 show our approach can be seen to outperform a variety of baselines demonstrating its effectiveness in adding more context via the backward and forward integration of information. Our approach also outperform the baselines on the prediction of the underrepresented states. In addition, results in Table 4 also show we can forecast with decent precision at different intervals of one day, three days and seven days in advance. Furthermore, ablation studies show that adding several layers of the Bi-GRU in addition to the auxiliary task helps improve result.
- A3. Results in Tables 2,3,4 show our approach perform well even when the difference is large, see for example when the onset of breeding was delayed significantly in the test data.
A4. Results in Table 3 show that migration can start or end between very late in the day till very early in the morning. While some literatures have argued this is a strategy by birds to avoid predators, it is not clear whether this applies to Turkey Vulture whose predator include owls that are mainly nocturnal. Practical interventions can therefore be implemented around this period to ensure minimal infrastructure downtime.
8 Conclusion
We have proposed a deep Bi-RNN network augmented with an auxiliary task towards forecasting migration patterns in Turkey Vulture. Our approach yields result better than a variety of baselines. The implication of this work transcend reducing avian biodiversity loss. As the largest number of bird strikes occur during spring and fall migration, optimally scheduling flights during this period is a benefit our work offers which can help prevent accident. While the prediction of fine grain avian migration patterns is a challenging task due to variability in environmental factors as a result of habitat loss, lack of access to endogenous factors coupled with the limited size of dataset that we have used, our approach may be useful towards reducing avian biodiversity loss by optimally managing the infrastructures leading to these deaths within a reasonable time window. Investigating in more detail in the future the contribution of each environmental factor and additional ones will be key towards accounting for the uncertainty produced by climate change and human development. Our thresholding algorithm though model specific, can benefit from more fine-tuning and we leave that as future work.
| No of days in advance | Performance Metric | Models | |||||||
|---|---|---|---|---|---|---|---|---|---|
| LR | AB | SVM | DNN | GRU (1-L) | Bi-GRU (1-L) | Bi-GRU (3-L) | Bi-GRU (3-L, A. task) | ||
| 1 | Acc.(%) F1 scores | 74.83 (0,0.25) | 93.01 (0.04,0.65) | 51.14 (0,0) | 45.14 (0,0) | 82.73 (0,0) | 87.01 (0.12,0.13) | 93.45 (0.77,0.63) | 94.75 (0.87,0.62) |
| 3 | Acc.(%) F1 scores | 74.32 (0,0.24) | 55.39 (0.03,0.16) | 51.18 (0,0) | 47.11 (0,0) | 82 (0,0) | 87.52 (0.01,0.61) | 93.79 (0.77,0.58) | 94.88 (0.9,0.61) |
| 7 | Acc.(%) F1 scores | 68.46 (0,0.09) | 59.73 (0.36,0.19) | 51.38 (0,0) | 50.61 (0,0) | 82.73 (0.16,0.1) | 86.28 (0.08,0.20) | 93.69 (0.85,0.61) | 94.26 (0.84,0.67) |
| Year | Onset of Breeding | Onset of Fall migration | Onset of Wintering | Onset of Spring migration | |
|---|---|---|---|---|---|
| Train | 2006/2007 | 11/04, 03:00 | 28/09, 21:00 | 15/10, 04:00 | 30/03, 20:00 |
| 2007/2008 | 12/04, 02:00 | 01/10, 01:00 | 18/10, 20:00 | 26/03, 16:00 | |
| 2008/2009 | 12/04, 21:00 | 08/10, 19:00 | 26/10, 00:00 | 06/03, 02:00 | |
| Test | 2009/2010 | 30/03, 02:00 | 03/10, 18:00 | 25/10, 00:00 | 11/03, 18:00 |
| Onset of | ||||
|---|---|---|---|---|
| Breeding | Fall M. | Wintering | Spring M. | |
| 1 day in advance | A,24 | L,20 | A,24 | L,7 |
| 3 days in advance | A,46 | L,20 | A,12 | L,35 |
| 7 days in advance | A,40 | A,82 | L,12 | L,101 |
Acknowledgements
This research is supported by the Petroleum Technology Development Fund of Nigeria.
@inproceedings{ijcai2020p604,
  title     = {Forecasting Avian Migration Patterns using a Deep Bidirectional RNN Augmented with an Auxiliary Task},
  author    = {Owoeye, Kehinde},
  booktitle = {Proceedings of the Twenty-Ninth International Joint Conference on
               Artificial Intelligence, {IJCAI-20}},
  publisher = {International Joint Conferences on Artificial Intelligence Organization},
  editor    = {Christian Bessiere},
  pages     = {4382--4388},
  year      = {2020},
  month     = {7},
  note      = {Special track on AI for CompSust and Human well-being},
  doi       = {10.24963/ijcai.2020/604},
  url       = {https://doi.org/10.24963/ijcai.2020/604},
}
TY - CPAPER TI - Forecasting Avian Migration Patterns using a Deep Bidirectional RNN Augmented with an Auxiliary Task AU - Owoeye, Kehinde T2 - Proceedings of the Twenty-Ninth International Joint Conference on Artificial Intelligence, IJCAI-20 PB - International Joint Conferences on Artificial Intelligence Organization PY - 2020 SP - 4382 EP - 4388 DO - 10.24963/ijcai.2020/604 UR - https://doi.org/10.24963/ijcai.2020/604 ER -Copied
Machine-readable versions of this paper, for tools and AI agents:





