
A Novel Spatio-Temporal Multi-Task Approach for the Prediction of Diabetes-Related Complication: a Cardiopathy Case of Study
Proceedings of the Twenty-Ninth International Joint Conference on Artificial Intelligence. Special track on AI for CompSust and Human well-being. Pages 4299-4305.
https://doi.org/10.24963/ijcai.2020/593
Keywords
- Machine Learning: Classification
- Machine Learning: Transfer, Adaptation, Multi-task Learning
- Machine Learning Applications: Bio/Medicine
- Machine Learning Applications: Applications of Supervised Learning
Abstract
The prediction of the risk profile related to the cardiopathy complication is a core research task that could support clinical decision making. However, the design and implementation of a clinical decision support system based on Electronic Health Record (EHR) temporal data comprise of several challenges. Several single task learning approaches consider the prediction of the risk profile related to a specific diabetes complication (i.e., cardiopathy) independent from other complications. Accordingly, the state-of-the-art multi-task learning (MTL) model encapsulates only the temporal relatedness among the EHR data. However, this assumption might be restricted in the clinical scenario where both spatio-temporal constraints should be taken into account. The aim of this study is the proposal of two different MTL procedures, called spatio-temporal lasso (STL-MTL) and spatio-temporal group lasso (STGL-MTL), which encode the spatio-temporal relatedness using a regularization term and a graph-based approach (i.e., encoding the task relatedness using the structure matrix). Experimental results on a real-world EHR dataset demonstrate the robust performance and the interpretability of the proposed approach.
- [Anderson et al., 2016] Ariana E. Anderson, Wesley T. Kerr, April Thames, Tong Li, Jiayang Xiao, and Mark S. Cohen. Electronic health record phenotyping improves detection and screening of type 2 diabetes in the general united states population: A cross-sectional, unselected, retrospective study. J. Biomed. Inform., 60:162 -168, 2016.
- [Argyriou et al., 2007] Andreas Argyriou, Theodoros Evge- niou, and Massimiliano Pontil. Multi-task feature learn- ing. In Advances in neural information processing sys- tems, pages 41-48, 2007.
- [Bernardini et al., 2019] M. Bernardini, L. Romeo, P. Mis- ericordia, and E. Frontoni. Discovering the type 2 dia- betes in electronic health records using the sparse balanced support vector machine. IEEE Journal of Biomedical and Health Informatics, pages 1-1, 2019.
- [Bickel et al., 2008] Steffen Bickel, Jasmina Bogojeska, Thomas Lengauer, and Tobias Scheffer. Multi-task learn- ing for hiv therapy screening. In Proceedings of the 25th international conference on Machine learning, pages 56- 63. ACM, 2008.
- [Cawley and Talbot, 2010] Gavin C Cawley and Nicola LC Talbot. On over-fitting in model selection and subsequent selection bias in performance evaluation. Journal of Ma- chine Learning Research, 11(Jul):2079-2107, 2010.
- [Chawla et al., 2002] Nitesh V Chawla, Kevin W Bowyer, Lawrence O Hall, and W Philip Kegelmeyer. SMOTE: synthetic minority over-sampling technique. Journal of Artificial Intelligence Research, 16:321-357, 2002.
- [Evgeniou and Pontil, 2004] Theodoros Evgeniou and Mas- similiano Pontil. Regularized multi-task learning. In Pro- ceedings of the tenth ACM SIGKDD international con- ference on Knowledge discovery and data mining, pages 109-117. ACM, 2004.
- [García-Laencina et al., 2010] Pedro J García-Laencina, José-Luis Sancho-Gómez, and Aníbal R Figueiras-Vidal. Pattern classification with missing data: a review. Neural Computing and Applications, 19(2):263-282, 2010.
- [Hall et al., 2016] Adam James Hall, Amir Hussain, and M. Guftar Shaikh. Predicting insulin resistance in chil- dren using a machine-learning-based clinical decision sup- port system. In Cheng-Lin Liu, Amir Hussain, Bin Luo, Kay Chen Tan, Yi Zeng, and Zhaoxiang Zhang, editors, Advances in Brain Inspired Cognitive Systems, pages 274- 283, Cham, 2016. Springer International Publishing.
- [Lipton, 2018] Zachary C. Lipton. The mythos of model in- terpretability. Queue, 16(3):30:31-30:57, June 2018.
- [Madley-Dowd et al., 2019] Paul Madley-Dowd, Rachael Hughes, Kate Tilling, and Jon Heron. The proportion of missing data should not be used to guide decisions on mul- tiple imputation. Journal of Clinical Epidemiology, 110:63 -73, 2019.
- [Mani et al., 2012] Subramani Mani, Yukun Chen, Tom Elasy, Warren Clayton, and Joshua Denny. Type 2 diabetes risk forecasting from emr data using machine learning. In AMIA annual symposium proceedings, volume 2012, page 606. American Medical Informatics Association, 2012.
- [Miotto et al., 2016] Riccardo Miotto, Li Li, Brian A Kidd, and Joel T Dudley. Deep patient: an unsupervised rep- resentation to predict the future of patients from the elec- tronic health records. Scientific Reports, 6:26094, 2016.
- [Perveen et al., 2016] Sajida Perveen, Muhammad Shahbaz, Aziz Guergachi, and Karim Keshavjee. Performance anal- ysis of data mining classification techniques to predict di- abetes. Procedia Computer Science, 82:115-121, 2016.
- [Pimentel et al., 2018] Angela Pimentel, André V Carreiro, Rogério T Ribeiro, and Hugo Gamboa. Screening diabetes mellitus 2 based on electronic health records using tempo- ral features. Health Informatics Journal, 24(2):194-205, 2018.
- [Qiao et al., 2018] Zhi Qiao, Shiwan Zhao, Cao Xiao, Xi- ang Li, Yong Qin, and Fei Wang. Pairwise-ranking based collaborative recurrent neural networks for clinical event prediction. In Proceedings of the Twenty-Seventh Interna- tional Joint Conference on Artificial Intelligence, 2018. IJCAI
- [Singh et al., 2015] Anima Singh, Girish Nadkarni, Omri Gottesman, Stephen B. Ellis, Erwin P. Bottinger, and John V. Guttag. Incorporating temporal EHR data in pre- dictive models for risk stratification of renal function dete- rioration. J. Biomed. Inform., 53:220 -228, 2015.
- [Steyerberg, 2019] Ewout W Steyerberg. Missing values. In Clinical Prediction Models, pages 127-155. Springer, 2019.
- [Talaei-Khoei and Wilson, 2018] Amir Talaei-Khoei and James M. Wilson. Identifying people at risk of developing type 2 diabetes: A comparison of predictive analytics techniques and predictor variables. International Journal of Medical Informatics, 119:22 -38, 2018.
- [Tibshirani, 1996] Robert Tibshirani. Regression shrinkage and selection via the lasso. Journal of the Royal Statistical Society: Series B (Methodological), 58(1):267-288, 1996.
- [Zhao et al., 2019] Jing Zhao, Shaopeng Gu, and Adam Mc- Dermaid. Predicting outcomes of chronic kidney disease from emr data based on random forest regression. Mathe- matical Biosciences, 310:24-30, 2019.
- [Zhou et al., 2011] Jiayu Zhou, Lei Yuan, Jun Liu, and Jieping Ye. A multi-task learning formulation for predict- ing disease progression. In Proceedings of the 17th ACM SIGKDD international conference on Knowledge discov- ery and data mining, pages 814-822. ACM, 2011.
- [Zhou et al., 2012] Jiayu Zhou, Jun Liu, Vaibhav A Narayan, and Jieping Ye. Modeling disease progression via fused sparse group lasso. In Proceedings of the 18th ACM SIGKDD international conference on Knowledge discov- ery and data mining, pages 1095-1103. ACM, 2012.
- [Zhu et al., 2004] Ji Zhu, Saharon Rosset, Robert Tibshirani, and Trevor J Hastie. 1-norm support vector machines. In Advances in neural information processing systems, pages 49-56, 2004.
References were extracted automatically from the PDF and may contain errors.
Full text extracted automatically from the PDF; figures, tables and equations may differ. The PDF is the version of record.
1 Introduction
Type 2 diabetes (T2D) is a chronic disease that continues to grow rapidly in all worldwide countries leading to a substantial clinical, social and economic impact. The impact of diabetes is mainly linked to the development of acute and chronic complications. The cardiopathy complication among nephropathy, central neuropathy, peripheral neuropathy and vasculopathy is the most lethal. The prediction of the risk profile related to cardiopathy complication is a core research task that could support clinical decision making. The design of a clinical decision support system (CDSS) is usually based on Electronic Health Record (EHR) which consists of sequence of patient information over time [Anderson et al., 2016]. In this context, a machine learning (ML) model opens the realm of possibilities to deal with highdimensionality, imbalance learning, the temporal evolution of the data and the sparse features set. However, further several challenges should be taken into account while working with EHR, such as the visit irregularity (e.g., not all laboratory exams are prescribed on a regular basis over time) which leads to a temporal ambiguity and sparse observations over time. In the standard single task learning (STL) scenario the prediction of the risk profile related to a specific diabetes complication (i.e., cardiopathy) is solved independently without considering the spatial relatedness with respect to other complications (i.e., retinopathy, vasculopathy, nephropathy, neuropathy). The multi-task-learning (MTL) model, in this context, might exploit shared knowledge that are implicit among task (i.e., relatedness among different complications outcome). Thus, learning multiple related tasks simultaneously can effectively increase the sample size for each task and improves the prediction performance [Bickel et al., 2008; Zhou et al., 2011]. Accordingly, the prediction of disease progression, at each time point can be considered as a task and these tasks are temporally realated [Zhou et al., 2011]. Starting from these preliminary consideration, we propose to treat the prediction of the risk profile related to cardiopathy as a spatio-temporal MTL problem. We consider as each single task the prediction of the future risk to have different complications (spatial-task) at different time points (temporal-task). The prediction models for different complications at different time points may be similar because they are spatio-temporal reated. We propose spatio-temporal lasso (STL-MTL) and spatio-temporal group lasso (STGL-MTL) as two different MTL procedures which encode this spatio-temporal relatedness using a regulatization term and a graph-based approach. Below we highlight our main contributions:
∗Contact Author
- spatio-temporal relatedness: the STL-MTL and STGL models are able to exploit the spatial relatedness between each diabetes-related complication. Accordingly, the STL-MTL and STGL models are able to exploit the temporal relatedness between past consecutive tempo-
ral windows while dealing with the sparse nature of this setting, where the laboratory exams are prescribed on an irregular basis over time. Hence, the STL-MTL and STGL may exploit similar knowledge between different complications at past consecutive time point over time.
- accurate and interpretable predictive models: experimental results demonstrate the effectiveness of our approach by improving the recall performance with respect to other state-of-the-art comparisons. Moreover, the employed linear STL-MTL and STGL models may support the clinician by revealing the most discriminative features.
These outcomes and the higher interpretability of our approach may favor the acceptance from the medical community and allow an easier integration within a CDSS.
2 RelatedWork
In recent literature, several approaches have been proposed to predict disease progression from heterogeneous and longitudinal EHR data. The state-of-the-art models include sequential deep learning models [Miotto et al., 2016; Qiao et al., 2018] and STL models [Pimentel et al., 2018; TalaeiKhoei and Wilson, 2018]. However, these state-of-the-art works do not model the spatio-temporal relatedness between different complications/disease. Moreover, the potential of DL approaches may be limited by the interpretability of the model, which does not always allow to perform the pattern localization [Lipton, 2018] and represents a crucial aspect in order to design a CDSS.
Disease progression was modeled by using a multi-task temporal approach [Zhou et al., 2011; Zhou et al., 2012; Singh et al., 2015]. They considered the prediction of the value of the disease status at one-time past point as a task and their assumption was to consider that the prediction models at different time points may be similar due to the temporal relatedness. However, they did not encapsulate any spatial relatedness with other diseases in the model. In this paper, we decided to extend this formulation by incorporating the spatial-temporal knowledge in a MTL model.
3 Methods
In this section, we describe our algorithm, a spatio-temporal multi-task learning approach which is implemented by imposing the task relatedness using the structure matrix. Figure 1 shows the task relatedness represented by a graph for the different multi-task approaches. The spatial multi-task learning model (MTL) encapsulates the relatedness among the different complications (see Figure 1a). The temporal multi-task learning formulations (TL and TGL) inspired by [Zhou et al., 2011; Zhou et al., 2012] encapsulates the temporal relatedness by sharing the parameters of the models built at past consecutive time points (tasks). In the TL and TGL formulations, each complication is independent of the others (see Figure 1b). Our Spatial-temporal multi-task learning approaches (STL-MTL and STGL-MTL) extend this formulation by sharing similar knowledge among different complications at past consecutive time points over time.
3.1 Background: Multi-task Learning
For notation purpose, let (Xi, j and Yi, j) be the input and the label of the j-th sample of the task i. For each task, the input Xi ∈ ´ n is the feature vector and the output Yi ∈ {-1,1} is the class label. The feature vector is represented by the values of laboratory exams while the output reflects the presence (1) or the absence (-1) of the cardiopathy complication. We let C = {retinopathy, vasculopathy, cardiopathy, nephropathy, neuropathy} the set of the considered complications and C∗ = {1,2,3,4,5} the associated numerical order. The common formulation of MTL model is to minimize the penalized empirical loss:
where w is the model parameter, L (w) is the general empirical loss on the training set and W(w) is the regularization term that encodes task relatedness.
Spatial Multi-task Learning
Three regularization based MTL approaches were considered as baseline: MTL lasso [Tibshirani, 1996], MTL meanreg [Evgeniou and Pontil, 2004] and MTL jointfeat [Argyriou et al., 2007]. For the loss function we adopt the logistic regression function:
where wi and bi are the model parameter of logistic regression function for task i and T is the total number of tasks. For the test input X from task i we obtain the binary prediction:
In the standard MTL formulation, we assume that the number of tasks is equal to the number of considered complications (i.e., T = |C| = 5). The main task is the prediction of the cardiopathy complication while the auxiliary tasks are related to the prediction of retinopathy, vasculopathy, nephropathy and neuropathy.
MTL lasso. The MTL lasso solves the l1-norm and the squared l2-norm regularized multi-task logistic regression problem. The regularization function is:
where the r1 controls sparsity and the r2 controls the complexity of the model. The r1 is shared among all tasks, assuming that different tasks share the same sparsity parameter.
MTL meanreg. TheMTL meanreg solves the graph structure regularized and the l1-norm and the squared l2-norm regularized multi-task logistic regression problem. The regularization function is:
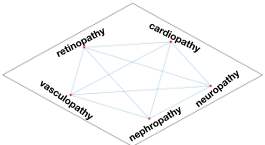
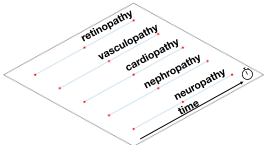
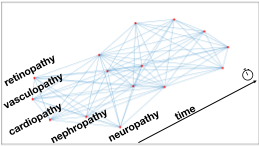
Figure 1: Task relatedness represented by a graph for the different multi-task approaches. The spatio-temporal multi-task learning formulations (STL-MTL and STGL-MTL) share similar knowledge among different complications at past consecutive time point over time.
Algorithm 1 Design of the R variable for TL and TGL
input: e1 (constant: temporal relatedness among tasks) output: R, T
- 1: R1 =R2 = zeros(T,T -1)
2: foreach i =1 : T -1
3: R1 = [e1,-e1]
4: end
5: R1 =R1R T 1
6: R2 =R2R T 2
7: R= [R1,R2,R2,R2,R2]
where the r0 encourages every two neighbor tasks to be similar (temporal smoothness), the r1 controls group sparsity and the r2 controls the complexity of the model. Note that this can be written in a simple form using the structure variable R, leading to the formulation of temporal lasso (TL):
where R encodes the task relatedness in a graph structure where neighbor tasks are coupled via edges (see Figure 1b. An alternative formulation, called temporal group lasso (TGL), follows the regularization function of MTL jointfeat:
where the ‖w‖1 is substituted with the ‖w‖2,1 and the r1 controls group sparsity (i.e., induces common features across the temporal task) instead of the overall sparsity. The design of the structure variable R for TL and TGL can be performed following the Algorithm 1.
3.2 Spatio-temporal Multi-task Learning
In our formulation, we encourage every two neighbor windows (temporal tasks) to be similar (temporal smoothness). At the same time we assume that for each window, all complications (spatial task) are related in the way that the model built for each complication is close to their mean. Thus, the
where the r1 controls the sparsity and the r2 controls the complexity of the model. The R matrix encodes the complete graph structure of the task relatedness (see Figure 1a). The r0 is the structure controlling parameter which imposes sparsity by the structure variable R. Following the formulation proposed by [Evgeniou and Pontil, 2004], it assumes the parameters of all tasks are close to their mean. Thus the regularization function can be also presented in the following form:
where the penalty parameter l > 0 penalizes the deviation of each task from the mean 1 T � T s=1 Ws. This regularization can also be encoded using the structure matrix R:
where I and 1 are the identity matrix and matrix with all ones respectively.
MTL jointfeat. The MTL jointfeat solves the l2,1-norm and the squared l2-norm regularized multi-task logistic regression problem. The regularization function is:
where the r1 controls the group sparsity and the r2 controls the complexity of the model. This formulation model the relatedness among tasks by constraining all models to share a common set of features.
Temporal Multi-task Learning
The temporal MTL formulation originated from the work made by [Zhou et al., 2011; Zhou et al., 2012] where the prediction of the complications at one-time past point is considered as a task. In the temporal configuration, the total number of tasks (T) reflects the number of considered past windows (win). Although the tasks are temporally related, none relatedness among the different complications is assumed (see Figure 1b). The model encodes the temporal information using the following regularization function:
Algorithm 2 Design of the R variable for STL-MTL and STGL-MTL
input: e1, e2 (temporal and spatial relatedness among tasks) output: R, win
- 1: R1 =R2 = zeros(win,win-1)
- 2: foreach i =1 : win-1
- 3: R1 = [e1,-e1]
- 4: R2 = [e2,-e2]
- 5: end
- 6: R1 =R1R T 1
- 7: R2 =R2R T 2
- 8: R= ⊕|C| i=1 R1 = diag(R1, R1, R1, R1, R1)
- 9: R=R+repmat(R2, |C|, |C|)
parameters of each model are shared spatially (across different complications) and temporally (between past consecutive samples). Starting from the regularization function described in (11) and (12) we formulate the spatio-temporal lasso (STLMTL) and spatio-temporal group lasso (STGL-MTL) model. The structure variable was designed according to Algorithm 2.
Formally the ⊕ operator denotes the direct sum of matrices:
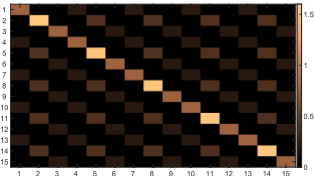
where 0 is the square matrix of all zeros with win dimensions. Finally, the structure variable achieved the following form:
1 2 3 4 5 6 7 8 9 10 11 12 13 14 15
Figure 2: Structure variable R of the STL-MTL and STGL-MTL models. The matrix R encodes the spatio-temporal relatedness among different complications at past consecutive time points over time.
The representation of the structure variable R of the proposed approach is depicted in Figure 2. The i-th task represents the predictive model related to (i) the complications
(qc+1) ∈C∗ and (ii) the time window rwin ≤ win (where i = qc∗win+rwin and qc and rwin are the quotient and the rest of the division between i and win respectively). The total number of tasks (T) corresponds to the number of considered past windows (win) multiplied with the total number of complications (|C| = 5).
Computation of the Overall Prediction
For the main complication task (i.e., the prediction of cardiopathy complication), we first obtain the intermediate win predictions {ˆ y2∗win+1, . . . , ˆ y3∗win}. Then, we generate a single prediction ˆ yc by averaging the prediction of each time window. In our analysis, we considered further aggregation techniques, including the maximum, minimum, median and weighted average of the intermediate predictions. However, these further approaches did not lead to significant improvement in performance.
4 Experiments
We conducted experiments on a real dataset called Smart Digital Clinic-METEDA File. The dataset originated from a subset of the EHR Smart Digital Clinic-METEDA in use at Italian diabetes centers. The Smart Digital Clinic-METEDA File consists of 9203 patients and includes over 2000 laboratory exam entries and all the diagnoses of clinical pathologies coded according to the International Classification of Disease 9th Revision (ICD-9). The Ethical Committees of University approved the experimental study and its guidelines as a clinical noninterventional (observational) study. EHR data are anonymous and their use, detention and conservation are regulated by an agreement between the company, University and data owners. All the process is inside the EU GDPR regulation.
4.1 Clinical Data: Exclusion Criteria
Our clinical data represent a subset of the Smart Digital Clinic-METEDA dataset with a longitudinal observational time-period up to 6 years according to the following criteria: (i) exclusion of patients that do not have a diabetic anamnesis, (ii) exclusion of patients that do not have at least one record of the absence of cardiopathy complication (control condition), (iii) exclusion of patients that do not have laboratory exams prescription during the considered time interval. The considered time interval starts from the diabetic anamnesis until the first complication-related event (i.e., presence of cardiopathy complication or absence of cardiopathy complication). Only the laboratory exam data recorded before the complication-related event and after the diabetic anamnesis were considered in the analysis. The original features set was composed of 101 laboratory exams. Missing values of laboratory exams features were indicated as NaN. The features that have an overall amount of NaN greater than a threshold of 95% were discarded. The rational choice behind this threshold is the need of a predictive model in the clinical scenario that is consistent even with large proportions of missing data (up to 95%), as previously did in other studies [Madley-Dowd et al., 2019; Steyerberg, 2019]. Further experiments proved how the performance of the model is stable across different threshold settings. This fact implies that features with many missing values are not discriminative [Garc´ıa-Laencina et al., 2010]. The exclusion criteria procedure led to consider 1517 patients and 59 laboratory exams. To track the missing values mechanism the NaN values were replaced with a numeric extra value (i.e., 999) (extra values imputation).
4.2 Experimental Comparisons
We decided to compare the spatio-temporal MTL approach with respect to STL agorithms widely employed in literature closer to our setting (see Section 2), such as: DT [TalaeiKhoei and Wilson, 2018; Pimentel et al., 2018; Hall et al., 2016]; RF [Zhao et al., 2019; Pimentel et al., 2018]; Boosting [Perveen et al., 2016]; SVM Lin and SVM Gauss [TalaeiKhoei and Wilson, 2018; Mani et al., 2012; Pimentel et al., 2018]; and SVM Lasso [Bernardini et al., 2019]. Further comparisons were made with respect to baseline MTL models [Tibshirani, 1996; Evgeniou and Pontil, 2004; Argyriou et al., 2007] by also augmenting the features set by including the max, the min, the standard deviation and the interquartile range in addition to the mean value of the past observations (MTL+). Moreover, we compared our approach with respect to [Zhou et al., 2011; Zhou et al., 2012] which employs temporal MTL approaches (i.e., TL and TGL) to model disease progression.
4.3 Validation Procedure
We evaluated the performance of the proposed approach using a Tenfold Cross-Validation over subjects (CVOS-10) procedure. All subjects were divided into ten folds and selecting alternately nine folds for training and one fold for testing. This setup is closer to clinical diagnosis purposes, since the ML algorithm needs to generalize the decision rules, learned from subjects who already have a complication, across new unseen subjects. Table 1 summarizes the range of the hyperparameters optimized for each ML model during the CVOS-10. In particular, the hyperparameters optimization was performed implementing a grid-search and optimizing the macro-Recall in a nested CVOS-5. Although this procedure was computationally expensive, it allowed to obtain an unbiased and robust performance evaluation [Cawley and Talbot, 2010]. Macro-Recall was preferred over other optimization objectives, because the maximization at the same time as the specificity and sensitivity of the model has more clinical relevance for a screening purpose. For all models we have explored three different window settings (i.e., win = 3, win = 6, win = 10). The synthetic minority oversampling technique (SMOTE) algorithm [Chawla et al., 2002] was employed to deal with the imbalance learning problem by oversampling the minority class.
4.4 Experimental Results
We evaluated the results of the proposed approach in terms of predictive performance and interpretability.
Predictive Performance
Table 2 shows the predictive performance of the STL-MTL and STGL-MTL and the performed comparison.
The STL-MTL and STGL-MTL achieved the best performance (0.709 and 0.705) in terms of Macro-Recall for win = 6. Results evidenced that both STL-MTL and STGLMTL are statistically superior (p < 0.05) than STL and MTL/MTL+ according to a two-sample t-test (significance level = 0.05). Accordingly, the performance of the proposed algorithms is influenced by the window setting (i.e., win). Thus, a high number of win may lead from one side to an increase in time resolution to capture the most salient event and from the other side to the increasing of missing values. On the other hand, a low number of win may lose relevant information related to the laboratory exams.
| Model | Hyp | Range |
|---|---|---|
| STL | ||
| DT | max # of splits | {5, 10, 15, 20, 25, 50} |
| RF | # of DT # of predictors to select | {5, 10, 20, 30, 40, 50} { al l 4 , all 3 , all 2 ,all} |
| Boosting | max # of splits max # of weak classifiers | {5, 10, 20, 30, 40, 50} {5, 10, 20, 30, 40, 50} |
| SVM Lin | Box Constraint | {10-2 , 10-1 , . . . , 10 3} |
| SVM Gauss | Box Constraint Kernel Scale | {10-4 , 10-3 , . . . , 10 3} |
| SVM Lasso | Lambda | {10-5 , 10-4 , . . . , 100} |
| MTL/MTL+ | ||
| MTL lasso | Sparsity controlling parameter (r1) L2-norm regularization parameter (r2) | {10-7 , 10-6 , . . . , 100} {10-4 , 10-3 , . . . , 10 3} |
| MTL meanreg | Structure regularization parameter (r0) Sparsity controlling parameter (r1) L2-norm regularization parameter (r2) | {10-7, 10-6, . . . , 100} {10-7 , 10-6 , . . . , 100} {10-4 , 10-3 , . . . , 10 3} |
| MTL jointfeat | L2,1-norm group Lasso parameter L2-norm regularization parameter | {10-7 , 10-6 , . . . , 100} {10-4 , 10-3 , . . . , 10 3} |
| Temporal MTL | ||
| TL | Structure regularization parameter Sparsity controlling parameter L2-norm regularization parameter | {10-7 , 10-6 , . . . , 100} {10-7 , 10-6 , . . . , 100} {10-4 , . . . , 10 3 } |
| TGL | Structure regularization parameter L2,1-norm group Lasso parameter L2-norm regularization parameter | {10-7 , 10-6 , . . . , 100} {10-7 , 10-6 , . . . , 100} {10-4 , 10-3 , . . . , 10 3} |
| Spatio-Temporal MTL | ||
| STL-MTL | Structure regularization parameter Sparsity controlling parameter L2-norm regularization parameter | {10-7, 10-6, . . . , 100} {10-7 , 10-6 , . . . , 100} {10-4 , 10-3 , . . . , 10 3} |
| STGL-MTL | Structure regularization parameter L2,1-norm group Lasso parameter | {10-7 , , . . . , 100} , . . . , 100} |
| L2-norm regularization parameter | 10-6 {10-7 , 10-6 {10-4 , 10-3 , . . . 10 3 } |
Interpretability
The top-15 rank features were listed in descending order of percentage importance for the proposed STL-MTL (win = 6) model (i.e., the best performing model) (see Table 3). The features importance was extracted by averaging the magnitude weights coefficients of the intermediate models {w2∗win+1, . . . ,w3∗win}. These fifteen features contain a total of 51.4% of importance.
5 Conclusions
In this paper, we propose to formulate the prediction of the risk profile related to the cardiopathy complication as a spatio-temporal MTL problem. We propose STL-MTL and STGL-MTL as two different MTL procedures which encode spatio-temporal relatedness among tasks. The parameters of each model are shared spatially (across different complications) and temporally (between past consecutive samples). The proposed algorithms proved to be effective in dealing with this task, by overcoming the other state-of-the-art STL, MTL and temporal MTL approaches. Accordingly, the proposed approach is able to localize discriminative features, even if not apparently related to the cardiopathy diagnosis. The outcome of the STL-MTL and STGL models can lie the foundations of a CDSS for:
| Work | Model | Accuracy | macro-F1 | macro-Recall | Recall |
|---|---|---|---|---|---|
| STL | |||||
| [Talaei-Khoei and Wilson, 2018; Pimentel et al., 2018; Hall et al., 2016] | DT | 0.777 | 0.546 | 0.555 | 0.264 |
| [Zhao et al., 2019; Pimentel et al., 2018] | RF | 0.835 | 0.568 | 0.562 | 0.203 |
| [Perveen et al., 2016] | Boosting | 0.861 | 0.561 | 0.551 | 0.143 |
| [Talaei-Khoei and Wilson, 2018; Pimentel et al., 2018] | SVM Lin | 0.657 | 0.544 | 0.658 | 0.659 |
| [Talaei-Khoei and Wilson, 2018; Pimentel et al., 2018] | SVM Gauss | 0.671 | 0.548 | 0.649 | 0.621 |
| [Zhu et al., 2004; Bernardini et al., 2019] | SVM Lasso | 0.645 | 0.538 | 0.663 | 0.687 |
| MTL | |||||
| [Tibshirani, 1996] | MTL lasso | 0.545 | 0.480 | 0.656 | 0.802 |
| [Evgeniou and Pontil, 2004] | MTL meanreg | 0.529 | 0.471 | 0.659 | 0.830 |
| [Argyriou et al., 2007] | MTL jointfeat | 0.579 | 0.503 | 0.666 | 0.780 |
| MTL+ | |||||
| [Tibshirani, 1996] | MTL lasso | 0.592 | 0.502 | 0.635 | 0.692 |
| [Evgeniou and Pontil, 2004] | MTL meanreg | 0.533 | 0.474 | 0.659 | 0.824 |
| [Argyriou et al., 2007] | MTL jointfeat | 0.428 | 0.403 | 0.644 | 0.929 |
| Temporal MTL (win) | |||||
| [Zhou et al., 2011; Zhou et al., 2012] | TL(3) | 0.628 | 0.537 | 0.689 | 0.769 |
| [Zhou et al., 2011; Zhou et al., 2012] | TL(6) | 0.616 | 0.530 | 0.690 | 0.786 |
| [Zhou et al., 2011; Zhou et al., 2012] | TL(10) | 0.654 | 0.548 | 0.678 | 0.709 |
| [Evgeniou and Pontil, 2004] | TGL(3) | 0.601 | 0.521 | 0.688 | 0.802 |
| [Evgeniou and Pontil, 2004] | TGL(6) | 0.617 | 0.532 | 0.695 | 0.797 |
| [Evgeniou and Pontil, 2004] | TGL(10) | 0.648 | 0.547 | 0.684 | 0.731 |
| Spatio-temporal MTL (win) | |||||
| STL-MTL(3) | 0.634 | 0.542 | 0.695 | 0.775 | |
| STL-MTL(6) | 0.650 | 0.555 | 0.709 | 0.786 | |
| STL-MTL(10) | 0.676 | 0.563 | 0.686 | 0.698 | |
| STGL-MTL(3) | 0.595 | 0.490 | 0.592 | 0.588 | |
| STGL-MTL(6) | 0.632 | 0.544 | 0.705 | 0.802 | |
| STGL-MTL(10) | 0.661 | 0.553 | 0.679 | 0.703 |
| Rank | Laboratory Exams (uom) | % |
|---|---|---|
| 1 | urine glucose | 6.6 |
| 2 | urine ketone bodies | 5.9 |
| 3 | microalbuminuria (mg/l) | 4.7 |
| 4 | waist circumference (cm) | 4.6 |
| 5 | potassium (mmol/l) | 3.9 |
| 6 | gamma-glutamyltransferase (Ul/L) | 3.1 |
| 7 | clearance Creatinine (ml/min) | 3.1 |
| 8 | height (cm) | 2.9 |
| 9 | glycated hemoglobin (%) | 2.5 |
| 10 | hemoglobin (g/dl) | 2.5 |
| 11 | glycosuria (mg/dl) | 2.5 |
| 12 | sodium (mEq/L) | 2.4 |
| 13 | LDL-Cholesterol (mg/dl) | 2.3 |
| 14 | prostate-Specific Antigen (ng/ml) | 2.2 |
| 15 | HDL-Cholesterol (mg/dl) | 2.2 |
| Others | 48.6 |
- predicting risk profiles of individual patients fromwhich a different intensity of treatment can be deduced with consequent modification of the control times according to the needs; this approach would produce a shortening of the waiting times and an increase in the appropriateness of the treatment.
- predicting the risk of short-term cardiopathy complication which will activate personalized prevention systems directly addressed to the patient: from targeted recalls to targeted motivational and training activities.
Two important limitations of our approach are the high sensitivity of the algorithm to the different window setting and the managing of missing values occurrences. Future work may be addressed (i) to set the optimal number of windows by exploiting information theory metrics and (ii) to design an advanced data imputation strategy.
@inproceedings{ijcai2020p593,
  title     = {A Novel Spatio-Temporal Multi-Task Approach for the Prediction of Diabetes-Related Complication: a Cardiopathy Case of Study},
  author    = {Romeo, Luca and Armentano, Giuseppe and Nicolucci, Antonio and Vespasiani, Marco and Vespasiani, Giacomo and Frontoni, Emanuele},
  booktitle = {Proceedings of the Twenty-Ninth International Joint Conference on
               Artificial Intelligence, {IJCAI-20}},
  publisher = {International Joint Conferences on Artificial Intelligence Organization},
  editor    = {Christian Bessiere},
  pages     = {4299--4305},
  year      = {2020},
  month     = {7},
  note      = {Special track on AI for CompSust and Human well-being},
  doi       = {10.24963/ijcai.2020/593},
  url       = {https://doi.org/10.24963/ijcai.2020/593},
}
TY - CPAPER TI - A Novel Spatio-Temporal Multi-Task Approach for the Prediction of Diabetes-Related Complication: a Cardiopathy Case of Study AU - Romeo, Luca AU - Armentano, Giuseppe AU - Nicolucci, Antonio AU - Vespasiani, Marco AU - Vespasiani, Giacomo AU - Frontoni, Emanuele T2 - Proceedings of the Twenty-Ninth International Joint Conference on Artificial Intelligence, IJCAI-20 PB - International Joint Conferences on Artificial Intelligence Organization PY - 2020 SP - 4299 EP - 4305 DO - 10.24963/ijcai.2020/593 UR - https://doi.org/10.24963/ijcai.2020/593 ER -Copied
Machine-readable versions of this paper, for tools and AI agents:





