
Neighbor Combinatorial Attention for Critical Structure Mining
Proceedings of the Twenty-Ninth International Joint Conference on Artificial Intelligence. Main track. Pages 3299-3305.
https://doi.org/10.24963/ijcai.2020/456
© 2020 International Joint Conferences on Artificial Intelligence
Keywords
- Machine Learning: Deep Learning
- Data Mining: Mining Graphs, Semi Structured Data, Complex Data
Abstract
Graph convolutional networks (GCNs) have been widely used to process graph-structured data. However, existing GNN methods do not explicitly extract critical structures, which reflect the intrinsic property of a graph. In this work, we propose a novel GCN module named Neighbor Combinatorial ATtention (NCAT) to find critical structure in graph-structured data. NCAT attempts to match combinatorial neighbors with learnable patterns and assigns different weights to each combination based on the matching degree between the patterns and combinations. By stacking several NCAT modules, we can extract hierarchical structures that is helpful for down-stream tasks. Our experimental results show that NCAT achieves state-of-the-art performance on several benchmark graph classification datasets. In addition, we interpret what kind of features our model learned by visualizing the extracted critical structures.
- [Atwood and Towsley, 2016] James Atwood and Don Towsley. Diffusion-convolutional neural networks. In Advances in Neural Information Processing Systems, pages 1993-2001, 2016.
- [Borgwardt and Kriegel, 2005] Karsten M Borgwardt and Hans-Peter Kriegel. Shortest-path kernels on graphs. In Fifth IEEE international conference on data mining (ICDM'05), pages 8-pp, 2005.
- [Bruna et al., 2013] Joan Bruna, Wojciech Zaremba, Arthur Szlam, and Yann LeCun. Spectral networks and lo- cally connected networks on graphs. arXiv preprint arXiv:1312.6203, 2013.
- [Defferrard et al., 2016] Michaël Defferrard, Xavier Bres- son, and Pierre Vandergheynst. Convolutional neural net- works on graphs with fast localized spectral filtering. In Advances in neural information processing systems, pages 3844-3852, 2016.
- [Kingma and Ba, 2015] Diederik P Kingma and Jimmy Ba. Adam: A method for stochastic optimization. Proceedings of International Conference on Learning Representations, 2015.
- [Kipf and Welling, 2017] T.N. Kipf and M. Welling. Semi- supervised classification with graph convolutional net- works. In Proceedings of International Conference on Learning Representations, 2017.
- [Kriege et al., 2016] Nils M Kriege, Pierre-Louis Giscard, and Richard Wilson. On valid optimal assignment ker- nels and applications to graph classification. In Advances in Neural Information Processing Systems, pages 1623- 1631, 2016.
- [LeCun et al., 2015] Yann LeCun, Yoshua Bengio, and Ge- offrey Hinton. Deep learning. nature, 521(7553):436, 2015.
- [Mikolov et al., 2013] Tomas Mikolov, Kai Chen, Greg Cor- rado, and Jeffrey Dean. Efficient estimation of word repre- sentations in vector space. In Proceedings of International Conference on Learning Representations, 2013.
- [Niepert et al., 2016] Mathias Niepert, Mohamed Ahmed, and Konstantin Kutzkov. Learning convolutional neural networks for graphs. In International conference on ma- chine learning, pages 2014-2023, 2016.
- [Shervashidze et al., 2009] Nino Shervashidze, SVN Vish- wanathan, Tobias Petri, Kurt Mehlhorn, and Karsten Borg- wardt. Efficient graphlet kernels for large graph compar- ison. In Artificial Intelligence and Statistics, pages 488- 495, 2009.
- [Shervashidze et al., 2011] Nino Shervashidze, Pascal Schweitzer, Erik Jan van Leeuwen, Kurt Mehlhorn, and Karsten M Borgwardt. Weisfeiler-lehman graph kernels. Journal of Machine Learning Research, 12(Sep):2539- 2561, 2011.
- [Shuman et al., 2013] David Shuman, Sunil Narang, Pascal Frossard, Antonio Ortega, and Pierre Vandergheynst. The emerging field of signal processing on graphs: Extend- ing high-dimensional data analysis to networks and other irregular domains. IEEE Signal Processing Magazine, 3(30):83-98, 2013.
- [Tzeng and Wu, 2019] Ruo-Chun Tzeng and Shan-Hung Wu. Distributed, egocentric representations of graphs for detecting critical structures. In International Conference on Machine Learning, pages 6354-6362, 2019.
- [Ulyanov et al., 2016] Dmitry Ulyanov, Andrea Vedaldi, and Victor Lempitsky. Instance normalization: The miss- ing ingredient for fast stylization. arXiv preprint arXiv:1607.08022, 2016.
- [Verma and Zhang, 2018] Saurabh Verma and Zhi-Li Zhang. Graph capsule convolutional neural networks. arXiv preprint arXiv:1805.08090, 2018.
- [Vishwanathan et al., 2010] S Vichy N Vishwanathan, Nicol N Schraudolph, Risi Kondor, and Karsten M Borgwardt. Graph kernels. Journal of Machine Learning Research, 11(Apr):1201-1242, 2010.
- [Wu et al., 2019] Zonghan Wu, Shirui Pan, Fengwen Chen, Guodong Long, Chengqi Zhang, and Philip S Yu. A comprehensive survey on graph neural networks. arXiv preprint arXiv:1901.00596, 2019.
- [Xu et al., 2018] Keyulu Xu, Chengtao Li, Yonglong Tian, Tomohiro Sonobe, Ken-ichi Kawarabayashi, and Stefanie Jegelka. Representation learning on graphs with jumping knowledge networks. In Proceedings of the 35th Inter- national Conference on Machine Learning, ICML 2018, Stockholmsmässan, Stockholm, Sweden, July 10-15, 2018, pages 5449-5458, 2018.
- [Yanardag and Vishwanathan, 2015] Pinar Yanardag and SVN Vishwanathan. Deep graph kernels. In Proceedings of the 21th ACM SIGKDD International Conference on Knowledge Discovery and Data Mining, pages 1365-1374, 2015.
- [Ying et al., 2018] Zhitao Ying, Jiaxuan You, Christopher Morris, Xiang Ren, Will Hamilton, and Jure Leskovec. Hierarchical graph representation learning with differen- tiable pooling. In Advances in Neural Information Pro- cessing Systems, pages 4800-4810, 2018.
- [Zhang et al., 2018] Muhan Zhang, Zhicheng Cui, Marion Neumann, and Yixin Chen. An end-to-end deep learn- ing architecture for graph classification. In Thirty-Second AAAI Conference on Artificial Intelligence, 2018.
- [Zhou et al., 2018] Jie Zhou, Ganqu Cui, Zhengyan Zhang, Cheng Yang, Zhiyuan Liu, and Maosong Sun. Graph neu- ral networks: A review of methods and applications. arXiv preprint arXiv:1812.08434, 2018.
References were extracted automatically from the PDF and may contain errors.
Full text extracted automatically from the PDF; figures, tables and equations may differ. The PDF is the version of record.
1 Introduction
Traditional deep neural networks (e.g. CNN [LeCun et al., 2015] and RNN [Mikolov et al., 2013]) have made great progress on Euclidean data like images, audios and videos. However, it is hard to directly deploy these models to process a widely-used structural data, i.e. graphs, which is essential in computer science. Recently, inspired by deep neural networks, graph neural networks (GNNs) [Atwood and Towsley, 2016; Kipf and Welling, 2017; Verma and Zhang, 2018] are proposed to process various kind of graphs, and demonstrate their capability in processing graph-related tasks.
By analyzing the data and task we get the important insight to design our module. Graph structure data can be roughly divided into two classes: similarity-based (e.g. social networks and citation networks) and structure-based (e.g. molecules and proteins). We notice that critical structures are widely existed in structure-based graphs. The critical structures are structure-based subgraphs that reflect the intrinsic property of a graph. For example, carboxybenzene and nitrobenzene has similar structure except their functional group: carboxyl (COOH) and nitryl (NO2) (Figure 1(c)). Their functional groups determine the acidity of carboxybenzene and the mutagenicity of nitrobenzene. However, existing GNN methods do not explicitly extract critical structures in their model. In this paper, we design a novel graph convolution module named Neighbor Combinatorial ATtention (NCAT) to find the critical structures which makes our model more interpretable and improves its performance.
∗Equal contribution.
†Corresponding author.
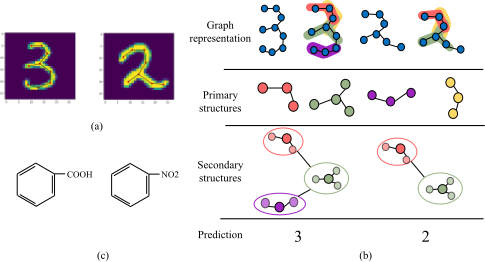
The insight behind NCAT is that the properties of a structure-based graph is mainly determined by its critical structures, and we can find critical structures with different scales hierarchically. Figure 1 gives an illustration of our insight. Figure 1(a) depicts structure-based graphs formed by detecting key points of digits using spectral clustering. In this way, we can compute the graph representations of the digits and extract their primary critical structures depending on their relative positions. By stacking several NCAT modules, we can extract critical structures with different scales (e.g. primary and secondary critical structures in Figure 1(b)) of the graphs. We can form discriminative graph embeddings by combining those critical structures, which make the downstream tasks easier to tackle.
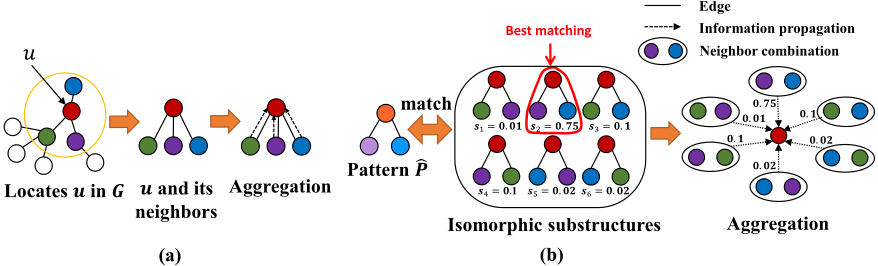
Figure 2 presents a closer look of NCAT module, and compares it with GCN. Figure 2(a) depicts how GCN aggregate information from the neighboring nodes. Given a node u, GCN first locates it in the graph G, and then aggregate information from its neighbors to form the node embedding of it. In contrast to GCN layers, NCAT pays more attention to the substructures that matches particular pattern. Figure 2(b) shows this procedure. For each node u, NCAT considers all substructures isomorphic to the learned pattern. Each substructure consists of a center node u and a neighbor combination. NCAT evaluates the matching scores s between the learned pattern and substructures by a similarity function, and then assigns weights to the neighbor combinations based on the scores. Thus, neighbor combinations match the learned pattern (i.e. the critical structures) will contribute more when forming the node embeddings. Finally, the weighted features of all the neighbor combinations are aggregated into the embedding for center node u.
The main contributions of this paper are summarized as follows: (1) We proposed a novel graph convolution module named NCAT to find critical structures in graphs. Given a structure-based graph, NCAT can hierarchically find critical structures with different scales and form a discriminative graph embedding by combining the critical structures. (2) We conduct experiments on graph classification and hand-written digits datasets to evaluate our module. On several benchmark graph classification dataset, NCAT achieved state-of-the-art performance. And, the experiments on hand-written digits further demonstrate the superiority of NCAT when processing structure-based graph. (3) We also provide a visualization of the learned critical structures to demonstrate the interpretability of our model.
2 RelatedWork
Due to the success of CNN, many works attempt to imitate the convolution [Shuman et al., 2013] and pooling [Ying et al., 2018] operations on graph and make some progress in processing graphs. In this section, we will provide a brief introduction about the above methods.
Graph convolution. Early works defined the convolutional operation in the context of spectral graph theory [Bruna et al., 2013]. However, the spectral computation is global and timeconsuming. ChebNet [Defferrard et al., 2016] parameterized graph filter as a Chebyshev polynomial of eigenvalues, make the convolution operation localized in space. GCN [Kipf and Welling, 2017] further simplified ChebNet by a first-order approximation and it bridges the gap between spectral- and spatial-based GCNs. Spatial-based GCNs try to imitate the convolution operation on images by defining graph convolution based on its nodes' spatial relations. The main challenge is that neighbors of each node have no order. PATCHY-SAN [Niepert et al., 2016] and Ego-CNNs [Tzeng and Wu, 2019] tried to solve this issue by sorting all nodes by a pre-defined labeling before model training. With the help of labeling, they can process the graph-structured data in a conventional way like grid-structured data. Interested readers can obtain a more detailed introduction to GCNs in [Wu et al., 2019; Zhou et al., 2018].
Graph pooling. In some tasks like graph classification, a graph-level feature embedding is required. Therefore, some works [Ying et al., 2018; Zhang et al., 2018] have defined the pooling operation on graphs to form a better graph-level representation. [Zhang et al., 2018] proposed SortPool, which performs pooling by sorting nodes into a meaningful order and preserving the top-k nodes for downstream tasks. DiffPool [Ying et al., 2018] learns an assignment matrix to cluster nodes and form a hierarchical representation of a graph. They provide a general way to reduce graph size and form the graph's hierarchical structure.
Graph kernels. Graph Kernel is the conventional way to process graphs before GNNs are proposed, and our proposed method have some similar insights with the Graph Kernels. Graph kernels attempt to define the similarity between graphs, which makes it possible for learning approaches such as support vector machines (SVMs) to work directly on graphs [Vishwanathan et al., 2010]. To control the time complexity, they restrict themselves to counting substructures that are computable in polynomial time, such as graphlets [Shervashidze et al., 2009], shortest paths [Borgwardt and Kriegel, 2005], random walks [Vishwanathan et al., 2010] and subtrees [Shervashidze et al., 2011]. An effective class of graph kernels is the Weisfeiler-Lehman (WL) kernel[Shervashidze et al., 2011]. WL-subtree kernel relabels each node based on the collection of local-neighbor labels in each iteration. However, it focuses on the graph structure and does not support continuous node and edge labels, which are important in bioand chemoinformatics. In contrast to those kernel methods, NCAT learns sub-tree patterns from graphs and can process features on both nodes and edges with linear complexity w.r.t. the number of edges.
3 Neighbor Combinatorial Attention
In this section, we introduce the NCAT module, a basic GCN building block. We first specify our notations and outline the pipeline of our model, in Section 3.1 and 3.2. Then, we will explain the details of our module, in Section 3.3. We also explain how our module process edge features and illuminate the connection between our module and CNN in Section 3.4 and 3.5.
3.1 Preliminary
In this paper, we use lowercase letters (e.g., a, b, c) to represent scalars, bold lowercase letters (e.g., x, y, z) to represent vectors, and bold uppercase letters (e.g., A,W,X) to represent matrices or tensors. The typical input to our module is a graph G and node features X, where a graph is a pair G = (V,E) in which V is the vertices set and E ⊆ {(u, v)|u, v ∈ V } is the set of edges. The node features are X = (x1, x2, · · · , xn)T ∈ Rn×d , where xu is the feature of node u, and n, d represent the number of nodes (graph size) and the input dimension, respectively. N(u) = {v|(u, v) ∈ E} is the neighborhood set of node u, which contains all neighbors of node u. NCAT matches the pattern with node u and its neighbor combinations (i.e. subsets of N(u)), and assigns different weights to neighbor combinations based on the matching degree. To simplify the representation, we define the sequence set for a node u.
Definition 1. The sequence set Qm(u) for node u contains all permuted node sequences of N(u) that have exactly m neighbors:
For a node u with nu neighbors, Qm(u) contains P nu m elements.
3.2 Pipeline
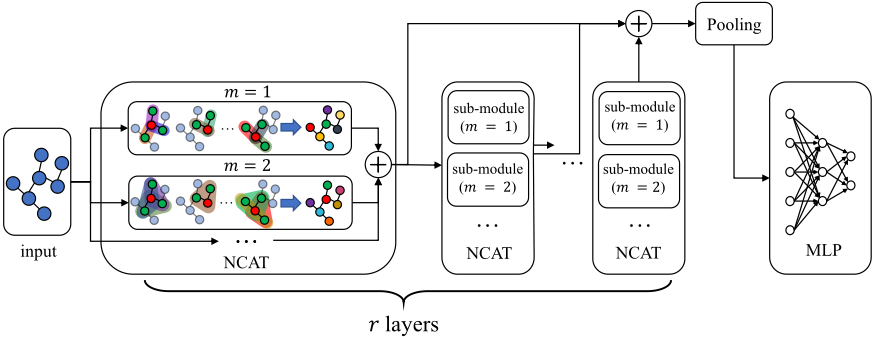
Before providing a detailed introduction to NCAT, we first describe the pipeline of our model in Figure 3. The input is a graph G = (V, E), which can be described by an adjacency matrix A ∈ Rn×n and a node features matrix X ∈ Rn×d . If the graph includes edge labels, an additional edge features matrix Xe ∈ Rn×n×l is required. xeu,v ∈ Rl is the feature of the edge between nodes u, v ∈ V . The input graphs first traverse the NCAT layers, which extract different-scaled critical structures of them; these are the ingredients of graph embeddings. Entire model includes r NCAT layers, and each NCAT layer contains several NCAT sub-modules. Each sub-module can include c different patterns; we call this parameter a channel. sub-modules extract informative critical structures based on different patterns with sizes m = 1, 2, · · · . The outputs from all the channels are concatenated to form the output of the sub-module, and outputs of all the sub-modules are concatenated to form the output of the entire NCAT layer. Following the insight of [Xu et al., 2018], the output of each NCAT layer is not only used as the input of the subsequent NCAT layer but is also concatenated with the output of other NCAT layers to form the final node embeddings. In this way, the final node embeddings can aggregate critical structures in different scales. Note that each graph has a different size; thus, the dimension of output feature will vary. Therefore, we need a pooling layer to generate graph representations that have the same dimension. In this paper, we use attribute-wise max pooling to generate a graph representation g ∈ Rd from the node embedding Z ∈ Rn×d , i.e.
Finally, the graph representation g can be input into a multilayer perceptron (MLP) to generate classification scores.
3.3 Neighbor Combinatorial AttentionModule
In the NCAT module, we intend to use an attention mechanism to weight all the substructures based on the matching degree between patterns and the corresponding substructures. The substructures with greater weights are critical structures. We formally defined the pattern of a NCAT module as a tree that contains a root and m child nodes connect to the root. For simplicity, we named parameter m as pattern size. Each node of the pattern has its feature which is parameterized with a vector pi ∈ Rd′ . All these features form the feature set P = {pi}mi=0 of the pattern. For each node u, all substructures root at u and are isomorphic with the pattern are considered. Due to the special structure of the pattern, the isomorphic substructures can be indicated by node sequences q ∈ Qm(u), i.e. sequences of neighbors of node u that has m elements. Each node qi ∈ q is corresponding to the i-th node of the pattern. To match the pattern with substructures, a projection W ∈ Rd′×(m+1)d is needed to transform the concatenated node features xq = Concat(xu, xq1 , xq2 , ..., xqm ) ∈ R(m+1)d into the target space Rd′ . The projection W can be decomposed into m + 1 projections W = [W0,W1, · · · ,Wm], where Wi ∈ Rd′×d . For simplicity, we denote the transformed feature of node v by projection Wj as hv,j = Wjxv. Then, for each substructure indicated by sequence q ∈ Qm(u), its transformed features hq can be computed by hq = Wxq = hu,0 + ∑mi=1 hqi,i. After that, the matching scores can be computed using Eq. (2), where φ(·) measures the matching degree between the pattern features and the neighbor features. The common choices for φ(·) include inner product and cosine similarity; actually, any similarity function can be used for φ(·):
Then, we can assign different weights to isomorphic substructures using the softmax in Eq. (3).
The obtained attention coefficients can be used to weight their corresponding features, and the node embedding of u can be computed as follows:
where σ(·) is an activation function (ReLU in this paper). Note that Eq. (4) can be regarded as the weighted sum of the transformed features as follows:
After calculated wv,j for node u, the computation complexity is linear w.r.t. |N(u)|. Given a larger pattern size m, the NCAT module can learn more complex critical structures, which may be important to graph classification. However, both the computational complexity and the space complexity increase as m becomes larger.
In the following, we analyze the cases m = 1, m = 2 and m ≥ 3 separately. To simplify the equations, we define ev,j = exp(φ(hv,j , pj )).
Casem= 1. In this case, the pattern consists of two nodes corresponding to center node u and a neighbor of it respectively. The Eq. (4) can be rewritten as
The denominator and numerator can be computed separately, and the computational complexity in this case is O(|E|).
Case m= 2. In this case, the pattern consists of three nodes corresponding to center node u and two neighbors of it respectively. This case is more complex than the previous case because we need to enumerate all isomorphic substructures contain two neighbors. Similar to the previous case, we split the second term of equation (4) into the denominator du and the numerator cu. Thus, the node embedding can be calculated by zu = σ(hu,0 + cu du ):
In Eq. (7) and Eq. (8), enumerating substructures of node u were reduced to a linear operation using the inclusionexclusion principle.
Case m≥ 3. For the more general case, we propose two dynamic programming algorithms to calculate the denominator du and numerator cu separately for each node u. Time complexity of our CPU version algorithm is O(2mm|E|). The GPU version algorithm we proposed is designed in parallel and its time complexity is O(3m).
3.4 Process Edge Features
Our algorithm can easily be extended to process graphs with edge features. In this case, the pattern features are extended to include edge features, which are defined by a series of vectors {pe1 , ..., pem}, where pei ∈ Rl corresponds to the edge between the center and the neighbor that matches pattern pi. The matching degree with edge features becomes
| Dataset | PROTEINS | ENZYMES | D&D | NCI1 | PTC MR | MUTAG |
|---|---|---|---|---|---|---|
| # Graphs | 1113 | 600 | 1178 | 4110 | 344 | 188 |
| Max Node | 620 | 125 | 5748 | 111 | 64 | 28 |
| Avg Node | 39.05 | 32.46 | 284.32 | 29.76 | 14.29 | 17.93 |
| Max Degree | 25 | 9 | 19 | 4 | 4 | 4 |
| # Degree | 16 | 9 | 18 | 4 | 4 | 4 |
where β and γ represent trade-offs between the node matching scores and the edge matching scores. The remaining procedures are the same as described in Section 3.3.
3.5 Connection to CNN
Images can easily be represented as graphs by treating each pixel as a node and connecting each pixel with its 8 neighbors. The node attributes are the gray levels, colors or hidden features of the pixels, and the edge attributes are the relative positions between the pixels. Thus, GCNs can process the images based on the graphs generate from them. CNNs actually match neighbor features (pixels) in a fixed receptive field with patterns (filters) under the spatial ordering. NCAT can utilize the spatial relations of pixels embedded in the edge features and perform exactly same operation in CNN.
Theorem 1. Let G be the generated graph for an image whose feature map is X. Then for any convolution operation Conv(X; ˆW) in CNNs, we have that ∀ϵ > 0 there exists a parameter setting Θ∗ , such that |Conv(X; ˆW) - NCAT (X, G; Θ∗ )| < ϵ.
Theorem 1 states that the representation ability of NCAT module is at least the same as convolution layer in CNNs.
4 Experiment
We conducted experiments on several benchmark graph classification datasets to compare the performance of NCAT with state-of-the-art kernel methods and GCN-based methods.
4.1 Graph Classification
Datasets. To evaluate our module, we chose three datasets have relatively large maximum degree and three datasets have relatively small maximum degree. All these datasets include node labels or features. Table 1 shows some basic information about those datasets. detailed information of the datasets can be found in [Yanardag and Vishwanathan, 2015].
Configurations. Our models follow the pipeline introduced in Section 3.2. We use Instance Normalization [Ulyanov et al., 2016] to perform data normalization because each graph in a batch has different structure; thus, they should be normalized individually. We adopted the Adam optimizer [Kingma and Ba, 2015] to minimize the cross-entropy loss function. Following the conventional validation approach, we performed 10-fold cross validation to evaluate the accuracy of our model. To ensure a fair comparison, we guaranteed that all 10 folds data were randomly shuffled, and the class distribution among folds did not vary. The accuracies of the compared methods are cited directly from their papers.
Baselines. We compared our NCAT module with several state-of-the-art GCN-based methods and graph kernels. The GCN-based methods we compared with including GCN[Kipf and Welling, 2017], PATCHY-SAN (PSCN) [Niepert et al., 2016], Sort Pooling (SortPool) [Zhang et al., 2018], Diff Pooling (DiffPool) [Ying et al., 2018] and Graph Capsule Convolutional Neural Network (GCAPS-CNN) [Verma and Zhang, 2018]. The graph kernel methods we compared with including Graphlet Kernel (GK) [Shervashidze et al., 2009], Random Walk Kernel (RW) [Vishwanathan et al., 2010], Weisfeiler-Lehman Subtree Kernel (WL) [Shervashidze et al., 2011], Weisfeiler-Lehman Optimal Assignment Kernel (WL-OA) [Kriege et al., 2016].
Results. Table 2 lists all the results. On the first three datasets, NCAT achieves state-of-the-art performance. These datasets contain biomolecules like proteins or enzymes, which can be represented as structure-based graph natively. By extracting their critical structures, NCAT improves the accuracy significantly. Under the same experiment setting, NCAT module outperforms conventional GCN module by 4% ∼ 5% on PROTEINS, ENZYMES and D&D. However, NCAT only achieves comparable performance with conventional GCN on the last three datasets. The maximum degree of those three datasets is relatively small, thus graphs from those datasets will contain fewer substructures and lead to the performance decline. It is worth noting that NCAT is a basic component of GCN; thus, it is possible to merge it with various methods and may result in better performances.
Running time. Theoretically, NCAT cost 2m times more FLOPS than GCN. However, m is relatively small in practice, thus will not dramatically increase the running time.
4.2 Hand-written Digits Classification
We conducted experiments on a classical image classification task: Hand-written digit classification. As shown in Figure 1, we extract the skeleton structures and transform images into graphs. First, we divide the pixels into several clusters by spectral clustering algorithm. Each cluster is treated as a node in graph and the average coordinate is treated as the node feature. Then, we linked two nodes if the pixels of the corresponding clusters are connected. The edge features are defined as the relative position between two nodes.
We build two simple models with one and two NCAT layers respectively. In this experiment, only edge features are used. As visualized in Figure 1, those models are powerful enough to learn critical structures for hand-written digits classification. The experiment results in Table 3 show that accuracy of 1-layer model and 2-layers model are comparable.
4.3 Ablation Study
In this section, we conducted ablation studies to analyze the sensitivity of the NCAT module, and the experiment results are reported in Table 4. On all the datasets, best or comparable performances were achieved when combining several sub-modules. There is no obvious trend showing that m = 1 sub-module or m = 2 sub-module is better. This result indicates that patterns with different size make different contributions to the downstream task and a better graph embedding can be aggregated by combining them. An interesting phenomenon is that best performances were achieved using a single sub-module on ENZYMES. A reasonable explanation is that the critical structures in ENZYMES are amino acid sequence, which can be represented as a chain. Thus, using m = 1 module is sufficient to extract their critical structures.
| Dataset | PROTEINS | ENZYMES | D&D | NCI1 | PTC MR | MUTAG | |
|---|---|---|---|---|---|---|---|
| Kernel | GK | 71.67 | 26.61 | 78.45 | 62.28 | 57.26 | 81.39 |
| RW | 74.22 | 24.16 | > 1 day | > 1 day | 57.85 | 79.17 | |
| WL | 74.68 | 52.22 | 79.78 | 82.19 | 57.97 | 84.11 | |
| WL-OA | 76.40 | 59.9 | 79.2 | 86.1 | 63.6 | 84.5 | |
| PSCN | 75.89 | - | 77.12 | 78.59 | 62.29 | 92.63 | |
| SortPool | 75.54 | - | 79.37 | 74.44 | 58.59 | 85.83 | |
| GNN DiffPool | 76.25 | 62.53 | 80.64 | - | - | - | |
| GCAPS-CNN | 76.40 | 61.83 | 77.62 | 82.72 | 66.01 | - | |
| GCN∗ | 72.95 | 64.33 | 74.36 | 79.95 | 64.18 | 87.81 | |
| NCAT | 79.06 | 72.33 | 81.15 | 81.36 | 65.36 | 89.51 |
| Model | GCN | NCAT1 | NCAT2 |
| Acc | 90.72 | 98.03 | 97.86 |
| Modules | ENZYMES | NCI1 | D&D |
| only m = 1 | 72.33 | 79.22 | 79.62 |
|---|---|---|---|
| only m = 2 | 70.66 | 81.29 | 80.64 |
| m ∈ {1, 2} | 68.33 | 81.36 | 81.15 |
| m ∈ {1, 2, 3} | 68.50 | 80.17 | 78.35 |
4.4 Visualization
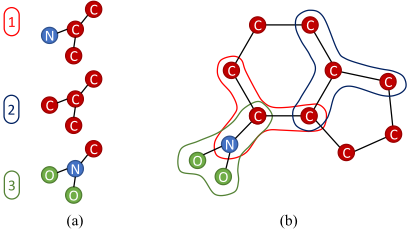
In this section, we provide a visualization of what we learned on MUTAG. This dataset consists of 188 graphs generated from aromatic or heterocyclic hydrocarbons, each node represents an atom (e.g. C, N or O) and each edge represents a chemical bond (e.g. single, double or triple). For simplicity, hydrogens are ignored. We randomly selected a sample, and visualized the top-3 important substructures for its classification (Figure 4(a)). Then, we located each substructure in the graph (Figure 4(b)) to analyze their contribution. Substructure one indicates this aromatic hydrocarbon has a radical group that contains a nitrogen, and substructure three indicates this radical group probably is a nitro group. In addition, Substructure two tells us this aromatic hydrocarbon contains at least two carbon atomic rings. all structures provide some clues for us to speculate the properties of this aromatic hydrocarbon.
5 Conclusion
In this paper, we introduced the Neighbor Combinatorial ATtention (NCAT) module for GCNs, which can find critical structures to form graph embedding for structure-based graph. We introduced the implementation of the m = 1 and m = 2 sub-modules in detail and provided a dynamic programming algorithm for general cases. NCAT achieved state-of-the-art performance on several graph classification datasets, which demonstrated its capability to form better graph embeddings. Additional experiments about handwritten digits classification are conducted to show that NCAT can find the spatial structure of the generated structure-based graph of images. We also provide ablation study and visualization to demonstrate the interpretability of our module.
Acknowledgements
This work was supported partially by NSFC (U1911401, U1811461), Guangdong Province Science and Technology Innovation Leading Talents (2016TX03X157), and Research Projects of Zhejiang Lab (No. 2019KD0AB03).
@inproceedings{ijcai2020p456,
  title     = {Neighbor Combinatorial Attention for Critical Structure Mining},
  author    = {Zuo, Tanli and Qiu, Yukun and Zheng, Wei-Shi},
  booktitle = {Proceedings of the Twenty-Ninth International Joint Conference on
               Artificial Intelligence, {IJCAI-20}},
  publisher = {International Joint Conferences on Artificial Intelligence Organization},
  editor    = {Christian Bessiere},
  pages     = {3299--3305},
  year      = {2020},
  month     = {7},
  note      = {Main track},
  doi       = {10.24963/ijcai.2020/456},
  url       = {https://doi.org/10.24963/ijcai.2020/456},
}
TY - CPAPER TI - Neighbor Combinatorial Attention for Critical Structure Mining AU - Zuo, Tanli AU - Qiu, Yukun AU - Zheng, Wei-Shi T2 - Proceedings of the Twenty-Ninth International Joint Conference on Artificial Intelligence, IJCAI-20 PB - International Joint Conferences on Artificial Intelligence Organization PY - 2020 SP - 3299 EP - 3305 DO - 10.24963/ijcai.2020/456 UR - https://doi.org/10.24963/ijcai.2020/456 ER -Copied
Machine-readable versions of this paper, for tools and AI agents:





