
Fairness-Aware Neural Rényi Minimization for Continuous Features
Proceedings of the Twenty-Ninth International Joint Conference on Artificial Intelligence. Main track. Pages 2262-2268.
https://doi.org/10.24963/ijcai.2020/313
Keywords
- Trust, Fairness, Bias: General
- Machine Learning: Deep Learning
- Machine Learning: Adversarial Machine Learning
Abstract
The past few years have seen a dramatic rise of academic and societal interest in fair machine learning. While plenty of fair algorithms have been proposed recently to tackle this challenge for discrete variables, only a few ideas exist for continuous ones. The objective in this paper is to ensure some independence level between the outputs of regression models and any given continuous sensitive variables. For this purpose, we use the Hirschfeld-Gebelein-Rényi (HGR) maximal correlation coefficient as a fairness metric. We propose to minimize the HGR coefficient directly with an adversarial neural network architecture. The idea is to predict the output Y while minimizing the ability of an adversarial neural network to find the estimated transformations which are required to predict the HGR coefficient. We empirically assess and compare our approach and demonstrate significant improvements on previously presented work in the field.
- [Agarwal et al., 2018] Alekh Agarwal, Alina Beygelzimer, Miroslav Dudik, John Langford, and Hanna Wallach. A re- ductions approach to fair classification. In ICML'18, pages 60-69, 2018.
- [Angwin et al., 2016] Julia Angwin, Jeff Larson, Surya Mattu, and Lauren Kirchner. Machine bias. ProPublica, May 23, 2016.
- [Baharlouei et al., 2019] Sina Baharlouei, Maher Nouiehed, and Meisam Razaviyayn. Rényi fair inference. CoRR, abs/1906.12005, 2019.
- [Belghazi et al., 2018] Mohamed Ishmael Belghazi, Aristide Baratin, Sai Rajeswar, Sherjil Ozair, Yoshua Bengio, Aaron Courville, and R Devon Hjelm. Mine: Mutual in- formation neural estimation, 2018.
- [Bellamy et al., 2018] Rachel K. E. Bellamy, Kuntal Dey, Michael Hind, et al. AI Fairness 360: An Extensible Toolkit for Detecting, Understanding, and Mitigating Un- wanted Algorithmic Bias. 2018.
- [Bolukbasi et al., 2016] Tolga Bolukbasi, Kai-Wei Chang, James Zou, Venkatesh Saligrama, and Adam Kalai. Man is to computer programmer as woman is to homemaker? debiasing word embeddings. In NIPS, 2016, pages 4349- 4357, 2016.
- [Chen et al., 2019] Jiahao Chen, Nathan Kallus, Xiaojie Mao, Geoffry Svacha, and Madeleine Udell. Fairness un- der unawareness: Assessing disparity when protected class is unobserved. In FAT* 2019, 2019, pages 339-348. ACM, 2019.
- [Donini et al., 2017] M. Donini, S. Ben-David, M. Pontil, and J. Shawe-Taylor. An efficient method to impose fair- ness in linear models. In NIPS Workshop on Prioritising Online Content, 2017.
- [du Pin Calmon et al., 2017] Flávio du Pin Calmon, Den- nis Wei, Karthikeyan Natesan Ramamurthy, and Kush R. Varshney. Optimized data pre-processing for discrimina- tion prevention. CoRR, abs/1704.03354, 2017.
- [Dua and Graff, 2017] Dheeru Dua and Casey Graff. UCI machine learning repository. http://archive.ics.uci.edu/ml, 2017. Link
- [Goodfellow et al., 2014] Ian Goodfellow, Jean Pouget- Abadie, Mehdi Mirza, Bing Xu, David Warde-Farley, Sherjil Ozair, Aaron Courville, and Yoshua Bengio. Gen- erative adversarial nets. In NIPS'14, pages 2672-2680. 2014.
- [Gretton et al., 2005] Arthur Gretton, Ralf Herbrich, Alexander Smola, Olivier Bousquet, and Bernhard Schölkopf. Kernel methods for measuring independence. J. Mach. Learn. Res., 6:2075-2129, December 2005.
- [Hardoon and Shawe-Taylor, 2009] David R Hardoon and John Shawe-Taylor. Convergence analysis of kernel canonical correlation analysis: theory and practice. Ma- chine learning, 74(1):23-38, 2009.
- [Hardt et al., 2016] Moritz Hardt, Eric Price, and Nati Sre- bro. Equality of opportunity in supervised learning. In NIPS'16, pages 3315-3323, 2016.
- [Kamiran and Calders, 2012] Faisal Kamiran and Toon Calders. Data preprocessing techniques for classification without discrimination. Knowledge and Information Systems, 33(1):1-33, Oct 2012.
- [Kamishima et al., 2011] Toshihiro Kamishima, Shotaro Akaho, and Jun Sakuma. Fairness-aware learning through regularization approach. In ICDM'11 Workshops, pages 643-650. IEEE, 2011.
- [Lambrecht and E. Tucker, 2016] Anja Lambrecht and Catherine E. Tucker. Algorithmic Bias? An Empirical Study into Apparent Gender-Based Discrimination in the Display of STEM Career Ads. SSRN Electronic Journal, 2016.
- [López-Paz et al., 2013] David López-Paz, Philipp Hennig, and Bernhard Schölkopf. The randomized dependence co- efficient. In NIPS 2013, pages 1-9, 2013.
- [Louppe et al., 2017] Gilles Louppe, Michael Kagan, and Kyle Cranmer. Learning to pivot with adversarial net- works. In NIPS 2017, pages 981-990, 2017.
- [Mary et al., 2019] Jeremie Mary, Clément Calauzènes, and Noureddine El Karoui. Fairness-aware learning for contin- uous attributes and treatments. In ICML'19, pages 4382- 4391, Long Beach, California, USA, 09-15 Jun 2019.
- [Pedreschi et al., 2008] Dino Pedreschi, Salvatore Ruggieri, and Franco Turini. Discrimination-aware data mining. In KDD'08, page 560, 2008.
- [Póczos et al., 2012] Barnabás Póczos, Zoubin Ghahramani, and Jeff Schneider. Copula-based kernel dependency mea- sures. In ICML'12, pages 1635-1642, 2012.
- [Rényi, 1959] Alfréd Rényi. On measures of dependence. Acta mathematica hungarica, 10(3-4):441-451, 1959.
- [Székely et al., 2009] Gábor J Székely, Maria L Rizzo, et al. Brownian distance covariance. The annals of applied statistics, 3(4):1236-1265, 2009.
- [Wadsworth et al., 2018] Christina Wadsworth, Francesca Vera, and Chris Piech. Achieving fairness through ad- versarial learning: an application to recidivism prediction. CoRR, abs/1807.00199, 2018.
- [Witsenhausen, 1975] Hans S Witsenhausen. On sequences of pairs of dependent random variables. SIAM Journal on Applied Mathematics, 28(1):100-113, 1975.
- [Zafar et al., 2017] Muhammad Bilal Zafar, Isabel Valera, Manuel Gomez Rogriguez, and Krishna P. Gummadi. Fair- ness Constraints: Mechanisms for Fair Classification. In AISTATS'17, pages 962-970, 2017.
- [Zemel et al., 2013] Rich Zemel, Yu Wu, Kevin Swersky, Toni Pitassi, and Cynthia Dwork. Learning fair represen- tations. In ICML'13, pages 325-333, 2013.
- [Zhang et al., 2018] Brian Hu Zhang, Blake Lemoine, and Margaret Mitchell. Mitigating unwanted biases with ad- versarial learning. In AIES '18, pages 335-340, 2018.
References were extracted automatically from the PDF and may contain errors.
Full text extracted automatically from the PDF; figures, tables and equations may differ. The PDF is the version of record.
1 Introduction
The use of machine learning algorithms in our day-to-day life has become ubiquitous. However, when trained on biased data, those algorithms are prone to learn, perpetuate or even reinforce these biases [Bolukbasi et al., 2016]. Because many applications have far-reaching consequences (credit rating, insurance pricing, recidivism score, etc.), there is an increasing concern in society that the use of machine learning models could reproduce discrimination based on sensitive attributes such as gender, race, age, weight, or other. In fact, many incidents of this kind have been reported in recent years. For example, an analysis software producing criminal risk scores in the United States (COMPAS) systematically discriminated against black defendants [Angwin et al., 2016]. Also, discrimination based on gender can be seen in targeted and automated online advertising for job opportunities in the Science, Technology, Engineering and Math (STEM) fields [Lambrecht and E. Tucker, 2016].
∗Contact Author
A widely applied method to achieve fairness is to simply remove any sensitive attributes from the data set [Pedreschi et al., 2008]. However, this concept, known as "fairness through unawareness", is highly insufficient because any other nonsensitive attribute might indirectly contain significant sensitive information. For example, the height of an adult could provide a strong indication about the gender.
A new research field has emerged to find solutions to this problem: fair machine learning. Its overall objective is to ensure that the prediction model is not dependent on a sensitive attribute [Zafar et al., 2017]. Most of the previously presented work focuses on discrete values. This may not hold when, for instance, the sensitive attribute is age or the output is income. Recently, one paper has discussed fair machine learning for continuous variables, approximating an upper bound of the Hirschfeld-Gebelein-R´enyi (HGR) correlation coefficient exploiting the Witsenhausen's characterization [Mary et al., 2019]. Inspired by this idea, we enhance and improve the approach with an adversarial neural network architecture which minimizes the HGR coefficient directly.
The contributions of this paper are:
- We propose a neural network architecture which minimizes the HGR coefficient with an adversarial approach. The adversarial directly approximates HGR by finding non-linear transformations of the data;
- We demonstrate empirically that our neural HGR-based approach is very competitive for fairness learning with continuous features on artificial and real-world popular data sets.
The remainder of this paper is as follows. First, Section 2 reviews papers related with our work. Section 3 introduces different definitions of fairness and metrics. Section 4 outlines the architecture of our fair adversarial HGR algorithm. Finally, Section 5 discusses the experimental results of our approach.
2 RelatedWork
Significant work has been done in the field of fair machine learning recently, in particular when it comes to quantifying and mitigating undesired bias. For the mitigation approaches, three distinct strategy groups exist.
Algorithms of the "pre-processing" group mitigate bias which exists in the training data. The ideas range from suppressing the sensitive attributes, learning fair representations, or changing class labels of the data set to reweighing or resampling the data [Kamiran and Calders, 2012; Zemel et al., 2013; Bellamy et al., 2018; du Pin Calmon et al., 2017].
The second group of mitigation strategies comprises the "in-processing" algorithms. For this type of algorithms, unwanted bias gets mitigated during the learning phase. One approach to achieve this objective is to include a fairness constraint directly in the loss function. For example, a decision boundary covariance constraint could be added to logistic regression or linear SVM algorithms [Zafar et al., 2017]. Yet another concept is adversarial debiasing, an architecture inspired by generative adversarial networks (GANs) [Goodfellow et al., 2014]. More precisely, in this approach a traditional classifier is trained to predict the label Y , while an adversarial neural network is trained at the same time with the objective to predict a sensitive attribute S [Zhang et al., 2018; Wadsworth et al., 2018; Louppe et al., 2017].
The final group of mitigation strategies are the "postprocessing" algorithms. In this approach, only the output labels of a trained classifier are adjusted. For example, by optimizing for an equalized odds objective, a Bayes predictor model can modify output labels [Hardt et al., 2016]. Another paper proposes a weighted estimator for demographic disparity which makes use of soft classification based on proxy model outputs [Chen et al., 2019]. On the one hand, postprocessing algorithms have the advantage that fair classification is achieved without the need to modify or retrain the original model. On the other hand, this concept may negatively impact the accuracy or could affect any generalization retrieved from the original classifier [Donini et al., 2017].
Most of the present work in fair machine learning focuses on categorical variables with a supervised classification problem and a binary sensitive feature. Recently, an approach for continuous variables using the Witsenhausen's characterization of the R´enyi correlation coefficient was presented [Mary et al., 2019]. They extend the work proposed by [Kamishima et al., 2011] with the minimization of an estimation of the Mutual Information (MI) for categorical variables. This algorithm is a "in-processing" fairness approach. They minimize the Hirschfeld-Gebelein-R´enyi (HGR) correlation coefficient by penalizing the χ2 divergence. However, they make a strong assumption by basing their approach on a Gaussian Kernel Distribution Estimator (KDE). This makes it difficult to generalize on all different kinds of data sets. We propose to extend this idea and make it as generalizable as possible by minimizing the HGR directly with an adversarial algorithm which is detailed in Section 4.
3 Fairness Definitions andMetrics
3.1 Continuous Fairness Objectives
Throughout this document, we consider a supervised machine learning algorithm for regression problems. The training data consists of n examples (xi, si, yi)ni=1 , where xi ∈ Rp is the feature vector with p predictors of the i-th example, si is its continuous sensitive attribute and yi its continuous outcome.
We describe below two common fairness definitions that we use in this work in the continuous setting.
Demographic Parity: One of the main objectives in fair machine learning is to ensure that the sensitive attribute S is independent of the output predictions ̂ Y : ̂ Y ⊥ S.
Compared to the most common discrete binary setting, where the demographic parity can be reduced to ensure that E[ ̂ Y |S] = E[̂ Y ] [Agarwal et al., 2018], the continuous case is more complicated since it comes down to consider distribution divergences rather than simple conditional expectations.
Equalized Residuals: A model is considered fair when the residuals ̂ Y - Y are independent from the sensitive attribute S: (Y - ̂ Y ) ⊥ S. To illustrate it, let's imagine a car insurance pricing scenario where young people have higher claims than older people. A classical pricing model would charge young people a higher premium. In the case of demographic parity, the average price must be the same across all ages. This means that older people would generally pay more than their real cost, and younger people less. In contrast, the equalized residuals setting only ensures that for all ages, the overall error does not deviate too much.
3.2 Metrics for the Continuous Setting
In order to assess these fairness definitions in the continuous case, it is essential to look at the concepts and measures of statistical dependence. There are many methods to measure the dependence between two variables. A simple way is to measure the Pearson's rho, Kendall's tau or Spearman's rank. Those types of measure have already been used in fairness, mitigating the conditional covariance for categorical variables [Zafar et al., 2017]. However, the major problem with these measures is that they only capture a limited class of association patterns, like linear or monotonically increasing functions. The Pearson correlation, for instance, only measures the linear relationship. When choosing a single nonlinear transformation such as the square function of a uniform distribution between -1 and 1, for example, this coefficient results in a theoretical correlation of 0.
Over the last few years, many non-linear dependence measures have been introduced like the Kernel Canonical Correlation Analysis (KCCA) [Hardoon and Shawe-Taylor, 2009], the Distance or Brownian Correlation (dCor) [Sz´ekely et al., 2009], the Hilbert-Schmidt Independence Criterion (HSIC and CHSIC) [Gretton et al., 2005; P´oczos et al., 2012] or the Hirschfeld-Gebelein-R´enyi (HGR) [R´enyi, 1959]. Comparing those non-linear dependence measures [L´opez-Paz et al., 2013], the HGR coefficient seems to be an interesting choice: It is a normalized measure which is capable of correctly measuring linear and non-linear relationships, it can handle multi-dimensional random variables and it is invariant with respect to changes in marginal distributions.
Definition 3.1. For two jointly distributed random variables U ∈ U and V ∈ V, the Hirschfeld-Gebelein-R´enyi maximal correlation is defined as:
1 ρ(U, V ) := Cov(U;V ) σUσV , where Cov(U; V ), σU and σV are the covariance between U and V , the standard deviation of U and the standard deviation of V , respectively.
where ρ is the Pearson linear correlation coefficient 1 with some measurable functions f and g.
The HGR coefficient is equal to 0 if the two random variables are independent. If they are strictly dependent the value is 1. The dimensional spaces for the functions f and g are infinite. This property is the reason why the HGR coefficient proved difficult to compute.
In information theory literature, the Witsenhausen's characterization [Witsenhausen, 1975] proposes a simple approximation of the HGR coefficient for discrete features. It demonstrates the possibility to estimate this coefficient directly by the calculation of the second largest value of a specific matrix (Q below). It is briefly described in the following:
Theorem 1. Let U and V be discrete variables and the matrix Q be defined as follows:
Where PU,V is the joint distribution of U and V , PU and PV are the corresponding marginal distributions. Under mild conditions [Witsenhausen, 1975]:
where σ2 is the second largest singular value of a matrix.
It was shown that such a calculation of the HGR coefficient can be used as fairness constraint for discrete variables [Baharlouei et al., 2019]. For continuous variables, however, this proved difficult. An approximation can be done with strong assumptions such that the matrix Q is viewed as the kernel of a linear operator on L2 (dPUdPV ) [Witsenhausen, 1975]. This approximation has been used with Kernel density estimation (KDE) as a fairness metric by [Mary et al., 2019]. We will refer to this metric in our experiments as HGR KDE. Another way to approximate this coefficient is to require that f and g belong to Reproducing Hilbert Kernel's spaces (RKHS) by taking the largest canonical correlation between two sets of copula random projections. This has been done efficiently under the name of Randomized Dependency Coefficient (RDC) [L´opez-Paz et al., 2013]. We will make use of this approximated metric as HGR RDC.
4 Neural HGRMinimization for Fairness
As explained in Section 3, the HGR coefficient can be leveraged for fairness learning. However, it's direct use for training fair models is difficult, especially for the continuous case, since it requires the optimization of the second largest singular value of an estimated matrix Q (in the case of HGR KDE), or the computation of random non-linear projections and the estimation of copula transformations (in the case of HGR RDC), at each step of the learning process.
In this paper, we propose a novel neural HGR-based cost for fairness in the continuous setting, that can be mitigated in the following generic optimization problem:
where L is the regression loss function (the mean squared error in our experiments) between the output hφ(X) ∈ R and the corresponding target Y , with hφ a neural network with parameters φ, and Ψ(U, V ) is a correlation loss between two variables defined as:
The aim is thus to find a mapping hφ(X) which both minimizes the deviation with the expected target Y and does not imply too much dependency of U with the sensitive S, according to its definition for the desired fairness objective. The hyperparameter λ controls the impact of the correlation loss in the optimization. The correlation loss Ψ could correspond to a Pearson coefficient, a Mutual Information Neural Estimation (MINE [Belghazi et al., 2018]), or HGR neural estimators proposed in the following of this section. In any case, the objective function is optimized via stochastic gradient descent.
4.1 HGR Estimation via Neural Network
Our proposed approach is to estimate the HGR coefficient with neural networks. For this, we use two inter-connected neural networks to approximate the optimal transformations functions f and g from 2. Let fθf and gθg be two neural networks with respective parameters θf and θg. The estimation of HGR can be written as the following maximization problem:
with ˆ fθf and ˆ gθg the respective standardization of outputs from fθf and gθg according to PU and PV :
where mf (resp. mg) is the expectation EU[fθf (U)] (resp. EV [gθg (V )]) and σ2 f (resp. σ2 g ) is the variance EU [fθf (U)2 ]- EU [fθf (U)]2 (resp. EV [gθg (V )2 ]-EV [gθg (V )]2 ) of f (resp. g) w.r.t. PU (resp. PV ). The standardization of outputs from fθf and gθg allows us to ensure the constraints on f and g in (2).
Algorithm 1 depicts the optimization process of 6. Until convergence, it samples instantiations of (U, V ) from PU,V (or from a training set of data) to form mini-batches. At each iteration, it computes expectation and variance estimators of fθf and gθg on the current batch. These estimators are used to standardize the outputs of both neural networks on the batch.
Algorithm 1 HGR Estimation by Neural Network
Input: Distributions PU,V , Neural Networks fθf and gθg , Input: Batchsize b, Learning rates αf , αg
repeat
Draw b samples from the joint distribution:
Calculate the average and variance of the transformation predictions:
Maximize the following objective function J by gradient ascent:
Finally, it updates the parameters of both networks by gradient ascent on the objective function to maximize J(θf , θg). Note that the gradients are computed by back-propagating not only through the output values of θf and θg but also through means and variances of the batch, to ensure convergence. At the end, the HGRΘ(U, V ) estimator can be computed by considering the expectation of the products of standardized outputs of both networks.
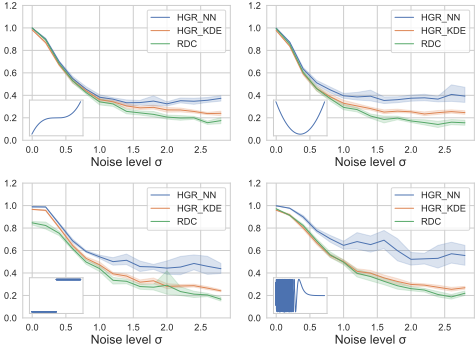
This neural estimator HGRΘ(U, V ) is a lower-bound of HGR(U, V ) (at least on the training data set). However, as experimentally shown in figure 1, our estimator gives very accurate approximations in various settings. For these experiments, we produced artificial data (U, V ) with non-linear dependencies. Four data sets were generated by instantiating U with samples drawn from a uniform distribution U(-10; 10) and defining V according to a non-linear transformation of U: V = F(U) + ϵ, with F a given association pattern and ϵ ∼ N(0, σ2 ) a random noise added to V . Each sub-figure in Fig.1 corresponds to a data set generated according to the association pattern plotted in the small box in its left corner (500 pairs (U, V ) were generated for each data set). Note that for each of the scenarios, the linear correlation between U and V is 0, but the HGR coefficient is theoretically equal to 1 when no noise is added to the transformation (when σ2 = 0). The aim is to assess the ability of the HGR estimators to recover the HGR value, despite some complex association patterns and some noise in the data. We compare the HGR estimation values for HGR KDE, HGR RDC and our estimator HGR NN, for which we consider neural networks f and g of three layers, each including ten units with tanh activation function and Xavier initialization.
Results show that, when no noise is added to the data, HGR KDE and HGR RDC have difficulties to recover the optimal transformations on the two last scenarios in which the relationship is either not continuous or highly unsteady. Thanks to the higher freedom provided by the use of neural networks, HGR NN succeeds in retrieving a HGR of 1 for these settings. When noise is added to the data, the true HGR
coefficient could be lower than 1. We thus assess the ability of the estimators to approach the HGR value that would be induced by optimal transformations f and g on the data. Note that our approach cannot exceed its value, due to the use of a restricted set of neural transformation functions. From the figure, we observe that the curve of HGR NN is always the highest (thus the closest to the optimal value from the data), and that the difference between our approach and the others increases with noise. HGR NN appears more robust to noise. Additional experiments on the power of dependence of our estimator have also shown that our estimator is usually more efficient than its competitors for discerning dependent from independent samples in various settings.
4.2 Fairness via Neural HGR
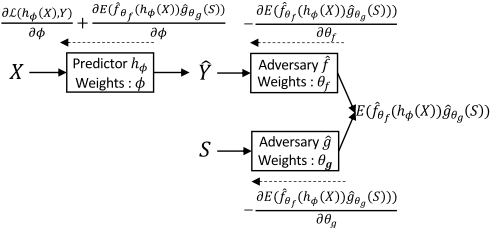
Our neural HGR estimator is thus a good candidate for standing as the adversary Ψ(U, V ) to plug in the global regression objective (5). Figure 2 gives the full architecture of our adversarial learning algorithm using the neural HGR estimator for demographic parity. It depicts the prediction function hφ, which outputs ̂ Y from X, and the two neural networks fθf and gθg , which seek at defining the more strongly correlated transformations of ̂ Y and S. Left arrows represent gradient back-propagation. The learning is done via stochastic gradient, alternating steps of adversarial maximization and global loss minimization. The algorithm 2 depicts our Fair HGR NN algorithm for the Demographic Parity task. The algorithm takes as input a training set from which it samples batches of size b at each iteration. At each iteration it first standardize the output scores of networks fθf and gθg to ensure 0 mean and a variance of 1 on the batch. Then it computes the objective function to maximize to estimate the HGR score and the global regression objective. Finally, at the end of each iteration, the algorithm updates the parameters of the adversary θf and θg by one step of gradient ascent and the regression parameters φ by one step of gradient descent. Back-propagation is performed on the full architecture, including means and variance calculations, to avoid oscillations.
Algorithm 2 Fair HGR NN for Demographic Parity
Input: Training set T , Loss function L, Batchsize b,
Input: Neural Networks hφ, fθf and gθg , Input: Learning rates αf , αg and αh, Fairness control λ Repeat Draw b samples (x1, s1, y1), ..., (xb, sb, yb) from T Calculate the mean and variance of the transformations: mf ← 1b ∑bi=1 fθf (hφ(xi)) ; mg ← 1b ∑bi=1 gθg (si) σ2 f ← 1b ∑bi=1 (fθf (hφ(xi)) - mf )2 σ2 g ← 1b ∑bi=1 (gθg (si) - mg )2 Standardize the transformations: ∀i : ˆ fθf (hφ(xi)) ← fθf (hφ(xi))-mf √σ2 f +ϵ ∀i : ˆ gθg (si) ← gθg (si)-mg √σ2 g +ϵ Compute the objectives: J(θf , θg) = 1b ∑bi=1 ˆ fθf (hφ(xi)) ∗ ˆ gθg (si) L(φ, θf , θg) = 1b ∑bi=1 L(hφ(xi), yi) + λJ(θf , θg) Update the adversary by gradient ascent: θf ← θf + αf ∂J(θf ,θg ) ∂θf ; θg ← θg +αg ∂J(θf ,θg ) ∂θg Update the predictor model hφ by gradient descent: φ ← φ - αh( ∂L(φ,θf ,θg ) ∂φ )5 Empirical Results
5.1 Synthetic Scenario
In order to test the efficiency of our algorithms, we set up a simple toy scenario. The subject is a pricing algorithm for a fictional household insurance policy. The goal of this exercise is to achieve demographic parity by producing a fair predictor which estimates the average cost without incorporating any bias against the policyholder's age. We want to compare our proposed algorithms (Fair HGR NN with a classical neural network called Standard NN). We create three explicit variables: Age of the policyholder, total surface and age of the building. We consider the policyholder's age as sensitive attribute and we construct the average cost variable Y with the last two variables only (without the sensitive variable). To evaluate this, we create the target variable Y with an exponential function which takes into account the two explicit variables mentioned above. The surface variable is a polynomial transformation of age. This transformation is chosen such that no linear correlation exists between surface and age
(Pearson correlation = 0.00). On the other hand, it is expected that the HGR coefficient will be non-zero for the Standard NN (estimated to 62%). We report below details on the distributions used in this synthetic scenario:
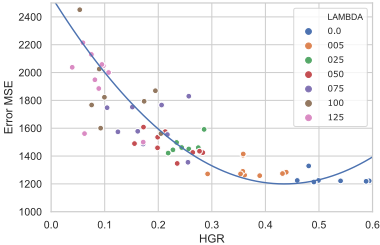
In order to solve this problem and, thus, to minimize the non-linear dependence between the age and the predictions we execute different scenario and use specific hyperparameters λ for each of them. For each scenario, we repeat five experiments by randomly sampling two subsets, 70% for the training set and 30% for the test set. The choice of this value depends on the main goal, resulting in a trade-off between accuracy and fairness. In figure 3, we see clearly that higher values of λ produce fairer predictions, while a specific hyperparameter λ near 0 allows to only focus on optimizing the predictor loss. We note a MSE error gap of 700 between λ = 0 and λ = 125. Choosing λ between 25 and 50 appears to be an interesting choice for this scenario.
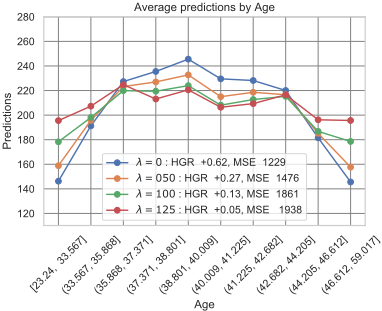
In Figure 4, the blue curves represent the predictions of the Standard NN. The quadratic link between the prediction and the sensitive attribute age can be easily observed. As expected, increasing the lambda leads to predictions almost stable, around a price of about 226 euros.
5.2 Real-world Experiments
Our experiments on real-world data are performed on the three following data sets:
- The US Census demographic data set is an extraction of the 2015 American Community Survey, with 37 features about 74,000 census tracts. The target is the percentage of children below the poverty line, the sensitive attribute is the percentage of women in the census tract.
- The Motor Insurance dataset originates from a pricing game organized by The French Institute of Actuaries in
| Demographic Parity | Equalized Residuals | ||||||||||
|---|---|---|---|---|---|---|---|---|---|---|---|
| MSE | HGR NN | HGR KDE | HGR RDC | FairQuant | MSE | HGR NN | HGR KDE | HGR RDC | FairQuant | ||
| US Census Motor | Standard NN Fair HGR NN Mary2019 [Mary et al., 2019] Fair MINE NN Standard NN Fair HGR NN Mary2019 [Mary et al., 2019] | 0.274 ± 0.003 0.526 ± 0.042 0.541 ± 0.015 0.537 ± 0.046 0.945 ± 0.011 0.971 ± 0.004 0.979 ± 0.119 | 0.212 ± 0.094 0.057 ± 0.011 0.075 ± 0.013 0.058 ± 0.042 0.201 ± 0.094 0.072 ± 0.029 0.077 ± 0.023 0.078 ± 0.013 | 0.181± 0.00 0.046 ± 0.030 0.061 ± 0.006 0.048 ± 0.029 0.175 ± 0.0 0.058 ± 0.052 0.059 ± 0.014 | 0.217 ± 0.004 0.042 ± 0.038 0.078 ± 0.013 0.045 ± 0.037 0.200 ± 0.034 0.066 ± 0.009 0.067 ± 0.028 0.069 ± 0.009 | 0.059 ± 0.00 0.008 ± 0.015 0.019 ± 0.004 0.012 ± 0.016 0.008 ± 0.011 0.006 ± 0.02 0.006 ± 0.002 0.004 ± 0.001 | 0.274 ± 0.003 0.334 ± 0.021 0.408 ± 0.004 0.406 ± 0.021 0.945 ± 0.015 0.991 ± 0.021 1.019 ± 0.01 1.024 ± 0.017 | 0.157 ± 0.006 0.068 ± 0.019 0.092 ± 0.017 0.083 ± 0.017 0.145 ± 0.005 0.102 ± 0.007 0.111 ± 0.007 0.121 ± 0.022 | 0.098 ± 0.002 0.053 ± 0.04 0.049 ± 0.003 0.055 ± 0.017 0.102 ± 0.038 0.082 ± 0.008 0.079 ± 0.005 0.091 ± 0.007 | 0.122 ± 0.002 0.055 ± 0.046 0.063 ± 0.005 0.082 ± 0.015 0.123 ± 0.041 0.092 ± 0.009 0.098 ± 0.005 0.092 ± 0.005 | 0.008 ± 0.001 0.003 ± 0.002 0.009 ± 0.001 0.008 ± 0.006 0.075 ± 0.006 0.011 ± 0.015 0.015 ± 0.011 0.031 ± 0.009 |
| Crime | Fair MINE NN Standard NN Fair HGR NN Mary2019 [Mary et al., 2019] Fair MINE NN | 0.982 ± 0.003 0.384 ± 0.012 0.781 ± 0.016 0.778 ± 0.103 0.782 ± 0.034 | 0.732 ± 0.013 0.356 ± 0.063 0.371 ± 0.116 0.395 ± 0.097 | 0.068 ± 0.004 0.525 ± 0.013 0.097 ± 0.022 0.115 ± 0.046 0.110 ± 0.022 | 0.731 ± 0.009 0.171 ± 0.03 0.177 ± 0.054 0.201 ± 0.021 | 0.353 ± 0.006 0.039± 0.008 0.064 ± 0.023 0.136 ± 0.012 | 0.384 ± 0.024 0.583 ± 0.044 0.579 ± 0.074 0.583 ± 0.054 | 0.472 ± 0.036 0.382 ± 0.089 0.381 ± 0.097 0.413 ± 0.15 | 0.244 ± 0.01 0.151 ± 0.017 0.152 ± 0.035 0.161 ± 0.027 | 0.440 ± 0.011 0.222 ± 0.045 0.221 ± 0.068 0.232 ± 0.018 | 0.047 ± 0.004 0.028 ± 0.006 0.048 ± 0.035 0.052 ± 0.013 |
2015, with 15 attributes for 36,311 observations. The target is the average claim cost of per policy, the sensitive attribute is the driver's age.
- The Crime dataset is obtained from the UCI Machine Learning Repository [Dua and Graff, 2017], with 128 attributes for 1,994 instances. The target is the number of violent crimes per population, the sensitive attribute is the ratio of an ethnic group per population.
For all data sets, we repeat five experiments by randomly sampling two subsets, 80% for the training set and 20% for the test set. Finally, we report the average of the mean squared error (MSE), and the mean of the fairness metrics HGR NN, HGR KDE, HGR RDC from the test set. Since none of these fairness measures are fully reliable (they are only estimations which are used by the compared models), we also introduce a metric based on discretization of the sensitive attribute. This FairQuant metric splits the test samples in 50 quantiles with regards to the sensitive attribute, in order to obtain sample groups of the same size. For each of them, we compute the mean of h(X) for demographic parity, and h(X)-Y for equalized residuals. Finally, FairQuant equals the mean absolute difference between the global average and the means computed in each quantile (e.g., for demographic parity, FairQuant = 1 50 ∑50 i=1 |mi -m|, with mi the mean of h(X) in the i-th quantile and m its mean on the full test set). As a baseline, we use a classic, "unfair" deep neural network, Standard NN. We compare with a similar approach that would use mutual information rather than HGR in our framework (see section 4) and with Mary2019 [Mary et al., 2019] 2 which suggests relaxing the calculation of the HGR by using a χ2 divergence upper bound (by KDE estimation).
For each algorithm and for each data set, we obtain the best hyperparameters by grid search in five-fold cross validation (specific to each of them). Depending on the task, we parameterized the number of layers between 3 and 5 and between 8 and 32 for the number of units. We used Tanh activation functions, Dropout and Xavier initialization. The considered regression loss is MSE. Notice, we applied a mean normalization to the different outcome true value. Results of our experiments can be found in Table 1. For all of them, we attempted to obtain comparable results by giving similar accuracy of the models (MSE) in a same setting, via the hyperparameter λ of our models that allows us to balance the relative importance of accuracy and fairness while learning. As expected, the baseline, Standard NN, is the best predictor but also the most biased one. It achieves the lowest prediction errors and ranks amongst the highest and thus worst values for all fairness measures throughout all data sets and tasks.
For demographic parity, Fair HGR NN achieves on the three datasets the best level of fairness assessed by HGR estimation and FairQuant. It is also better in terms of MSE, except on the Crime data set where the approach by Mary2019 [Mary et al., 2019] 2 gets slightly better results but with a very high volatility. This volatility can also be observed on the Motor dataset. It can be attributed to the fact that these two datasets are the smallest ones: the small amount of data seems to make it difficult to estimate the chi-square by KDE.
For equalized residuals, Fair HGR NN achieves the lowest values for the metric FairQuant for all three data sets (like for demographic parity). The approach from Mary2019 [Mary et al., 2019] 2 performs slightly worse. For MINE, except on the UC Census data set, it achieves worse results in fairness and accuracy. Globally, our neural approach Fair HGR NN, appears to be very competitive in every setting.
6 Conclusion
We developed a new adversarial learning approach to produce fair continuous predictions with a continuous sensitive attribute. We propose to mitigate a neural estimation of the HGR correlation of the model outputs with the sensitive attributes. This method proved to be very efficient for two fairness objectives on various artificial and real-world data sets.
@inproceedings{ijcai2020p313,
  title     = {Fairness-Aware Neural Rényi Minimization for Continuous Features},
  author    = {Grari, Vincent and Lamprier, Sylvain and Detyniecki, Marcin},
  booktitle = {Proceedings of the Twenty-Ninth International Joint Conference on
               Artificial Intelligence, {IJCAI-20}},
  publisher = {International Joint Conferences on Artificial Intelligence Organization},
  editor    = {Christian Bessiere},
  pages     = {2262--2268},
  year      = {2020},
  month     = {7},
  note      = {Main track},
  doi       = {10.24963/ijcai.2020/313},
  url       = {https://doi.org/10.24963/ijcai.2020/313},
}
TY - CPAPER TI - Fairness-Aware Neural Rényi Minimization for Continuous Features AU - Grari, Vincent AU - Lamprier, Sylvain AU - Detyniecki, Marcin T2 - Proceedings of the Twenty-Ninth International Joint Conference on Artificial Intelligence, IJCAI-20 PB - International Joint Conferences on Artificial Intelligence Organization PY - 2020 SP - 2262 EP - 2268 DO - 10.24963/ijcai.2020/313 UR - https://doi.org/10.24963/ijcai.2020/313 ER -Copied
Machine-readable versions of this paper, for tools and AI agents:





