
PRoFET: Predicting the Risk of Firms from Event Transcripts
Proceedings of the Twenty-Eighth International Joint Conference on Artificial Intelligence. Main track. Pages 5211-5217.
https://doi.org/10.24963/ijcai.2019/724
Keywords
- Multidisciplinary Topics and Applications: Finance
- Natural Language Processing: Natural Language Processing
Abstract
Financial risk, defined as the chance to deviate from return expectations, is most commonly measured with volatility. Due to its value for investment decision making, volatility prediction is probably among the most important tasks in finance
and risk management. Although evidence exists that enriching purely financial models with natural language information can improve predictions of volatility, this task is still comparably underexplored. We introduce PRoFET, the first neural model for volatility prediction jointly exploiting both semantic language representations and a comprehensive set of financial features. As language data, we use transcripts from quarterly recurring events, so-called "earnings calls"; in these calls, the performance of publicly traded companies is summarized and prognosticated by their management. We show that our proposed architecture, which models verbal context with an attention mechanism, significantly outperforms the previous state-of-the-art and other strong baselines. Finally, we visualize this attention mechanism on the token-level, thus aiding interpretability and providing a use case of PRoFET as a tool for investment decision support.
- [Andersen et al., 2006] Torben G. Andersen, Tim Bollerslev, Peter F. Christoffersen, and Francis X. Diebold. Volatil- ity and Correlation Forecasting. In G. Elliot, C. W. J. Granger, and A. Timmermann, editors, Handbook of Eco- nomic Forecasting, chapter 15, pages 778-878. North- Holland, Amsterdam, 2006.
- [Anscombe, 1973] Francis J. Anscombe. Graphs in Statis- tical Analysis. The American Statistician, 27(1):17-21, 1973.
- [Bahdanau et al., 2015] Dzmitry Bahdanau, Kyunghyun Cho, and Yoshua Bengio. Neural Machine Translation by Jointly Learning to Align and Translate. In Proceedings of ICLR, 2015.
- [Baroni et al., 2014] Marco Baroni, Georgiana Dinu, and Germán Kruszewski. Don't Count, Predict! A Systematic Comparison of Context-Counting vs. Context-Predicting Semantic Vectors. In Proceedings of ACL, pages 238-247, 2014.
- [Blair et al., 2001] Bevan J. Blair, Ser-Huang Poon, and Stephen J. Taylor. Forecasting S&P 100 Volatility: The In- cremental Information Content of Implied Volatilities and High-Frequency Index Returns. Journal of Econometrics, 105(1):5-26, 2001.
- [Bojanowski et al., 2017] Piotr Bojanowski, Edouard Grave, Armand Joulin, and Tomas Mikolov. Enriching Word Vec- tors with Subword Information. Transactions of ACL, 5:135-146, 2017.
- [Bollerslev, 1986] Tim Bollerslev. Generalized Autoregres- sive Conditional Heteroskedasticity. Journal of Economet- rics, 31(3):307-327, 1986.
- [Duan et al., 2018] Junwen Duan, Xiao Ding, and Ting Liu. Learning Sentence Representations over Tree Structures for Target-Dependent Classification. In Proceedings of NAACL, pages 551-560, 2018.
- [Duchi et al., 2010] John C. Duchi, Elad Hazan, and Yoram Singer. Adaptive Subgradient Methods for Online Learn- ing and Stochastic Optimization. In Proceedings of COLT, pages 257-269, 2010.
- [Fama and French, 1993] Eugene F. Fama and Kenneth R. French. Common Risk Factors in the Returns on Stocks and Bonds. Journal of Financial Economics, 33(1):3-56, 1993.
- [Fama and French, 1997] Eugene F. Fama and Kenneth R. French. Industry Costs of Equity. Journal of Financial Economics, 43(2):153-193, 1997.
- [Hansen and Lunde, 2005] Peter R. Hansen and Asger Lunde. A Forecast Comparison of Volatility Models: Does Anything Beat a GARCH(1,1)? Journal of Applied Econometrics, 20(2):873-889, 2005.
- [Hochreiter and Schmidhuber, 1997] Sepp Hochreiter and Jürgen Schmidhuber. Long Short-Term Memory. Neural Computation, 9(8):1735-1780, 1997.
- [Ioffe and Szegedy, 2015] Sergey Ioffe and Christian Szegedy. Batch Normalization: Accelerating Deep Network Training by Reducing Internal Covariate Shift. In Proceedings of ICML, pages 448-456, 2015.
- [Kogan et al., 2009] Shimon Kogan, Dimitry Levin, Bryan R. Routledge, Jacob S. Sagi, and Noah A. Smith. Predicting Risk from Financial Reports with Regression. In Proceedings of NAACL, pages 272-280, 2009.
- [Larcker and Zakolyukina, 2012] David F. Larcker and Anastasia A. Zakolyukina. Detecting Deceptive Dis- cussions in Conference Calls. Journal of Accounting Research, 50(2):494-540, 2012.
- [Linzen et al., 2018] Tal Linzen, Grzegorz Chrupała, and Afra Alishahi. Introduction. In Proceedings of the 2018 EMNLP Workshop BlackBoxNLP, 2018.
- [Loughran and McDonald, 2011] Tim Loughran and Bill McDonald. When Is a Liability Not a Liability? Tex- tual Analysis, Dictionaries, and 10-Ks. The Journal of Finance, 66(1):35-65, 2011.
- [Loughran and McDonald, 2016] Tim Loughran and Bill McDonald. Textual Analysis in Accounting and Finance: A Survey. Journal of Accounting Research, 54(4):1187- 1230, 2016.
- [Nair and Hinton, 2010] Vinod Nair and Geoffrey E. Hinton. Rectified Linear Units Improve Restricted Boltzmann Ma- chines. In Proceedings of ICML, 2010.
- [Price et al., 2012] S. McKay Price, James S. Doran, David R. Peterson, and Barbara A. Bliss. Earnings Confer- ence Calls and Stock Returns: The Incremental Informa- tiveness of Textual Tone. Journal of Banking and Finance, 36(4):992-1011, 2012.
- [Rekabsaz et al., 2017] Navid Rekabsaz, Mihai Lupu, Artem Baklanov, Allan Hanbury, Alexander Duer, and Linda An- derson. Volatility Prediction Using Financial Disclosures Sentiments with Word Embedding-Based IR Models. In Proceedings of ACL, pages 1712-1721, 2017.
- [Tsai and Wang, 2014] Ming-Feng Tsai and Chuan-Ju Wang. Financial Keyword Expansion via Continuous Word Vector Representations. In Proceedings of EMNLP, pages 1453-1458, 2014.
- [Wang and Hua, 2014] William Yang Wang and Zhenhao Hua. A Semiparametric Gaussian Copula Regression Model for Predicting Financial Risks from Earnings Calls. In Proceedings of ACL, pages 1155-1165, 2014.
- [Wang et al., 2013] Chuan-Ju Wang, Ming-Feng Tsai, Tse Liu, and Chin-Ting Chang. Financial Sentiment Analy- sis for Risk Prediction. In Proceedings of IJCNLP, pages 802-808, 2013.
- [Xu and Cohen, 2018] Yumo Xu and Shay B. Cohen. Stock Movement Prediction from Tweets and Historical Prices. In Proceedings of ACL, pages 1970-1979, 2018.
References were extracted automatically from the PDF and may contain errors.
Full text extracted automatically from the PDF; figures, tables and equations may differ. The PDF is the version of record.
1 Introduction
Financial risk, most commonly measured with volatility, is one of the most prominent drivers of company value; its accurate assessment plays a key role in making investment decisions. Consequentially, assessing and predicting volatility is probably among the most important tasks in finance and risk management [Andersen et al., 2006, p. 789].
Despite their natural applications in finance (e.g. algorithmic trading), solutions for volatility prediction do not only benefit this domain. Rather, they hold merit across all settings in which the effect of newly disclosed language information on public perceptions of risk needs to be quantified. Such settings include for example crisis management or social media analysis. On a general level, tools for volatility prediction have proven useful for tasks as manifold as presidential approval prediction, weather forecasting, and neuro-muscular activation modeling [Andersen et al., 2006].
Traditionally, financial risk prediction has solely been based on historic financial data. As of recently however, an increasing number of finance papers also analyzes textual data, for example by quantifying the sentiment of financial disclosures. 1 Perhaps not surprisingly, risk prediction has also started to attract interest in the Natural Language Processing (NLP) community. Leveraging the content of financial disclosures, a small but growing number of papers performs a text-based prediction of volatility [Wang et al., 2013; Tsai andWang, 2014, inter alia].
In this paper, we combine established knowledge from the financial domain with recent advancements in NLP to create PRoFET, the first neural model jointly exploiting financial and textual data for volatility prediction. We collect a comprehensive set of historic financial data and enrich it with natural language information revealed in recurring events, socalled earnings calls; in these calls, the performance of publicly traded companies is summarized and prognosticated by their management. We then train a joint model to predict short-term risk following these calls.
Earnings calls are a rather underexplored type of disclosure for risk prediction-despite their unique and interesting properties: After a scripted presentation by the company management, they contain an open questions-and-answers session, in which banking analysts can pose challenging questions to the executives. Hence, different to already well-explored disclosures like the uniform and formal annual report 10-K, this allows for an unscripted, spontaneous interaction [Larcker and Zakolyukina, 2012] of high authenticity.
Introducing PRoFET, we present the following contributions to the academic community:
Model. Our neural architecture, which jointly learns from semantic text representations and a comprehensive set of financial features, significantly outperforms the previous state-ofthe-art and other baselines. In an ablation study, we further show that the joint model significantly outperforms models using either of both feature types alone and inspect the performance impact of different document sections.
Data. We present a new dataset of 90K earnings call transcripts and address the task of text-based risk prediction at a large scale.
1 See e.g. Loughran & McDonald [2016] for an overview.
Interpretability. The performance increases provided by neural models often come at the cost of interpretability. We address this issue by visualizing the predictive power of contextualized tokens with a heatmap. This demonstrates a use case of PRoFET as a tool for investment decision support.
2 RelatedWork
Stock movement prediction-a related, yet distinct task to volatility prediction-has attracted increasing interest in the NLP community. Most recently, Xu & Cohen [2018] present a deep generative model for a binary classification of stock price movement based on tweets and historic prices. Duan et al. [2018] learn sentence representations over tree structures for a binary classification task of stock return movement in reaction to financial news. Note that different to these studies, we perform the prediction of a continuous feature, i.e. a regression. Furthermore, we predict volatility (the possible spread of returns) instead of price or return movement.
More closely aligned with our task, Kogan et al. [2009] collect a corpus of 60K annual reports 10-K and predict stock return volatility in the year after the filing date with a linear Support Vector Regression (SVR). They report a significant performance increase of a model incorporating bags-ofwords over a baseline consisting only of the volatility in the preceding year. Wang et al. [2013] use the same dataset and regression model; however, they perform a sentiment analysis task using the Loughran & McDonald [2011] lexicon.
Tsai &Wang [2014] increase the performance by extending the lexicon with similar terms retrieved from word embedding models. Rekabsaz et al. [2017] further improve upon this by contrasting different term weighting and feature fusion methods; in addition to past volatility, they consider a GARCH model, and a sector variable. Note that all of these studies, although predicting volatility, investigate annual report 10-K which differs largely from earnings calls in terms of form (formal, written instead of spontaneous, spoken language) and content (legally required vs. voluntary and lessrestricted information). Furthermore, given their focus on NLP, these papers include no or only few financial features.
Wang & Hua [2014] explore a prediction of stock return volatility using earnings call transcripts. They use a semiparametric Gaussian copula to predict the volatility in the week following the call and consider uni-/bigrams, POS tags, NE tags as well as frame-level semantic annotations. They show a significant performance increase of the Gaussian copula over the second-best model, a linear regression.
We present a new dataset of 90K calls and thus re-assess this task at a large scale. Moreover, we propose a model jointly learning from both semantic text representations and a comprehensive set of financial features. Given the advancements of neural networks and their capabilities in automatic feature learning [Baroni et al., 2014], we were motivated to apply such methods instead of a traditional, featureengineered approach. Lastly, since performance gains by neural networks have "typically come at the cost of our understanding of the system" [Linzen et al., 2018, p. iii], we were interested in obtaining humanly interpretable results by visually explaining volatility fluctuations in a sample use case.
| Part | # Sentences | # Tokens |
|---|---|---|
| Presentation | 12.5M | 276.3M |
| Q&A | 22.6M | 398.9M |
| Total | 35.1M | 675.2M |
| Per document | 0.4K | 7.7K |
3 Dataset
We collect 90K earnings call transcripts from the database Thomson Reuters Eikon. 2 The data covers ca. 4.3K distinct companies and spans the years 2002-2017. The approximate numbers of tokens and types are 675M and 200K, respectively. We divide all transcripts into the Presentation and the Questions-and-Answers (Q&A) section; Table 1 describes this dataset in terms of surface features. As can be seen, the average transcript contains 400 sentences and 7.7K tokens.
We retrieve all utterances except technical remarks (e.g. closing the call) by the teleconference Operator and tokenize the documents with SpaCy. We identify dates, points of time, percentages, monetary values, measurements (as of weight or distance), and cardinal numbers with SpaCy's named entity recognizer and replace them with uniform placeholder tokens, e.g. "{PERCENTAGE}" or "{CARDINAL}". Since the transcribed text data is intellectual property of Thomson Reuters, we are legally not allowed to share it in its raw form. However, our word embedding models and the financial data (as defined in Section 4) can be found online. 3
To prevent look-ahead bias, we use a temporal 80/10/10 percentage split to divide the 90K instances into separate training, validation, and test sets. The training data spans from Jan. 2002 to Aug. 2015, validation from Aug. 2015 to Nov. 2016, and test from Nov. 2016 to Dec. 2017.
4 Methodology
Given a firm's transcript and a set of financial features, we perform the prediction of a continuous label (volatility) in the week following the firm's earnings call.
4.1 Label: Volatility
Volatility, the most common financial risk measure, indicates the possible spread of stock prices or returns. Concisely put, a "stock will have a high volatility when its price fluctuates widely and a low volatility when its price stays more or less constant" [Kogan et al., 2009, p. 273]. Volatility is defined as follows: Let rt = pt pt-1 - 1 be the return of a stock with price pt on day t. Then the volatility between days t and t + τ is the sample standard deviation of stock returns in this period:
2 https://eikon.thomsonreuters.com/index.html
3 https://www.uni-mannheim.de/dws/people/researchers/ phd-students/christoph-kilian-theil/
Here, ¯ r is the sample mean of rt over the period. We use the volatility v[1,5] in the business week after the call as label.
4.2 Features
Our model jointly learns from various textual and financial features which are defined as outlined below.
Textual Features
We segment the transcripts into three sections: presentation, questions, and answers. Each of these sections is represented by a vector t, i.e. tP, tQ, tA: the tokens w1,w2, ...,wn of the transcript sections are represented with embeddings w(1) , w(2) , ..., w(n) , and two distinct model variants compose those tokens in into a representation t (see Section 4.3). Word embeddings with dimensions d ∈ {100, 200} are trained with fastText [Bojanowski et al., 2017] on our dataset of 90K transcripts, 675M tokens, and 200K types.
Financial Features
For each call, we retrieve a comprehensive set of financial features. If not stated otherwise, we obtain all data from the databases CRSP and CRSP/Computstat Merged which we access via the WRDS platform. 4
Past volatility should expectedly be a strong predictor of future volatility [Kogan et al., 2009], which is why we add the volatility v[-64,-1] (see Eq. 1) in the business quarter before the call as feature.
Market volatility as aggregated by the CBOE Volatility Index (VIX), 5 has been shown to be a predictor of volatility [Blair et al., 2001]. We retrieve the VIX value at the day before the call to factor in market moves affecting all companies.
Size is represented by the total market value of equity (or: "market capitalization"), which is defined as the number of outstanding shares times stock price. We include the firm size on the day before the call as feature, since it is a well-known driver of risk [Fama and French, 1993].
Book-to-market is the ratio of firm value according to its balance sheet ("book value") over market value (see above) and measures the current degree of over- or undervaluation. This ratio is a well-proven risk factor [Fama and French, 1993], which is why we incorporate it in our model.
Earnings surprise is the difference between the actual and the expected earnings per share (i.e. the profit allocated per individual stock) and obtained from the WRDS database I/B/E/S. Empirical findings suggest that high surprises are also followed by a high volatility [Price et al., 2012], which is why we were interested to include it as a feature.
Industry-specific characteristics have been shown to be an important risk driver [Fama and French, 1997]. To account for them, we categorize each firm according to the Fama-French 12-industry scheme, 6 which distinguishes between twelve industries (e.g. "energy" or "healthcare").
4.3 ProposedModel: PRoFET
PRoFET is a neural model incorporating word embeddings, LSTMs [Hochreiter and Schmidhuber, 1997], and an attention-based text representation. Our implementation (as elaborated below) can be found online. 7
4 https://wrds-web.wharton.upenn.edu/wrds
5 http://www.cboe.com/vix
6 http://mba.tuck.dartmouth.edu/pages/faculty/ken.french/ data library.html
Architecture
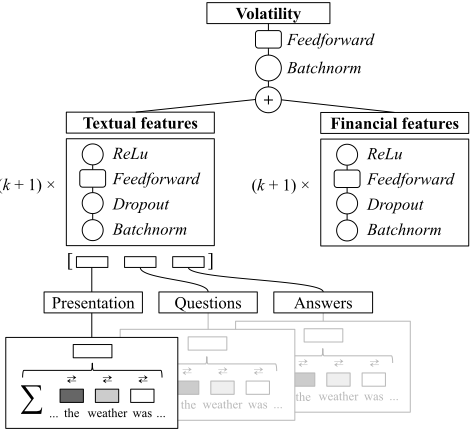
Figure 1 provides a sketch of PRoFET's architecture. For each section, a representation t is computed: Each token w(i) is transformed into a contextualized representation c(i) with a BiLSTM by concatenating the a left-to-right and a right-to-left LSTM's hidden state vector of w(i) , i.e. c(i) = [---→ BiLSTM(w(1) , ..., w(i) ), ←--- BiLSTM(w(n) , ...,w(i) )]. An attention score s(i) is computed for each of these contextualized representations with a learned attention vector a, where s(i) = exp(aT c(i) ) ∑j exp(aT c(j) ) [Bahdanau et al., 2015]. A separate a is learned for presentations, questions, and answers (i.e. aP, aQ, and aA) and the BiLSTM weights are shared among these sections. Finally, each section is represented as weighted sum:
The such obtained text representations tP, tQ, and tA are concatenated and fed into a feed-forward network (FNN) with k hidden layers (with k being a hyperparameter). Each of its layers uses dropout, batch normalization [Ioffe and Szegedy, 2015], and a ReLU [Nair and Hinton, 2010] activation function. Thus, a single distributed text representation tdist is created. A separate FNN with the same architecture calculates a distributed representation fdist from the financial data. Both of these representations are summed up yielding a single vector (tdist + fdist) which is fed into a final hidden layer with batch normalization. The output of this layer is a prediction of the continuous label v, i.e. volatility in the week after the call.
Optimization
The performance of neural architectures is influenced by a range of hyperparameters. To choose a set of hyperparameters for our FNN, we explore: the number of hidden layers k ∈ {1, 2, 3}, hidden layer sizes n ∈ {128, 256, 512, 1024, 2048}, and whether to use batch normalization for layers lin = 0, 1 ≤ lhid < k and lout = k. For the BiLSTM, we consider: the number of hidden layers k ∈ {1, 2, 3}, hidden layer sizes n ∈ {50, 100}, learning rate λ ∈ {10-1 , 10-2 }, dropout δ ∈ {0.0, 0.1, . . . , 0.5}, weight decay ω ∈ {10-4 , 10-5 , 10-6 }, embedding size d ∈ {100, 200}, and whether the embeddings are adjusted.
To find a good configuration of hyperparameters, we perform a Bayesian optimization minimizing MSE on the validation set. 8 We start the search with 10 random samples from the hyperparameter grid and then alternate between: (1) choosing the next unseen set yielding the lowest loss minus one standard deviation; or (2) sampling a new configuration from the grid. In total, we evaluate 60 hyperparameter configurations. We train a model for up to 20 epochs with Adagrad [Duchi et al., 2010] and a batch size of 112. We determine the best model with early stopping and use its hyperparameter configuration for subsequent training.
7 https://github.com/samuelbroscheit/neural-profet
8 The Bayesian optimization is implemented with sklearn 0.20.1's GaussianProcessRegressor with RBF kernel and 20 restarts.
4.4 Baselines
Average Pooling
As a simple neural benchmark, we train an average pooling model which obtains the text representations t by averaging all contextualized token representations c(i) :
GARCH
As one of the most popular econometric models for volatility prediction, GARCH [Bollerslev, 1986] is considered to perform well in various settings [Hansen and Lunde, 2005]. For each call, we train such a model as baseline that our joint models should exceed to provide real value. We use all available historic return data up to the call date to perform a prediction of volatility in the week following the call.
Sparse Methods
From the related domain of risk prediction based on annual report 10-K, we replicate the sparse methods 9 by Kogan et al. [2009], Wang et al. [2013], Tsai &Wang [2014], and Rekabsaz et al. [2017]. All of them use different variants of bag-of-words (BoW) vectors and past volatility 10 as features in a prediction based on the SVR model. Our findings confirm that among these approaches, the most recent one by Rekabsaz et al. [2017] performs best in our domain as well.
9 See Section 2 for an overview.
10 To provide a fair comparison to our approach, we additionally use the comprehensive set of financial features proposed by us (see Section 4.2) in all replication experiments.
This approach consists of training a word embedding model to expand a financial sentiment dictionary [Loughran and McDonald, 2011] with similar terms; this expanded dictionary is used to filter and retain the matching terms in BM25-weighted BoW vectors. Vector sparsity is reduced with Principal Component Analysis (PCA) and separate SVR models with RBF kernel are learned on both the financial and the textual data. The results of these models are fused ("stacked") in a final prediction with an additional SVR. To set PRoFET's performance in relation to the previous stateof-the-art, we report the results of this method on ten folds of our test set.
4.5 EvaluationMetrics
To evaluate the predictive performance, we analyze the following metrics: the linear correlation coefficient Pearson's r, the non-linear rank correlation coefficients Spearman's ρ and Kendall's τ used in the previous literature [Wang and Hua, 2014], and the MSE. Optimizing the models on our validation set, we noticed consistently higher values for the rank correlation coefficients over r. This indicates a monotonic but nonlinear relationship between the predicted values ˆ y and the actual values y. An inability to capture non-linear relationships and a proneness to outliers are well-known undesirable properties of r [Anscombe, 1973]. To obtain more robust correlation estimates in such settings, a log-transformation can be applied to ˆ y and y. Hence, we report rlog which is the linear correlation measured on the log-transformed data.
5 Results and Discussion
We start by demonstrating that a neural model performs competitively to the previous state-of-the-art, even when using previously proposed data and features (Section 5.1). We continue by benchmarking the performance of different models on our new dataset (Section 5.2), proceed with an ablation study (Section 5.3), and conclude with a showcase of the visualized attention mechanism of PRoFET (Section 5.4).
5.1 Comparison to Previous Work
We compare the best-performing previously researched model, a Gaussian Copula regression, with a set of regression models selected by us: a Ridge regression, a Huber regression, and a simple feed-forward neural network (FNN). The goal of this comparison is not to present a model which outperforms the previous state-of-the-art, but is to show that an FNN poses a competitive alternative to the model proposed by Wang & Hua [2014], which is not publicly available. To stay comparable, we use the dataset published by them. 11 This dataset contains 11K instances with 500 language features (as specified in Section 2) and volatility in the week following the call as a label. We explored several neural network architectures with different hyperparameters using a randomized search with 3-fold cross validation on the full dataset. 12 Table 2 provides an overview over the performance across all regression models. As can be seen, the neural network performs competitively to the Gaussian Copula, especially in terms of Spearman's ρ.
11 https://www.cs.ucsb.edu/∼william/data/earningscalls.zip
| Model | rlog | ρ | τ | MSE |
|---|---|---|---|---|
| Copula | - | 0.407 | 0.302 | - |
| Ridge | 0.326 | 0.356 | 0.245 | 0.976 |
| Huber | 0.346 | 0.382 | 0.262 | 0.926 |
| FNN | 0.395 | 0.446 | 0.309 | 0.829 |
5.2 Model Benchmark
Table 3 summarizes PRoFET's performance in terms of the evaluation metrics described in Section 4.5. All values are averages of ten runs on our test set. If applicable, we perform (paired) t-tests with α ∈ {0.05, 0.01, 0.001} to test for significant performance increases over the baselines described in Section 4.4: the econometric model GARCH; the bestperforming sparse method [Rekabsaz et al., 2017]; and the average pooling model.
As can be seen, the approach by Rekabsaz et al. [2017] outperforms the econometric model GARCH, which indicates that: (1) it should pose a competitive reference for our neural models; and (2) even sparse methods without a representation of semantic context can lead to considerable performance increases over purely financial models.
The average pooling model and the previous state-of-theart reach a similar performance with insignificant differences across all metrics apart fromMSE. For this metric, the average pooling models falls behind by a highly significant margin (0.870 vs. 0.504, p ≤ 0.001), albeit with a comparably high standard deviation (0.209 vs. 0.084). In summary, these results indicate that a simple averaging of the word embeddings does not appropriately reflect the complexity of the problem.
Our proposed model PRoFET exceeds both the average pooling model as well as the previous state-of-the-art across all evaluation metrics. This improvement is highly significant (p ≤ 0.001) in terms of the linear correlation, and very significant (p ≤ 0.01) in terms of the rank correlation coefficients. Moreover, PRoFET's performance also exhibits the largest robustness in terms of standard deviation out of all approaches which we consider. In conclusion, our findings suggest that for the given task, a fine-grained modeling of semantic context-in our case, with a separate attention mechanism weighting the contextualized token representations-leads to profound performance increases over both traditional econometric as well as state-of-the-art sparse NLP models.
12 The highest performance was achieved with three hidden layers (with 500, 250, and 150 neurons), a logistic activation function, and an L2 penalty parameter of 10-3 .
5.3 Ablation Study
We continue by performing a systematic ablation study to answer the questions: How do textual and financial features influence the prediction? What is the influence of the scripted presentation and the spontaneous Q&A?
Feature Ablation
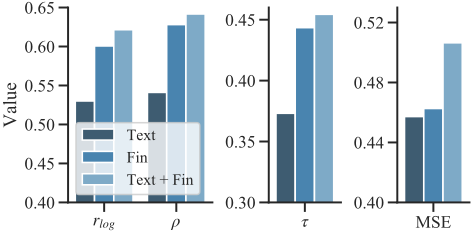
We start by comparing the performance of a purely financial model to both a purely textual model and a joint model. The results of this ablation are depicted in Figure 2. Using only textual features yields to noticeable performance drops in terms of rlog, ρ, and τ compared to both the financial features as well as a joint model; however, using textual features alone yields the lowest MSE out of all models that we consider. Although seemingly small, the performance increase of a joint model over a purely financial model is highly significant (p ≤ 0.001) in terms of rlog and very significant (p ≤ 0.01) in terms of ρ and τ. In summary, this experiment exemplifies that for the given task, the performance of textual features can only be assessed meaningfully in conjunction with financial features.
Section Ablation
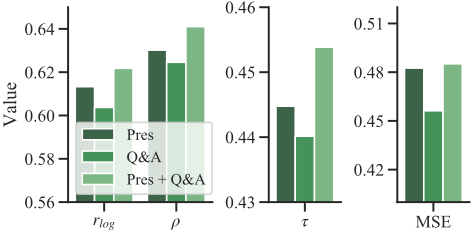
We proceed by comparing the influence of different sections on the predictive power. It could be expected that the presentation and the Q&A as structurally different sections also differ with regard to their informativeness to the market. Our results (see Figure 3) show that using only the presentation yields better results than using only the Q&A. While the joint model still performs best in terms of rlog, ρ, and τ, it is the model trained on the presentation alone, which achieves the lowest MSE; this difference is insignificant, however. In sum, these results show that the transcripts have to be analyzed in their entirety to achieve the best performance.
| Model | rlog | ρ | τ | MSE | ||||
|---|---|---|---|---|---|---|---|---|
| Mean | SD | Mean | SD | Mean | SD | Mean | SD | |
| GARCH | 0.437 | - | 0.531 | - | 0.368 | - | 7.236 | - |
| Rekabsaz [2017] | 0.560 | 0.024 | 0.596 | 0.020 | 0.422 | 0.017 | 0.504 | 0.084 |
| Average Pooling | 0.571 | 0.017 | 0.598 | 0.018 | 0.419 | 0.015 | 0.870 | 0.209 |
| PRoFET | 0.622 | 0.013 | 0.641 | 0.013 | 0.454 | 0.011 | 0.485 | 0.086 |
5.4 Attention Visualization
As a concluding use case, we show how the attention mechanism (see Section 4.3) can be visualized on the token-level as a tool for investment decision support. In Figure 4, we present three real-data text snippets to which PRoFET assigned a noticeably above-average attention per token.
As the first snippet indicates, PRoFET allocates a high attention to "uncertainties" created by the "Brexit vote". The latter collocation appears in the top-10 percentile of tokens when ordered according to their average attention which indicates a strong correlation with risk. The second snippet, taken from the Q&A answers given by company executives, is about short-term fluctuations and their implications for investment risk. Notably, the term "outlook" gets assigned slightly different attention levels depending on the verbal context. The last snippet covers severe environmental conditions, namely "heavy rainfall" and "subsequent flooding" with the latter displaying the highest allocated attention.
6 Conclusion
In this paper, we exploited natural language information revealed in recurring events (so-called earnings calls) for a volatility prediction task. We introduced PRoFET, the first neural model for risk prediction jointly learning from both semantic text representations and a comprehensive set of financial features. We have shown that our proposed method outperforms the previous state-of-art and other strong baselines. PRoFET's architecture leverages an attention mechanism to model verbal context which leads to significant performance increases over simpler sparse or average pooling models. We concluded by showcasing how this attention mechanism can be visualized on the token-level, thus providing interpretable results and offering a tool for investment decision support.
Acknowledgements
We would like to thank the anonymous reviewers as well as Goran Glavaˇs and Sanja ˇStajner for their helpful comments. This research was supported by the NVIDIA Corporation, who donated a Titan X GPU.
And finally , the uncertainties created by the Brexit vote are likely to enhance the US commercial industry 's attractiveness across the majority of overseas investors . Given the aforementioned volatility we believe it is important to reiterate a few key themes relative to the HFF business model .
And I guess as we think about the timing of you making these investments , I understand that despite short - term fluctuations the long - term outlook is strong for capital markets . But the long - term outlook has probably been good for a while .
Unfortunately , weather was again a major headwind for our business with the heavy rainfall and subsequent flooding in South Texas and Louisiana . Despite this headwind , we maintained strong utilization at {PERCENT} based on OEC , down {CARDINAL} basis points from {DATE} .
Figure 4: Exemplary text snippets from the validation data with visualized attention per token according to PRoFET. Increasing intensity of red indicates a higher attention (i.e. a higher predictive power for risk).
@inproceedings{ijcai2019p724,
  title     = {PRoFET: Predicting the Risk of Firms from Event Transcripts},
  author    = {Theil, Christoph Kilian and Broscheit, Samuel and Stuckenschmidt, Heiner},
  booktitle = {Proceedings of the Twenty-Eighth International Joint Conference on
               Artificial Intelligence, {IJCAI-19}},
  publisher = {International Joint Conferences on Artificial Intelligence Organization},
  editor    = {Sarit Kraus},
  pages     = {5211--5217},
  year      = {2019},
  month     = {8},
  note      = {Main track},
  doi       = {10.24963/ijcai.2019/724},
  url       = {https://doi.org/10.24963/ijcai.2019/724},
}
TY - CPAPER TI - PRoFET: Predicting the Risk of Firms from Event Transcripts AU - Theil, Christoph Kilian AU - Broscheit, Samuel AU - Stuckenschmidt, Heiner T2 - Proceedings of the Twenty-Eighth International Joint Conference on Artificial Intelligence, IJCAI-19 PB - International Joint Conferences on Artificial Intelligence Organization PY - 2019 SP - 5211 EP - 5217 DO - 10.24963/ijcai.2019/724 UR - https://doi.org/10.24963/ijcai.2019/724 ER -Copied
Machine-readable versions of this paper, for tools and AI agents:





