
Machine Learning Approaches to Reduce Electrical Waste and Improve Power Grid Stability
Proceedings of the Twenty-Seventh International Joint Conference on Artificial Intelligence. Doctoral Consortium. Pages 5791-5792.
https://doi.org/10.24963/ijcai.2018/839
Keywords
- Machine Learning: Classification
- Machine Learning: Time-series/Data Streams
- Machine Learning: Data Mining
- Machine Learning: Feature Selection/Construction
Abstract
My research contributions are summarized as follows: In electricity disaggregation, I introduced the first label correction approach for supervised training samples. For unsupervised disaggregation, I introduced event detection that does not require parameter tuning and appliance discovery that makes no assumptions on appliance types. These improvements produce better accuracy, faster computation, and more scalability than any previously introduced method and can be applied to natural gas disaggregation, water disaggregation, and other source separation domains. My current work challenges long-held assumptions in time series shapelets, a classification tool with applicability in electrical time series and dozens of additional domains.
- [Biswal et al., 2016] Milan Biswal, Yifan Hao, Phillip Chen, Suku- mar Brahma, Huiping Cao, and Phillip De Leon. Signal features for classification of power system disturbances using pmu data. In Power Systems Computation Conference (PSCC), pages 1-7. IEEE, 2016.
- [Kolter et al., 2010] J Zico Kolter, Siddharth Batra, and Andrew Y Ng. Energy disaggregation via discriminative sparse coding. In NIPS, 2010.
- [Patri et al., 2014] Om P Patri, Anand V Panangadan, Charalampos Chelmis, and Viktor K Prasanna. Extracting discriminative fea- tures for event-based electricity disaggregation. In Technologies for Sustainability (SusTech), pages 232-238. IEEE, 2014.
- [Valovage and Gini, 2016] Mark Valovage and Maria Gini. Auto- matic label correction and device prioritization in single house- hold electricity disaggregation. Int'l. Workshop on A.I. for Smart Grids and Smart Buildings, at AAAI, 2016.
- [Valovage and Gini, 2017] Mark Valovage and Maria Gini. Label correction and event detection for electricity disaggregation. In Proc. of the 16th Conf. on Autonomous Agents and MultiAgent Systems, pages 990-998. IFAAMAS, 2017.
- [Valovage et al., 2018] Mark Valovage, Akshay Shekhawat, and Maria Gini. Model-free iterative temporal appliance discovery for unsupervised electricity disaggregation. In Proc. AAAI, 2018.
References were extracted automatically from the PDF and may contain errors.
Full text extracted automatically from the PDF; figures, tables and equations may differ. The PDF is the version of record.
1 The Benefits Hiding in Electrical Data
Electricity disaggregation holds the promise of reducing billions of dollars of electrical waste every year. In the power grid, automatic classification of disturbance events detected by phasor measurement units could prevent cascading blackouts before they occur. Additional machine learning applications include better market segmentation by utility companies, improved design of appliances, and reliable incorporation of renewable energy resources into the power grid.
My research contributions produce better accuracy, faster computation, and more scalability than previously introduced methods and can be applied to natural gas disaggregation, water disaggregation, and other source separation domains. My current work challenges long-held assumptions in time series shapelets, a classification tool with applicability in electrical time series and dozens of additional domains.
2 Electricity Disaggregation
Electricity disaggregation identifies individual appliances from one or more aggregate data streams [Kolter et al., 2010]. However, to effectively reduce waste, disaggregation must be performed using inexpensive, low power hardware, making computationally expensive approaches impractical.
2.1 Label Correction for Supervised Disaggregation
Supervised learning methods first train on appliance samples recorded in isolation. Afterwards these methods can then identify appliances that are operating simultaneously while being recorded by a single smart meter. However, existing approaches assume error-free labels in training data, an unrealistic assumption for data labeled by na¨ıve consumers. In [Valovage and Gini, 2016], I introduced the first method to automatically correct labels in consumer-labeled training samples, enabling realistic application of supervised methods to a single house. I improved this method in [Valovage and Gini, 2017] to use a parameter-free model, making it scalable to millions of homes. While these improvements overcome limiting assumptions, supervised learning still requires hours of work by consumers to meticulously label individual appliance samples. To enable a system that requires no consumer setup, unsupervised learning is required.
2.2 Unsupervised Electricity Disaggregation
It is more challenging for unsupervised learning methods to accurately identify appliances since they lack training samples and must be able to identify a wide range of appliances. Unsupervised disaggregation requires two distinct steps. First, during event detection, the aggregate power data stream is segmented into significant events that represent a state change in one or more appliances. Second, appliance discovery reconstructs appliances from these events. Existing methods for both of these steps have their own shortcomings that limit real-world deployment, detailed below.
Parameter-Free Event Detection
Previously introduced event detection methods depend on parameters optimized for a single appliance or dataset, limiting scalability to millions of buildings. In [Valovage and Gini, 2017], I introduced the first event detection method that does not require parameter tuning using a modified version of Bayesian change detection. Tests on 2 publicly available datasets containing 7 different houses showed Bayesian change detection performed on par with or better than existing state-of-the-art event detection methods without the need to tune parameters, making it scalable to millions of homes. Furthermore, my modifications to Bayesian change detection reduced its space and time complexity from O(n2 ) to O(n), enabling it to run in real-time on inexpensive hardware.
Model-Free Iterative Appliance Discovery
Following event detection, events must be recombined into their respective appliances. Doing this with no previous assumptions is challenging since appliances can operate for different amounts of time and often overlap in operation. In addition, while simple appliances consistently generate the same power signatures, more complex appliances produce a different signature every time they are operated.
To overcome limitations of existing methods, in [Valovage et al., 2018] I introduced iterative appliance discovery, an algorithm built around the concept of identifying the simplest appliances first. Once the simplest appliances have been identified, events associated with them are marked so they are not included in subsequent searches for more complex appliances. By iteratively reducing the search space, iterative discovery has the unprecedented ability to discover complex appliances other methods cannot.
3 Work in Progress: Time Series Shapelets
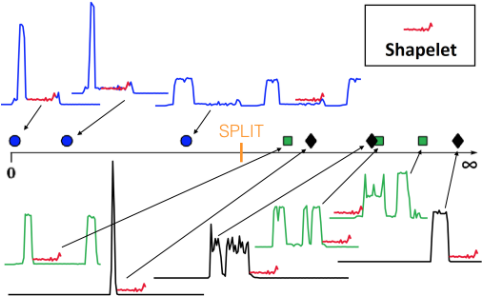
Shapelets are small subsequences of time series that can be used for fast, accurate classification of unlabeled time series (see Figure 1). Shapelets have applications in finance, entertainment, medicine, biometrics, chemistry, astronomy, robotics, and entomology. Shapelets can also be used for electricity disaggregation [Patri et al., 2014] and classification of phasor measurement unit disturbance data [Biswal et al., 2016]. However, the accuracy of a shapelet during classification relies solely on its distance from a tested sample, and existing approaches are limited by long-held assumptions.
3.1 Shapelets: To Normalize or Not To Normalize
A shapelet classifies samples by separating them based on distance. The distance between a shapelet and a time series sample is defined as the best fit distance, where the shapelet is aligned to the sample so that the distance between the shapelet and the sample is minimal. Figure 1 shows the best fit of the shapelet (red) to each training sample from 3 classes (blue, green, black). When these distances are projected onto the real number line in the middle of the figure, the split point shown can separate the samples from the blue class from the other classes. The shapelet and its corresponding split point are learned using training data and used to classify unlabeled test samples.
Prior to calculating distance, Z-normalization is used to remove scale and offset distortions in local features. While this is intended to increase accuracy, my initial results on 85 datasets from dozens of domains show that Z-normalization decreases accuracy more often than it increases it.
Shapelets typically capture a local feature from a single class. Z-normalization tends to improve accuracy when this feature has low variability and high similarity between samples from that class. However, rescaling caused by Znormalization can also produce better fits to similar features from other classes. This side effect can diminish the classification ability of a shapelet by reducing (or even eliminating) the distance separation between samples of different classes.
This is especially true for electrical data. In all 6 electrical datasets studied, Z-normalization significantly reduced accuracy. In the most extreme case, shapelet classification on one dataset was 42% using Z-normalized distances, while using raw distance improved shapelet accuracy to over 81%.
In addition to challenging the assumption that Znormalization always improves accuracy, I am exploring the ability to reliably predict the impact of Z-normalization prior to learning by using cross-validation on the training data.
3.2 Improving Shapelet Distance Metrics
While Euclidean distance is robust, it is the only distance metric that has been used with shapelets. Deeper analysis shows different distance metrics may be able to improve shapelet classification accuracy. I am currently exploring the impact of other distance metrics including the Manhattan (l1) distance, Pearson's correlation, and complexity invariant distance.
It is also possible to learn a custom distance specific to each shapelet. In other words, rather than having to select a standard distance metric such as Euclidean or Manhattan distance, a custom metric can be learned through logistic regression. This learned, shapelet-specific distance may provide a better decision boundary than any standard distance metric, ultimately improving shapelet classification accuracy for dozens of problems.
@inproceedings{ijcai2018p839,
  title     = {Machine Learning Approaches to Reduce Electrical Waste and Improve Power Grid Stability},
  author    = {Valovage, Mark},
  booktitle = {Proceedings of the Twenty-Seventh International Joint Conference on
               Artificial Intelligence, {IJCAI-18}},
  publisher = {International Joint Conferences on Artificial Intelligence Organization},
  editor    = {Jérôme Lang},
  pages     = {5791--5792},
  year      = {2018},
  month     = {7},
  note      = {Doctoral Consortium},
  doi       = {10.24963/ijcai.2018/839},
  url       = {https://doi.org/10.24963/ijcai.2018/839},
}
TY - CPAPER TI - Machine Learning Approaches to Reduce Electrical Waste and Improve Power Grid Stability AU - Valovage, Mark T2 - Proceedings of the Twenty-Seventh International Joint Conference on Artificial Intelligence, IJCAI-18 PB - International Joint Conferences on Artificial Intelligence Organization PY - 2018 SP - 5791 EP - 5792 DO - 10.24963/ijcai.2018/839 UR - https://doi.org/10.24963/ijcai.2018/839 ER -Copied
Machine-readable versions of this paper, for tools and AI agents:





