
DeepTravel: a Neural Network Based Travel Time Estimation Model with Auxiliary Supervision
Proceedings of the Twenty-Seventh International Joint Conference on Artificial Intelligence. Main track. Pages 3655-3661.
https://doi.org/10.24963/ijcai.2018/508
Keywords
- Machine Learning: Neural Networks
- Machine Learning: Deep Learning
- Machine Learning Applications: Applications of Supervised Learning
Abstract
Estimating the travel time of a path is of great importance to smart urban mobility. Existing approaches are either based on estimating the time cost of each road segment which are not able to capture many cross-segment complex factors, or designed heuristically in a non-learning-based way which fail to leverage the natural abundant temporal labels of the data, i.e., the time stamp of each trajectory point. In this paper, we leverage on new development of deep neural networks and propose a novel auxiliary supervision model, namely DeepTravel, that can automatically and effectively extract different features, as well as make full use of the temporal labels of the trajectory data. We have conducted comprehensive experiments on real datasets to demonstrate the out-performance of DeepTravel over existing approaches.
- [Ahmed and Cook, 1979] Mohammed S. Ahmed and Allen R. Cook. Analysis of freeway traffic time-series data by using box-jenkins techniques. Transportation Research Record, (722):1-9, 1979.
- [Asif et al., 2014] Muhammad Tayyab Asif, Justin Dauwels, Chong Yang Goh, Ali Oran, Esmail Fathi, Muye Xu, Menoth Mohan Dhanya, Nikola Mitrovic, and Patrick Jail- let. Spatiotemporal patterns in large-scale traffic speed prediction. IEEE Transactions on Intelligent Transporta- tion Systems, 15(2):794-804, 2014.
- [de Brébisson et al., 2015] Alexandre de Brébisson, Étienne Simon, Alex Auvolat, Pascal Vincent, and Yoshua Ben- gio. Artificial neural networks applied to taxi destination prediction. arXiv preprint arXiv:1508.00021, 2015.
- [De Fabritiis et al., 2008] Corrado De Fabritiis, Roberto Ragona, and Gaetano Valenti. Traffic estimation and pre- diction based on real time floating car data. In ITSC'08, pages 197-203, 2008.
- [Gao et al., 2017] Qiang Gao, Fan Zhou, Kunpeng Zhang, Goce Trajcevski, Xucheng Luo, and Fengli Zhang. Iden- tifying human mobility via trajectory embeddings. In IJ- CAI'17, pages 1689-1695, 2017. IJCAI
- [Graves and Schmidhuber, 2005] Alex Graves and Jürgen Schmidhuber. Framewise phoneme classification with bidirectional lstm and other neural network architectures. Neural Networks, 18(5):602-610, 2005.
- [Han et al., 2011] Jiawei Han, Jian Pei, and Micheline Kam- ber. Data mining: concepts and techniques. Elsevier, 2011.
- [Hoch, 2015] Thomas Hoch. An ensemble learning ap- proach for the kaggle taxi travel time prediction challenge. In DC@ PKDD/ECML, 2015.
- [Hochreiter and Schmidhuber, 1997] Sepp Hochreiter and Jürgen Schmidhuber. Long short-term memory. Neural computation, 9(8):1735-1780, 1997.
- [Jia et al., 2001] Zhanfeng Jia, Chao Chen, Ben Coifman, and Pravin Varaiya. The PeMS algorithms for accurate, real-time estimates of g-factors and speeds from single- loop detectors. In ITSC'01, pages 536-541, 2001.
- [Jindal et al., 2017] Ishan Jindal, Xuewen Chen, Matthew Nokleby, Jieping Ye, et al. A unified neural network ap- proach for estimating travel time and distance for a taxi trip. arXiv preprint arXiv:1710.04350, 2017.
- [Kingma and Ba, 2014] Diederik Kingma and Jimmy Ba. Adam: A method for stochastic optimization. arXiv preprint arXiv:1412.6980, 2014.
- [Lam et al., 2015] Hoang Thanh Lam, Ernesto Diaz-Aviles, Alessandra Pascale, Yiannis Gkoufas, and Bei Chen. (blue) taxi destination and trip time prediction from par- tial trajectories. arXiv preprint arXiv:1509.05257, 2015.
- [Luo et al., 2013] Wuman Luo, Haoyu Tan, Lei Chen, and Lionel M Ni. Finding time period-based most frequent path in big trajectory data. In SIGMOD'13, pages 713- 724, 2013.
- [Lv et al., 2015] Yisheng Lv, Yanjie Duan, Wenwen Kang, Zhengxi Li, and Fei-Yue Wang. Traffic flow prediction with big data: a deep learning approach. IEEE Trans- actions on Intelligent Transportation Systems, 16(2):865- 873, 2015.
- [Ma et al., 2015] Xiaolei Ma, Zhimin Tao, Yinhai Wang, Haiyang Yu, and Yunpeng Wang. Long short-term mem- ory neural network for traffic speed prediction using re- mote microwave sensor data. Transportation Research Part C: Emerging Technologies, 54:187-197, 2015.
- [Mikolov et al., 2013] Tomas Mikolov, Ilya Sutskever, Kai Chen, Greg S Corrado, and Jeff Dean. Distributed rep- resentations of words and phrases and their composition- ality. In NIPS'13, pages 3111-3119, 2013.
- [Perozzi et al., 2014] Bryan Perozzi, Rami Al-Rfou, and Steven Skiena. Deepwalk: Online learning of social rep- resentations. In SIGKDD'14, pages 701-710, 2014.
- [Rahmani et al., 2013] Mahmood Rahmani, Erik Jenelius, and Haris N Koutsopoulos. Route travel time estimation using low-frequency floating car data. In ITSC'13, pages 2292-2297, 2013.
- [Rice and Van Zwet, 2004] John Rice and Erik Van Zwet. A simple and effective method for predicting travel times on freeways. IEEE Transactions on Intelligent Transportation Systems, 5(3):200-207, 2004.
- [Song et al., 2016] Xuan Song, Hiroshi Kanasugi, and Ryosuke Shibasaki. Deeptransport: Prediction and Sim- ulation of Human Mobility and Transportation Mode at a Citywide Level. In IJCAI'16, pages 2618-2624, 2016. IJCAI
- [Wang et al., 2014] Yilun Wang, Yu Zheng, and Yexiang Xue. Travel time estimation of a path using sparse tra- jectories. In SIGKDD'14, pages 25-34, 2014.
- [Wang et al., 2016] Hongjian Wang, Yu-Hsuan Kuo, Daniel Kifer, and Zhenhui Li. A simple baseline for travel time estimation using large-scale trip data. In SIGSPATIAL'16, page 61. ACM, 2016.
- [Wang et al., 2018] Dong Wang, Junbo Zhang, Wei Cao, Jian Li, and Yu Zheng. When will you arrive? estimating travel time based on deep neural networks. In AAAI'18, pages 1-8, 2018.
- [Werbos, 1990] Paul J Werbos. Backpropagation through time: what it does and how to do it. Proceedings of the IEEE, 78(10):1550-1560, 1990.
- [Wu et al., 2017] Hao Wu, Ziyang Chen, Weiwei Sun, Bai- hua Zheng, and Wei Wang. Modeling trajectories with re- current neural networks. In IJCAI'17, pages 3083-3090, 2017. IJCAI
- [Zhang et al., 2017] Junbo Zhang, Yu Zheng, and Dekang Qi. Deep spatio-temporal residual networks for citywide crowd flows prediction. In AAAI'17, pages 1655-1661, 2017.
References were extracted automatically from the PDF and may contain errors.
Full text extracted automatically from the PDF; figures, tables and equations may differ. The PDF is the version of record.
1 Introduction
The advances in GPS-enabled mobile devices and pervasive computing techniques have generated massive trajectory data. The large amount of trajectory data provide opportunities to further enhance urban transportation systems. The estimated travel time of a path at a certain time is an essential piece of information commuters desire to have. However, it is challenging to perform an accurate estimation as the travel time is affected by many dynamics, such as the dynamics of the traffic, the dynamics at the crossroads, the dynamics of the driving behavior and the dynamics of the travel time of same paths in the historical data.
Existing solutions mainly adopt divide-and-conquer approach to perform the estimation by decomposing a path into a sequence of segments or sub-paths. Segment-based approaches [De Fabritiis et al., 2008; Asif et al., 2014; Lv et al., 2015] estimate the travel time of each road segment individually, but ignore the additional time spent at the intersection of segments due to traffic lights and turns. Moreover, they rely on high-quality travel speed estimations/measurements, that might not be always available. Subpath based approaches [Rahmani et al., 2013; Wang et al., 2014] try to estimate the time of the whole path by extracting the time consumption of sub-paths appeared in the historical dataset. As they can eliminate some errors accumulated by segment-based approaches, they are able to achieve a higher accuracy. However, they are still designed in an empirical and heuristic way but not training-based, which leaves the room for further improvement. In summary, existing estimation approaches could not achieve excellent accuracy because they fail to consider the path as a whole and they do not fully leverage the natural supervised labels of the data, i.e., the time stamp of each GPS sampling point that is easy to collect.
On the other hand, thanks to the recent boom of deep learning techniques, more problems can be solved by end-to-end models which significantly outperform the traditional heuristic approaches. Moreover, deep learning models have a strong representation power which enables the capturing of more latent features and the modeling of such complicated dynamics in travel time estimation problem. Motivated by this, we propose a deep model named DEEPTRAVEL which can learn directly from historical trajectories to estimate the travel time. DEEPTRAVEL considers the characteristics of trajectory data by adopting a new loss function for auxiliary supervision and is able to extract multiple features that affect the travel time.
In brief, we make three main contributions in this paper. First, we propose DEEPTRAVEL, an end-to-end training-based model which can learn from the historical dataset to predict the travel time of a whole path directly. We introduce a dual interval loss to fully leverage the temporal labels of the trajectory data which works as an auxiliary supervision. Second, we propose a feature extraction structure to extract features including spatial and temporal embeddings, driving state features, short-term and long-term traffic features. This structure can effectively capture different dynamics for estimating the travel time accurately. Last but not least, we conduct comprehensive experiments to evaluate our model with two real datasets. The results demonstrate the advantage of our model over the state-of-the-art competitors.
2 RelatedWork
As stated in Section 1, existing approaches on estimating the path travel time could be categorized into two clusters, segment-based approaches and sub-path-based approaches.
The former estimates the travel time of each individual road segment in the network via different methods, e.g., the loop detectors [Jia et al., 2001; Rice and Van Zwet, 2004], support vector regression [Asif et al., 2014] and stacked autoencoder [Lv et al., 2015]. Given a path, segment-based approaches treat it as a sequence of individual segments and the estimation could not achieve a high accuracy as they do not consider the interaction between road segments. In addition, they heavily rely on high quality travel speed data of each segment which might not be always available.
Inspired by the inaccuracy of road segment-based methods, sub-paths based approaches consider sub-paths instead of single segments as a way to include the interaction between road segments into the estimation. For example, [Han et al., 2011; Luo et al., 2013] mine frequent trajectory patterns; [Rahmani et al., 2013] introduces a non-parametric method and utilizes the travel time of common sub-paths between the query path and historical paths to estimate the travel time of the whole path after incorporating a list of potential biases corrections; [Wang et al., 2014] finds the optimal concatenation of trajectories for an estimation through a dynamic programming solution. They are able to improve the accuracy, as compared with segment-based approaches. However, the improvement is still limited due to the heuristical design, i.e., minimizing the estimation error of the travel time is not the target.
There are other works related to the estimation of travel time. TEMPR [Wang et al., 2016] and ST-NN [Jindal et al., 2017] study the OD travel time estimation problem that is to estimate the travel time based only on the origin and the destination without specific path while we estimate the travel time taken by a specific path. A variance was studied in ECML/PKDD 2015 challenge, i.e., estimating the travel time of the remaining trip without knowing the exact path, given the input of the initial path taken by a trip. Representative solutions include [Lam et al., 2015; Hoch, 2015]. DeepTTE [Wang et al., 2018] adopts deep learning method to predict travel time of a trajectory with intermediate GPS points. When the input is a path without any GPS point, its performance drops significantly.
On the other hand, recurrent neural network (RNN) has shown great power in modeling trajectory recently. For example, [Song et al., 2016] uses RNN to predict people's future transportation mode; [Wu et al., 2017] models trajectory data with RNN, which achieves a better performance in predicting next movement than shallow models; [Gao et al., 2017] uses RNN with embeddings to represent the underlying semantics of user mobility patterns. In this paper, we will leverage on the power of RNN to perform travel time estimation of paths.
3 DEEPTRAVEL
To adopt neural networks in our study, we partition the whole road network into N×N disjoint but equal-sized grids, similar to many existing approaches [de Br´ebisson et al., 2015; Zhang et al., 2017]. Accordingly, a travel path G started at t1 could be represented by a sequence of grids it passes by, i.e., G = {g1, g2, ..., gn}. As long as the granularity of grid cells is fine enough, G is able to capture the real movement of the path in road networks. Meanwhile, we assume sampled GPS points of the path are recorded to capture the real trajectory T of G in the form of T = {p1,p2,· · ·, pm}. Each GPS point pi = (xi, yi, ti) has latitude xi, longitude yi and time stamp ti, and the value of tm-t1 indicates the real travel time of T . We can map a trajectory T to a path G. Note some of the grids in G will have one or multiple GPS points, while other grids might not have any, e.g., gray grids shown in Figure 1. We need to keep the grids with no GPS points to guarantee the continuity of a path. Our target is to use historical paths to train the model which can predict the travel time for a given path G′ that starts its travel at t1.
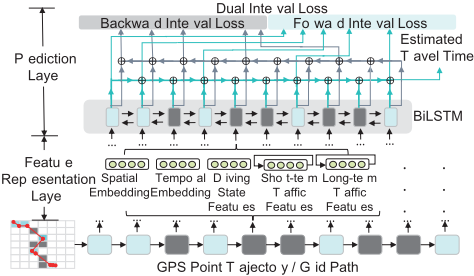
We propose DEEPTRAVEL as a solution. As shown in Figure 1, it consists of two layers, the feature representation layer and the prediction layer. The former aims at extracting different features from the path, and the latter uses these features to predict the travel time under auxiliary supervisions.
3.1 Feature Representation Layer
We use features to capture factors that could affect travel time of paths. DEEPTRAVEL considers spatial and temporal embedding, driving state features, short-term and long-term traffic features. We employ each grid as the carrier of these features. Spatial and temporal embedding. Both the spatial factor and the temporal factor affect the moving speed and hence the travel time. For example, the speed limits vary from region to region, and the traffic condition varies from time to time, e.g., residential areas and industrial districts usually have different speed limits and traffic in peak hours is much heavier than that in non-peak hours. However, it is challenging to capture all these factors precisely. We strategically train our model DEEPTRAVEL to learn the characteristics w.r.t. each grid automatically. To achieve this goal, we adopt the distributed representation to represent each grid using a lowdimensional vector V ∈ Rd . The distributed representation has been widely used as a representation learning method, such as Word2Vec in natural language [Mikolov et al., 2013], and deepwalk in social networks [Perozzi et al., 2014]. The spatial embedding vector Vsp contains a variety of feature information of the grid, which is scattered in various bits. For temporal features, we divide a day into different time-bins (e.g. an hour a bin in our experiments) and use an unique vector Vtp to represent each time-bin. Both Vsp and Vtp could be initialized randomly, and updated during the model training.
Driving state features. The driving process of vehicles can often be divided into the starting stage, the middle stage and the ending stage, and vehicles have different driving characteristics in various stages. For example, a vehicle prefers driving on the main roads/highways in the middle stage, where the speed could be very fast; while it has to move from the origin of the journey to the main roads/highways in the starting stage and it has to move from the main roads/highways to the destination in the ending stage. We use the vector Vdri ∈ R4 to represent the driving state features. It contains three 0-1 bits which represent the starting, middle and ending stages respectively and a ratio value capturing the proportion of the current path that is traveled (e.g., [1,0,0,0.2] indicates a starting stage and it finishes 20% of the entire path).
Short-term and long-term traffic features. Traffic condition in a sub-region has the characteristic of continuity in terms of time dimension, e.g., a road segment that experienced traffic jam from 8:00 to 8:30 this morning is expected to have heavy traffic at 8:35, which means the traffic condition of the path right before a query is issued on the path is informative and useful. Accordingly, we use the term Vshort to represent the short-term traffic condition features.
Given a path travel time estimation query submitted at time t, we extract Vshort from historical trajectories falling within the time window of [t-1 hour, t). To be more specific, we partition trajectories into disjoint time-bin τs of δ minutes (e.g., 5 minutes in our experiment). Then, the traffic conditions of a certain grid gi along these short time-bins form a sequence which reflects the temporal evolvement of the traffic condition in gi. Hence, we utilize the long short-term memory network (LSTM) [Hochreiter and Schmidhuber, 1997], a typical RNN for sequence modeling, to capture such temporal dynamics. LSTM is fed by sequences of the statistical information of each time-bin, e.g., τ1 ∼ τ12, and we set Vshort to the last hidden state of LSTM. Notice that after partitioning the historical data into 5-minute-span time-bins, some grids may have no vehicle passing by in some time-bins. As LSTM model can handle variable length sequences, we can easily tackle this problem by skipping those time-bins with no vehicle passing by. E.g., in Figure 2, for the grid of "0-neighbor", only -5-min, -25-min, and -60min time-bin have historical vehicles passing by, so we can skip the remaining empty timebins when feeding data into LSTM. Then, we design the input w.r.t. the j-th time-bin τj of grid gi in the form of
j indicates the degree of closeness of xji to the query time tq in a linear scale, i.e., j=12 (j=1) infers that the time-bin is one hour (5 minutes) before tq which has the least (largest) closeness. vj is the mean speed estimated from the samples in gi at τj; nj refers to the number of historical samples, which indicates the degree of trustworthiness (the larger the better) about the estimated speed vj as vj tends to be vulnerable to outliers if nj is very small. leni is the length of the query path G overlapped with grid gi, and leni/vj is a rough estimation of the average travel time of the path G spent within gi.
As mentioned before, the historical number of samples extracted at one day in a short time interval is not large which may result in data sparsity issue. Noticing the fact of spatial locality of the traffic condition, i.e., traffic conditions tend to be similar in adjacent grids, we further include the traffic feature of gi's neighbors' as a solution. The d-neighbor set N gi d of grid gi is defined as the set of grid cells with their distances to gi being d, i.e., N gi d = {gj | max(|gi.x - gj.x|, |gi.y - gj.y|) = d}, where (gl.x, gl.y) indicates the position of gl, e.g., (gi.x, gi.y)=(1,2) denotes the grid located at the 1st row and 2nd column in N×N grids. Accordingly, N0 contains gi itself, N1 includes all the grid cells adjacent to gi, and so on. The final short-term traffic feature of gi is the concatenation of gi's d-neighbor sets' short-term traffic features. Figure 2 shows example N gi d s of the center grid with d=0, 1, 2.
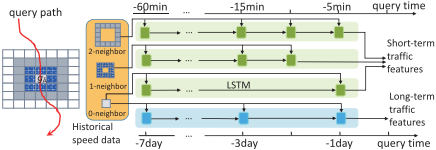
Previous work has shown that the long-term traffic dynamics is also important for estimating travel time [Wang et al., 2014]. The above short-term traffic feature extraction structure can be easily adjusted for supporting long-term traffic feature Vlong. In detail, we construct the sequence along the dimension of days, e.g., we use the statistical information like Eq. (1) for the grid at the same time but in previous 7 days.
3.2 Prediction Layer
The prediction layer consists of two parts, namely BiLSTM and dual loss. The former is to combine feature representations of each grid to infer travel time information in hidden state vectors; while the latter is to further optimize the model.
BiLSTM. As compared with LSTM, bidirectional LSTM (BiLSTM) [Graves and Schmidhuber, 2005] utilizes additional backward information and thus enhances the memory capability. In our problem setting, we use BiLSTM to capture the information of every grid gi in the path from the starting point to gi and from the exit point from gi simultaneously. We concatenate the features extracted in Section 3.1 together to get the global feature vector V of the grid, i.e., V = [Vsp,Vtp,Vdri,Vshort,Vlong]. We feed V to BiLSTM at each step and get the i-th hidden states -→hi and ←- hi of the forward and backward layer respectively. We then concatenate these two states to get the i-th hidden state hi = [-→hi , ←- hi ].
Dual interval loss for auxiliary supervision. A simple way to estimate the travel time is to perform linear regression on the final hidden state hn by employing loss function such as mean squared error w.r.t. the ground truth tm - t1. However, it wastes much useful information (e.g., time stamps of intermediate points of trajectories) that can supervise the model. To leverage such additional supervision information, we design a dual interval loss mechanism for auxiliary supervision which exactly matches the characteristic of BiLSTM.
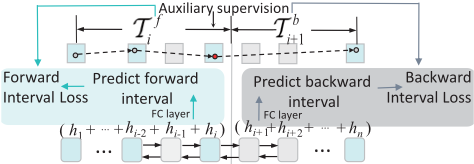
The dual interval loss is constructed by two losses, the forward interval loss and the backward interval loss. The general idea is to force the model to learn to simultaneously predict the time interval from the start point to each intermediate GPS point pj, i.e., the forward interval, and the interval from pj to the destination, i.e., the backward interval, as shown in Figure 3. In detail, we construct forward/backward mask vector M ∈ {0, 1}n for activating forward/backward interval loss at some grids having supervisory information. Moreover, we construct T f , T b ∈ Rn for recording the forward and backward interval ground truth. To be more specific,
gi.t refers to the time when the vehicle leaves the grid gi along the path, which can be derived from the corresponding trajectory data if there are GPS points sampled in the grid gi. Specifically, we define g0.t and gn.t as the time stamp of the first and the last GPS point respectively.
For predicting the dual intervals, instead of using the current hi for prediction, we decide to adopt a summation operation, which adds h1 to hi together for forward prediction and hi+1 to hn for backward prediction as Figure 3 shows. Such summation operation feeds the model with the prior knowledge of the summation property of time, i.e., the time spent on a path is the summation of the time spent on two suppaths, and there is no need to learn such summation property from the data. Moreover, the predicted time of each step, i.e., W ⊤hi+b, now represents the time spent only on grid gi which forces the sum of the predicted forward interval and the backward interval hold the same across all steps, i.e., (W ⊤ ∑ni=1 hi +b), that's exactly the travel time of the whole path. Thus, minimizing the dual loss can also benefit the estimation on the travel time of the entire path at each step which can be naturally regarded as the chief supervision in our task. Consequently, the forward/backward interval time estimation vectors ˆ T f, ˆ T b are as follows.
Here, ˆ T f ∈ Rn represents the travel time from the starting point to each grid in the path, and ˆ T b ∈ Rn represents the travel time from each grid in the path to the ending point. For both forward and backward predictions, we use shared weight W, b because we want to restrict the task of transformation from hi to the travel time spent on grid gi to be the same in both forward and backward predictions. The dual interval loss is the summation of the forward and backward interval losses. We use the relative mean square error L as follows. Note, operation with "[ ]" indicates element-wise one.
| Dataset | Porto | Shanghai |
|---|---|---|
| trajectory number sampling interval area grid size travel time mean | 420,000 15s 16.7km×14.4km 128 × 128 | 1,018,000 10s 29.8km×37.9km 256 × 256 |
| 762.60s | 954.59s | |
| travel time std | 347.92s | 460.71s |
The dual interval loss not only minimizes the travel time estimation error of the whole path but also constrains the forward and backward interval estimation error of intermediate grids, which utilizes the intermediate time information of a trajectory. It has the following three advantages. First, the intermediate monitoring information to some extent increases the amount of data to help model training better. Second, adding the supervisory information in the middle can make the loss signal back-propagate more accurate and effective, which will reduce the risk of vanishing gradient for long sequences. Third, the dual loss exactly matches the BiLSTM characteristics, as each step of BiLSTM, it has the information from the starting grid to the current grid and that from the current grid to the ending grid, which can naturally be used by forward and backward interval loss. We will show the superiority of the dual interval loss in the experiment section.
3.3 Training
The goal of DEEPTRAVEL is to minimize the dual loss function L, i.e., minθ,E ∑Si=1 L(i) (θ, E). Here, θ denotes the trainable parameters in DEEPTRAVEL, and E refers to the spatial and temporal embedding vectors, S is the number of training trajectories and L(i) is the dual loss function of i-th trajectory data. The model is trained by employing derivatives of the loss w.r.t. all parameters through back-propagation-throughtime algorithm [Werbos, 1990].
4 Experiments
Datasets. Two real trajectory datasets are used in our experimental study, namely Porto and Shanghai. The Porto dataset is a 1.8GB open dataset, generated by 442 taxis from Jan. 07, 2013 to Jun. 30, 2014. The Shanghai one is generated by 13, 650 taxis from Apr. 01 to Apr. 17 in 2015 with the size of 16GB. We extract the trajectory trips occupied by passengers as valid trajectories. Table 1 reports the description and statistics of the two datasets.
Hyperparameters. For hyperparameters, we split each dataset into training set, validation set and test set in the ratio of 8:1:1. The embedding size of spatial and temporal embeddings is 100 and initialized uniformly to [-1, 1]. We set the hidden unit as 100 for both LSTM in traffic feature extraction and BiLSTM in prediction. We train the model using Adam [Kingma and Ba, 2014] with an initial learning rate at 0.002. All the weights are uniformly initialized to [-0.05,0.05].
Metrics. We adopt mean absolute error (MAE), mean absolute percentage error (MAPE) and root-mean-squared error
| Porto | Shanghai | ||||||
|---|---|---|---|---|---|---|---|
| Dataset Metrics | MAE (sec) | RMSE (sec) | MAPE | MAE (sec) | RMSE (sec) | MAPE | |
| OD based | TEMP[Wang et al., 2016] | 193.61 | 314.08 | 0.2505 | 248.70 | 353.47 | 0.2513 |
| Segment Based | spd-MEAN | 245.87 | 358.32 | 0.2847 | 430.74 | 550.43 | 0.4170 |
| ARIMA [Ahmed and Cook, 1979] | 227.40 | 517.51 | 0.2757 | 315.22 | 444.42 | 0.3074 | |
| SVR [Asif et al., 2014] | 241.41 | 353.35 | 0.2819 | 424.12 | 543.28 | 0.4085 | |
| SAE [Lv et al., 2015] | 222.06 | 357.02 | 0.2734 | 310.47 | 413.62 | 0.3013 | |
| spd-LSTM [Ma et al., 2015] | 217.37 | 334.00 | 0.2624 | 302.45 | 397.48 | 0.2945 | |
| Sub-path Based | RTTE [Rahmani et al., 2013] | 169.45 | 272.22 | 0.2234 | 214.01 | 307.77 | 0.2362 |
| PTTE [Wang et al., 2014] | 159.43 | 268.11 | 0.2072 | 168.48 | 248.92 | 0.1914 | |
| End-to-End | grid-MLP | 255.33 | 377.27 | 0.2933 | 423.53 | 541.19 | 0.3906 |
| grid-CNN | 250.86 | 363.17 | 0.2874 | 420.05 | 537.86 | 0.3885 | |
| grid-LSTM | 180.27 | 300.98 | 0.2334 | 235.74 | 348.30 | 0.2463 | |
| DEEPTRAVEL | 113.24 | 219.25 | 0.1337 | 126.59 | 196.85 | 0.1330 | |
(RMSE) as the major performance metrics, similar to existing approaches [Rahmani et al., 2013; Wang et al., 2014].
Approaches for comparison. For competitors, we implement spd-MEAN, ARIMA, SVR, SAE, spd-LSTM as representatives of segments-based approaches, RTTE and PTTE as representatives of sub-path based approaches, and TEMP as a representative of OD based approach. spd-MEAN estimates the speed of every segment by averaging from historical speeds. The remaining four segment-based approaches use different time series prediction models to predict the current speed of each segment given historical travel speeds, i.e., ARIMA uses auto-regressive integrated moving average model, SVR uses support vector regression model, SAE uses stacked auto-encoder model and spd-LSTM uses an LSTM model. RTTE develops a non-parametric approach which uses the travel time of the common sub-paths between the query path and historical paths and PTTE finds the optimal concatenation of trajectories through a dynamic programming solution. TEMP uses the travel time of neighbor origindestination pairs in history dataset to make the estimation.
In addition to the above existing competitors, we also propose three simple end-to-end models as baselines, namely grid-MLP, grid-CNN and grid-LSTM. grid-MLP uses multilayer perceptron (MLP) model to predict the travel time. We use a N × N matrix M as the input, with each element Mij capturing the travel length that the vehicle passes through the grid gij; and we use two hidden layers with 1024 units and sigmoid as activation function. grid-CNN uses convolutional neural network (CNN) model to perform the estimation. It accepts the same input M as grid-MLP. We use three convolutional layers, each having 64 3 × 3 filters with stride 1, and 3 max-pooling layers, each in the size of 2×2. Then it is followed by a fully-connected layer with 1024 units and sigmoid activation for prediction. grid-LSTM uses LSTM to predict the travel time. We set LSTMwith 100 hidden units, and feed it with the travel length of the present grid at each step. All three models adopt the mean relative squared error as the loss function. Note that DEEPTRAVEL is also an end-to-end model.
4.1 Overall Evaluation
The first set of experiments is to evaluate the performance of travel time estimation on the query path, with the results reported in Table 2. We observe that in general the subpath based approaches perform better than segment based and OD based approaches. This indicates that the interaction between adjacent road segments in a path is important. For segment based approaches, spd-LSTM outperforms others which demonstrates the power of LSTMmodel in capturing the features of time series data. For sub-path based approaches, PTTE performs better than RTTE since PTTE has an object function to model the trade-off between the length of a sub-path and the number of trajectories traversing the sub-path. For end-to-end approaches, DEEPTRAVEL is significantly better than others in all metrics. That is to say, a trivial neural network model can not predict the travel time well, and it is necessary to extract different features and adopt a more effective structure to construct the model like DEEPTRAVEL does. Note that grid-LSTM performs better than grid-MLP and grid-CNN. This is because a path only occupies a small part of grids in the whole city (< 1%). Accordingly, most elements of the input matrix M are zero and hence grid-MLP and grid-CNN are not able to learn such valid features well.
On the other hand, DEEPTRAVEL outperforms all the competitors with significant advantages. We can also observe from the results that segment-based approaches perform worse in Shanghai dataset than in Porto dataset; while subpath based approaches and DEEPTRAVEL are more robust in different datasets. Based on our understanding of the datasets, trajectories in Porto are sparser but the traffic condition of Shanghai changes more drastically. The results demonstrate that DEEPTRAVEL works very well for the different challenges faced by different datasets.
4.2 Performance of DEEPTRAVEL
The impact of different features. As DEEPTRAVEL takes in inputs from multiple features, we conduct the second set of experiments to study their effectiveness. We implement five different versions of DEEPTRAVEL with each taking in different feature inputs. ST only uses the spatial and temporal embeddings; NaiveTraf takes in the mean historical speed corresponding to the grid as the traffic feature; Traf only uses the traffic features in our model; ST+Traf accepts both traffic features as well as spatio-temporal embeddings as input; and ST+Traf+DS takes in all the features considered by DEEPTRAVEL (DS refers to driving state feature). As listed in Table 3, ST+Traf+DS outperforms other versions. ST+Traf performs better than both ST and Traf, which means that both traffic features and spatio-temporal embeddings play important roles in the prediction. The driving state feature also improves the performance, as ST+Traf+DS performs better than ST+Traf. The result of NaiveTraf is not as good as that of Traf especially in Shanghai dataset, which means that our construction of traffic feature is more effective than simple statistics, i.e., averaging historical speeds. It is worth noting that ST is better than Traf in Porto but worse than Traf in Shanghai, which showcases that the travel time of a path is greatly influenced by spatial location and time period in Porto, while it is mainly affected by the traffic condition in Shanghai which is a metropolis with heavy traffic flows.
| Dataset | Porto | Shanghai | ||
|---|---|---|---|---|
| Metrics | MAE (sec) | MAPE | MAE (sec) | MAPE |
| ST | 129.33 | 0.1505 | 197.58 | 0.1926 |
| NaiveTraf | 144.41 | 0.1688 | 199.06 | 0.1940 |
| Traf | 132.28 | 0.1537 | 153.95 | 0.1559 |
| ST+Traf | 114.47 | 0.1367 | 129.44 | 0.1362 |
| ST+Traf+DS | 113.24 | 0.1337 | 126.59 | 0.1330 |
| Dataset | Porto | Shanghai | ||
|---|---|---|---|---|
| Metrics | MAE (sec) | MAPE | MAE (sec) | MAPE |
| LSTMno aux | 130.57 | 0.1494 | 148.90 | 0.1506 |
| BiLSTMno aux | 128.85 | 0.1476 | 143.72 | 0.1475 |
| BiLSTMfor aux | 115.64 | 0.1369 | 128.56 | 0.1349 |
| BiLSTMback aux | 115.85 | 0.1372 | 128.77 | 0.1355 |
| BiLSTMdual aux | 113.24 | 0.1337 | 126.59 | 0.1330 |
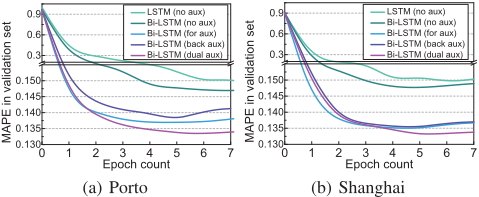
The effectiveness of different loss functions. In order to demonstrate the effectiveness of the proposed dual interval loss with auxiliary supervision, we compare it with other loss functions. We construct five baselines which share the same feature extraction layer as DEEPTRAVEL but different loss functions for training. To be more specific, LSTMno aux feeds features to an LSTM, and only uses the final hidden vector to predict the travel time (i.e., no auxiliary supervision). Like LSTMno aux, BiLSTMno aux uses the final forward and backward hidden state for prediction. Both BiLSTMfor aux and BiLSTMback aux leverage the auxiliary supervision, i.e., the time stamps of intermediate GPS points, but BiLSTMfor aux only uses the forward interval loss while BiLSTMback aux only optimizes the backward loss. BiLSTMdual aux is DEEPTRAVEL model which optimizes both forward and backward interval loss functions with auxiliary supervision.
We report the quantitative results in Table 4 and the MAPE curve in validation set w.r.t. training epochs in Figure 4. From the results, we can find that BiLSTMno aux performs better than LSTMno aux, which means that BiLSTM is able to capture correlations much better than LSTM. We also observe that all models with auxiliary supervision behave much better than models without auxiliary supervision and have a very fast convergence. This proves that the auxiliary supervision from additional interval loss benefits the back-propagation of loss signals, and the additional supervision is some kind of data augmentation which can improve the results, as analyzed in Section 3.2. Last, as we expect, BiLSTMdual aux performs better than BiLSTMfor aux and BiLSTMback aux, which demonstrates auxiliary supervisions from forward and backward are not redundant but complementary.
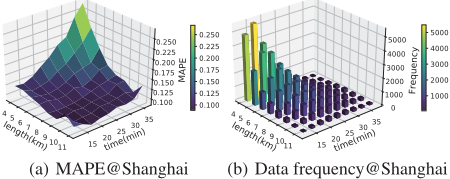
The performance of DEEPTRAVEL vs. length and travel time of paths. Last but not least, we partition the testing trajectory set into different subsets according to the length of the trajectories and the duration of the travel time. We report the MAPE of DEEPTRAVEL under Shanghai dataset, as a representative, in Figure 5(a). In general, DEEPTRAVEL performs well (i.e.., MAPE around 0.1). However, we do observe a performance drop when the path is short and the travel time is long, e.g., 4km and 35min. Firstly, this type of trajectories is abnormal as the travel time in most cases is proportional to the length of the path. For example, the paths with the length of 4km and the travel time of 35min mean the average speed is about 6.9km/h which is extremely slow, not much faster than the walking speed. By examining these trajectories from the dataset, we observe that most of them encounter unexpected congestion or stay at one place for a long time which can not be learned from historical data. The histogram in Figure 5(b) also proves that such trajectories are extremely rare.
5 Conclusion
In this paper, we present an end-to-end estimation model, namely DEEPTRAVEL, for estimating the travel time of a query path. We propose an unique feature extraction structure which takes multiple features into account. We also introduce the dual interval loss, which elegantly matches the characteristic of BiLSTM with that of trajectory data, to incorporate additional supervisory information naturally. We conduct experiments on real datasets to understand the role of different features and to demonstrate the superiority of DEEPTRAVEL.
Acknowledgments
This research is supported in part by the National Natural Science Foundation of China under grant 61772138, the National Key Research and Development Program of China under grant 2018YFB0505000 and the National Research Foundation, Prime Ministers Office, Singapore under its International Research Centres in Singapore Funding Initiative.
@inproceedings{ijcai2018p508,
  title     = {DeepTravel: a Neural Network Based Travel Time Estimation Model with Auxiliary Supervision},
  author    = {Zhang, Hanyuan and Wu, Hao and Sun, Weiwei and Zheng, Baihua},
  booktitle = {Proceedings of the Twenty-Seventh International Joint Conference on
               Artificial Intelligence, {IJCAI-18}},
  publisher = {International Joint Conferences on Artificial Intelligence Organization},
  editor    = {Jérôme Lang},
  pages     = {3655--3661},
  year      = {2018},
  month     = {7},
  note      = {Main track},
  doi       = {10.24963/ijcai.2018/508},
  url       = {https://doi.org/10.24963/ijcai.2018/508},
}
TY - CPAPER TI - DeepTravel: a Neural Network Based Travel Time Estimation Model with Auxiliary Supervision AU - Zhang, Hanyuan AU - Wu, Hao AU - Sun, Weiwei AU - Zheng, Baihua T2 - Proceedings of the Twenty-Seventh International Joint Conference on Artificial Intelligence, IJCAI-18 PB - International Joint Conferences on Artificial Intelligence Organization PY - 2018 SP - 3655 EP - 3661 DO - 10.24963/ijcai.2018/508 UR - https://doi.org/10.24963/ijcai.2018/508 ER -Copied
Machine-readable versions of this paper, for tools and AI agents:





