
Pairwise-Ranking based Collaborative Recurrent Neural Networks for Clinical Event Prediction
Proceedings of the Twenty-Seventh International Joint Conference on Artificial Intelligence. Main track. Pages 3520-3526.
https://doi.org/10.24963/ijcai.2018/489
Keywords
- Machine Learning: Deep Learning
- Machine Learning Applications: Bio;Medicine
- Machine Learning: Data Mining
Abstract
Patient Electronic Health Records (EHR) data consist of sequences of patient visits over time. Sequential prediction of patients' future clinical events (e.g., diagnoses) from their historical EHR data is a core research task and motives a series of predictive models including deep learning. The existing research mainly adopts a classification framework, which treats the observed and unobserved events as positive and negative classes. However, this may not be true in real clinical setting considering the high rate of missed diagnoses and human errors. In this paper, we propose to formulate the clinical event prediction problem as an events recommendation problem. An end-to-end pairwise-ranking based collaborative recurrent neural networks (PacRNN) is proposed to solve it, which firstly embeds patient clinical contexts with attention RNN, then uses Bayesian Personalized Ranking (BPR) regularized by disease co-occurrence to rank probabilities of patient-specific diseases, as well as use point process to provide simultaneous prediction of the occurring time of these diagnoses. Experimental results on two real world EHR datasets demonstrate the robust performance, interpretability, and efficacy of PacRNN.
- [Bahdanau et al., 2015] Dzmitry Bahdanau, Kyunghyun Cho, and Yoshua Bengio. Neural machine translation by jointly learning to align and translate. In Proceed- ings of the 3rd International Conference on Learning Representations (ICLR), 2015.
- [Baytas et al., 2017] Inci M. Baytas, Cao Xiao, Xi Zhang, Fei Wang, Anil K. Jain, and Jiayu Zhou. Patient subtyp- ing via time-aware lstm networks. In Proceedings of the 23rd ACM SIGKDD International Conference on Knowl- edge Discovery and Data Mining (KDD), 2017.
- [Cheng et al., 2016] Yu Cheng, Fei Wang, Ping Zhang, and Jianying Hu. Risk prediction with electronic health records: A deep learning approach. In Proceedings of SIAM International Conference on Data Mining (SDM), 2016.
- [Cho et al., 2014] Kyunghyun Cho, Bart van Merriënboer, C ¸aglar Gülc ¸ehre, Dzmitry Bahdanau, Fethi Bougares, Holger Schwenk, and Yoshua Bengio. Learning phrase representations using rnn encoder-decoder for statisti- cal machine translation. In Proceedings of Conference on Empirical Methods in Natural Language Processing (EMNLP), 2014.
- [Choi et al., 2016a] Edward Choi, Mohammad Taha Ba- hadori, Andy Schuetz, Walter F. Stewart, and Jimeng Sun. Doctor ai: Predicting clinical events via recurrent neural networks. In Proceedings of the 1st Machine Learning for Healthcare Conference (MLHC), 2016.
- [Choi et al., 2016b] Edward Choi, Mohammad Taha Ba- hadori, Jimeng Sun, Joshua Kulas, Andy Schuetz, and Walter Stewart. Retain: An interpretable predictive model for healthcare using reverse time attention mechanism. In Proceedings of Advances in Neural Information Process- ing Systems (NIPS). 2016.
- [Choi et al., 2016c] Edward Choi, Andy Schuetz, Walter F Stewart, and Jimeng Sun. Using recurrent neural network models for early detection of heart failure onset. Journal of the American Medical Informatics Association, 2016.
- [Donald et al., 1982] Connelly Donald, Benson Ellis, and Burke M. Clinical decisions and laboratory use. In Min- neapolis: University of Minnesota Press, 1982.
- [Du et al., 2016] Nan Du, Hanjun Dai, Rakshit Trivedi, Utkarsh Upadhyay, Manuel Gomez-Rodriguez, and Le Song. Recurrent marked temporal point processes: Embedding event history to vector. In Proceedings of the 22nd ACM SIGKDD International Conference on Knowl- edge Discovery and Data Mining (KDD), 2016.
- [Farhan et al., 2016] Wael Farhan, Zhimu Wang, Yingxiang Huang, Shuang Wang, Fei Wang, and Xiaoqian Jiang. A predictive model for medical events based on contextual embedding of temporal sequences. JMIR Medical Infor- matics, 4(4), 2016.
- [Hawkes, 1971] Alan G. Hawkes. Spectra of some self-exciting and mutually exciting point processes. Biometrika, 58(1):83-90, 1971.
- [Isaacson, 1989] Eugene Isaacson. Numerical recipes in c: The art of scientific computing. SIAM Review, 31(1):142- 142, 1989.
- [Li, 2011] Hang Li. A short introduction to learning to rank. IEICE Transactions, 94-D(10):1854-1862, 2011.
- [Liu et al., 2015] Chuanren Liu, Fei Wang, Jianying Hu, and Hui Xiong. Temporal phenotyping from longitudinal elec- tronic health records: A graph based framework. In Pro- ceedings of the 21st ACM SIGKDD International Confer- ence on Knowledge Discovery and Data Mining (KDD), 2015.
- [Ma et al., 2017] Fenglong Ma, Radha Chitta, Jing Zhou, Quanzeng You, Tong Sun, and Jing Gao. Dipole: Diag- nosis prediction in healthcare via attention-based bidirec- tional recurrent neural networks. In Proceedings of the 23rd ACM SIGKDD International Conference on Knowl- edge Discovery and Data Mining (KDD), 2017.
- [Qiao et al., 2014] Zhi Qiao, Peng Zhang, Yanan Cao, Chuan Zhou, Li Guo, and Binxing Fang. Combining het- erogenous social and geographical information for event recommendation. In Proceedings of AAAI Conference on Artificial Intelligence (AAAI), 2014.
- [Rendle et al., 2009] Steffen Rendle, Christoph Freuden- thaler, Zeno Gantner, and Lars Schmidt-Thieme. BPR: Bayesian personalized ranking from implicit feedback. In Proceedings of the 25th Conference on Uncertainty in Ar- tificial Intelligence (UAI), 2009.
- [Sebastian et al., 2009] Köhler Sebastian, H. Schulz Marcel, Krawitz Peter, Bauer Sebastian, Dölken Sandra, E. Ott Claus, Mundlos Christine, Horn Denise, Mundlos Stefan, and N. Robinson Peter. Clinical diagnostics in human ge- netics with semantic similarity searches in ontologies. In American Journal of Human Genetics, 2009.
- [Tengfei et al., 2018] Ma Tengfei, Cao Xiao, and Fei Wang. Health-atm: A deep architecture for multifaceted patient health record representation and risk prediction. In Pro- ceedings of SIAM International Conference on Data Min- ing (SDM), 2018.
- [Xiao et al., 2017] Shuai Xiao, Junchi Yan, Xiaokang Yang, Hongyuan Zha, and Stephen M. Chu. Modeling the in- tensity function of point process via recurrent neural net- works. In Proceedings of the 31st AAAI Conference on Artificial Intelligence (AAAI), 2017.
- [Yuan et al., 2011] Quan Yuan, Li Chen, and Shiwan Zhao. Factorization vs. regularization: Fusing heterogeneous so- cial relationships in top-n recommendation. In Proceed- ings of 5th ACM Conference on Recommender Systems (RecSys), 2011.
References were extracted automatically from the PDF and may contain errors.
Full text extracted automatically from the PDF; figures, tables and equations may differ. The PDF is the version of record.
1 Introduction
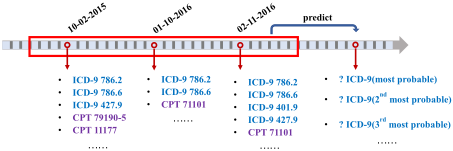
The Electronic Health Records (EHR) data consist of sequences of patient visits over time. Each visit is composed by a set of medical events, including diagnoses, procedures, etc. Fig. 1 shows a segment of longitudinal EHR.
Sequential prediction of clinical events (e.g., diagnoses) based on longitudinal EHR data is a core research task that could support decision makings. However, there are lots of challenges on working with EHR, such as event temporality, high-dimensionalily, and visit irregularity. Such challenges motivated a series of machine learningmodels for EHR-based
……
……
Figure 1: An example segment of longitudinal patient records. Our task is to predict next set of ranked diagnoses and their occurring time.
phenotyping and event predictions. To name a few, in [Choi et al., 2016c; Cheng et al., 2016], temporal dynamics among clinical events were captured using RNNs or CNNs to improve prediction of heart failure onsets. In [Ma et al., 2017; Tengfei et al., 2018], attention mechanism was introduced to add more interpretability to the prediction results. In [Farhan et al., 2016; Liu et al., 2015], low dimensional clinical concept embedding was used to provide better predictions.
In real clinical setting, the physicians need to deal with a large number of patient-specific clinical observations, and link them with the known manifestations of various diseases to infer the best diagnosis [Donald et al., 1982; Sebastian et al., 2009]. However, because of the complexity and ambiguity of complicated diseases, there is a high rate of misdiagnosis and missed diagnosis across the entire world. Therefore it may not be appropriate to formulate clinical event prediction as a hard classification problem as in previous research. The unobserved events could be missed or left out by error.
Based on the above considerations, we propose to treat clinical event prediction as a recommendation problem. We propose PacRNN, an end-to-end pairwise-ranking based collaborative recurrent neural network model to tackle this problem. PacRNN first embeds patient clinical contexts with attention RNN, then uses typical pairwise ranking method BPR regularized by disease co-occurrence to rank potential patient-specific diseases. Point process is utilized to estimate of the observed time of these predicted diagnoses as well. Below we highlight the several contributions of PacRNN.
- Personalized Ranking based Modeling: We formulate
clinical event prediction as a recommendation problem, which captures the potential missingness and human error in patient EHR in a more robust way. A latent factor model based BPR with disease correlation regularization is proposed to estimate the diagnoses rankings for each visit.
- Explicit Modeling of Diagnoses Time: We leverage point process to explicitly predict the time of predicted diagnoses. This is done by viewing the intensity function of a point process as a nonlinear function of the history information learned from RNN to simultaneously make next visit time prediction.
The rest of this paper is organized as follows: In Section 2, we discuss the connection of the proposed approaches to related work. Section 3 presents the preliminary of the work. Section 4 shows the details of the proposed PacRNN. The experimental results are presented in Section 5. Section 6 concludes the paper.
2 RelatedWork
Sequential prediction of clinical events based on EHR data is a hot research topic and has attracted many attentions. Most of existing models utilize RNNs for predicting the future diagnoses. RETAIN [Choi et al., 2016b] is an interpretable predictive model, which employs reverse time attention mechanism in an RNN for binary prediction task. Dipole [Ma et al., 2017] employs bidirectional recurrent neural networks and introduces three attention mechanisms to measure the relationships of different visits for the prediction. TLSTM [Baytas et al., 2017] is proposed to handle irregular time intervals by learning a subspace decomposition of the cell memory which enables time decay to discount the memory content according to the elapsed time. These existing works cannot predict diagnosis and future visit time simultaneously. DoctorAI [Choi et al., 2016a] can make both types of predictions, while it is a straightforward approach with simple RNN for sequential patient data modeling. None of these methods directly optimizes for diagnosis ranking.
Point process has been a principled framework for modeling event dynamics, such as Hawkes processes [Hawkes, 1971]. Some studies combined point process and RNN to improve time prediction performance. RMTPP [Du et al., 2016] proposed recurrent point process to make next occurring time prediction. [Xiao et al., 2017] proposed modeling the intensity function of point process via recurrent neural networks. In this paper, we incorporate point process to explicitly predict the time of predicted diagnoses.
3 Preliminary
In EHR data, each disease code can be mapped to a node of the International Classification of Diseases (ICD-9) 1 , and procedure code to a node of the Current Procedural Terminology (CPT) 2 . For notation purposes, let D = {d1, d2, ..., d|D|} denote the set of |D| disease codes, M = {m1,m2, ...,m|M|}
1 https://en.wikipedia.org/wiki/List_of_ICD-9_codes
2 https://en.wikipedia.org/wiki/Current_Procedural_Terminology
the set of |M| medical codes which consist of diseases and procedures, D ⊂ M. Let i be the index of the N patients, and the i-th patient has Ji historical visits. For notation simplicity, we will describe our algorithm with a single patient and omit the index i. Then the patient can be represented by a sequence of visits {x1, x2, ..., xJ}. Each visit, containing a subset of medical codes, is encoded by a multi-hot vector, xj ∈ {0, 1}|M| , where the g-th element is 1 if the j-th visit contains the code mg.
The core tasks in PacRNN are to predict the diagnoses oJ+1 and visit time tJ+1 of the future visit at J + 1, given the sequence of the historical J visits.
4 Methods
In this section, we describe our algorithm, Pairwise-Ranking based Collaborative Recurrent Neural Networks (PacRNN), which is an end-to-end, simple and robust model for simultaneously future diagnoses and occurring time prediction.
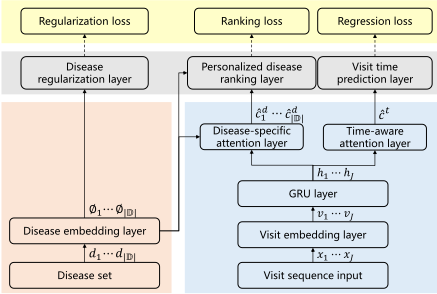
Fig. 2 shows the overall design of PacRNN. First, the set of disease codes are embedded into vectors {φk, k = 1...|D|} and then pass through disease regularization, attention and disease ranking layers. Second, given a sequence of historical visits {x1, x2, ..., xJ} from a patient, we embed each visit xj into a dense vector vj. The vector vj is then fed into the Gated recurrent units (GRUs) [Cho et al., 2014], which output a hidden state hj as the representation of the j-th visit. With disease factors {φk, k = 1...|D|} and hidden states {hj, j = 1...J}, we generate two sets of attention weights. One is used for computing disease-specific patient representation {ˆ cdk , k = 1...|D|}, which is then used to rank disease codes of the future visit at time J + 1. The other is used for computing time-aware patient representation ˆ ct . Based on ˆ ct , we can formulate the conditional intensity function for the future visit time prediction.
4.1 Patient Representation Learning
Given a visit xj ∈ {0, 1}|M| , we can obtain its dense vector representation vj ∈ Rl via vj = ReLU(Wvxj + bv), where l is the size of embedding dimension, Wv ∈ Rl×|M| is the embedding matrix of medical codes, and bv ∈ Rl is the bias vector. The reason we employ the ReLU as the activation function is that ReLU enables the learned vector representations to be interpretable. In the implementation, we use word2vec method to map medical codes M into l dimensional dense representation as the initialization of Wv. The embedding vector vj is then fed into GRUs, and each unit outputs a hidden state hj as the representation of j-th visit of the patient.
Then we compute the disease-specific attention weights by adopting the approach similar to [Bahdanau et al., 2015]. In particular, given the disease factor set {φk, k = 1...|D|}, and hidden states {hj , j = 1...J} of a patient, αdk is computed as:
where
is an alignment model which scores how well φk and hj match. W d a ∈ Rp×p , U d a ∈ Rp×2p and V d a ∈ Rp are the parameters to be learned. Based on αd k , we can derive diseasespecific contextual state as cdk = ∑Jj=1 αdk,j ∗ hj. Concatenated with the last hidden state hJ, we have the diseasespecific patient representation ˆ cdk = ReLU(Wd[hJ , cdk ]).
We also use self-attention mechanism to learn time-aware attention weights for the future visit time prediction. The selfattention function is to calculate the weights solely from the current hidden state hj: etj = V t a T tanh(W t a hj + bta ), where W t a ∈ Rp×p , bta ∈ Rp and V t a ∈ Rp are the parameters to be learned. Then, we can obtain the attention weight vector α using softmax function. Based on α, we can derive timeaware contextual state as ct = ∑Jj=1 αj ∗ hj and time-aware patient representation ˆ ct = ReLU(Wt[hJ , ct ]).
4.2 Bayesian Personalized Ranking for Diagnosis Modeling
In real clinical settings, doctors often assign several disease codes to patients as diagnosis, ranked by the severity and possibility of these diseases. The diagnosis prediction can be considered as the ranking of diseases give the current state of a patient. In this paper, we explicitly optimize on patient-specific ranking of disease by using learning to rank approach, which is employed in a wide variety of applications in information retrieval, natural language processing, and data mining [Li, 2011; Qiao et al., 2014].
Formally, given a patient u with diagnoses oJ+1 (further denoted by D+ for convenience) at visit J+1. We then denote D- = D\D+. We assume that the patient u intends to have a disease in D+ over all diseases in D-. In this paper, we adopt BPR [Rendle et al., 2009] to model such ranking problem with the pairwise ranking loss. In particular, we compare each positive disease in D+ with several sampled negative diseases in D-, and compute the loss as:
where Θ = (ˆ cd , φ, bs), ˆ cd is the set of disease-specific patient representation, φ is the set of latent factors of diseases, and bs is the bias. s(u, dk) is the score function, representing the possibility of patient u having disease dk. The score function is defined as s(u, dk) = ˆ cdk · φk + bd , and P (s(u, dk) > s(u, dk′ )|Θ) is then defined as:
Regularization based on Disease Correlation
With latent factor based BPR framework, we can easily integrate extra knowledge by joint matrix factorization and/or regularization [Yuan et al., 2011]. In this paper, we regularize latent factors of diseases by their co-occurrence, assuming that frequent co-occurring diseases tend to have similar representations. We firstly construct correlation network among diseases:
where ∆k represents the set of visits containing disease k, |∆k ∩∆k′ | denotes the number of the set of visits containing both disease k and k′ , and |∆k ∪∆k′ | the number of the set with either diseases.
After we derive the disease correlation network, we incur regularization term for disease latent factors and add a Gaussian prior in the model:
where brel is the bias.
4.3 Future Visit Time Modeling
Point process is an effective mathematical tool to model sequential data. Point process models the dynamics of the sequence by using the conditional intensity function λ(t): for a short time window [t, t + dt), λ(t)dt = P{event in [t, t + dt)|Ht} is the probability of the occurrence of a new event conditioned on the history Ht. Given the conditional density function f(t) and its corresponding cumulative distribution function F(t), the conditional intensity function can be specified as:
Then the conditional density function can be obtained by:
Conditional Intensity based on Historical Information
Based on time-aware patient representation ˆ ct of the i-th patient, we can now formulate the conditional intensity function by:
where τ is a column vector, and bt is a scalar as the bias. αζ represents the time-aware weight. More specifically: 1) The first term represents the accumulative influence from the historical visits. Compared to the fixed parametric formulations of typical point process methods for the past influence, we now have a highly non-linear general specification of the dependency over the history. 2) The second term emphasizes the influence of time. 3) The last term gives a base intensity level for the occurrence of the next event. The exponential function outside acts as a non-linear transformation and guarantees that the intensity is positive.
Based on Eq. 6 and 7, we can derive the likelihood that the next visit will occur at the time J +1 given the history by the following equation:
4.4 Joint Optimization
Deep neural networks are flexible to mix and match different input signals and capture their correlations through hidden layers. Latent representation of users, often used in factor models, can be easily incorporated into our network just like other embedding representations do. Having the two tasks at hand and the inputs, we consider solving them jointly. The parameters in model are then trained by minimizing the combined objective:
where βt, βr are hyperparameters used for tuning impacts from the regression loss of time prediction and regularization loss of disease correlation to the overall loss.
4.5 Diagnosis and Time Prediction
Diagnosis Prediction. After we learn the disease factor set φ = {φ1, φ2, ..., φD} and the disease-specific patient representation set ˆ cd = {ˆ cd1 , ˆ cd2 , ..., ˆ cd|D| }, we can make personalized diagnosis prediction by:
We sort the diseases for the patient u in descending order according to their scores, and return the top-k diseases as diagnosis.
Time Prediction. We estimate the timing for the next event using the expectation:
In general, the integration in above equation does not have analytic solutions, so we can apply commonly used numerical integration techniques [Isaacson, 1989] for one-dimensional functions to compute above equation instead.
| Datasets | CMS(08-10) | MIMIC III |
|---|---|---|
| # of patients | 755,215 | 46,520 |
| # of visits | 1,332,822 | 58,976 |
| Avg. # of visits per patient | 1.76 | 1.27 |
| # of unique medical codes | 18,599 | 9,017 |
| -# of unique diagnose codes | 7,873 | 6,985 |
| -# of unique procedure codes | 10,726 | 2,032 |
5 Experiments
5.1 Dataset
We conduct experiments on two real world datasets, CMS (2008-2010) 3 and MIMIC III 4 . CMS is synthetic medical claims data while MIMIC is clinical data collected from ICU patients. MIMIC dataset mainly consists of clinical logs of patients admitted to critical care units with serious conditions. The statistics of the two datasets are provided in Table 1. For CMS dataset, we remove patients with less than four visit. Similarly, for small volume MIMIC III dataset, we remove patients with less than three visits.
For both datasets, each visit is represented by a set of structured medical codes, including disease codes (ICD 9) and procedure codes. There have more than 5,000 unique ICD9 codes and 2,000 procedure codes for both datasets. To reduce the size of feature set and avoid information overload, we group codes into coarse-grained categories. For both disease and procedure codes, we extract the top-2 digits, yielding 112 unique disease groups and 112 unique procedure groups for CMS data, 110 disease groups and 109 procedure groups for MIMIC III data.
We randomly split the dataset into training, validation and testing sets in the ratio 8:1:1, where the validation set is used to determine the best values of parameters.
5.2 Settings
In order to verify the performance gain by introducing the regularization of the disease correlation, we create two variants for our method: one with regularization (PacRNN), the other without regularization (PacRNNwr). We then compare our methods with the state-of-the-art approaches for diagnosis prediction and future visit time prediction, respectively. Diagnosis prediction task. Three state-of-the-art methods are selected as baselines for diagnosis prediction task:
- DoctorAI: [Choi et al., 2016a] embeds visits into vector representations and then feeds them into the GRUs. The hidden states of the GRUs are used to predict the medical codes of the future visit.
- RETAIN: [Choi et al., 2016b] proposes an interpretable predictive model in healthcare with reverse time attention mechanism.
- Dipole: [Ma et al., 2017] uses attention-based bidirectional recurrent neural networks for diagnosis prediction.
3 https://www.cms.gov
4 https://physionet.org
| Datasets | Methods | Dx | Dx&Time | |||||
|---|---|---|---|---|---|---|---|---|
| Recall@10 | Recall@20 | Recall@30 | Recall@10 | Recall@20 | Recall@30 | RMSE | ||
| Dipole | 0.4624 | 0.6840 | 0.8172 | N/A | ||||
| Retain | 0.4572 | 0.6835 | 0.8150 | N/A | ||||
| CMS DoctorAI | 0.4552 | 0.6804 | 0.8122 | 0.4516 | 0.6810 | 0.8121 | 2.0636 | |
| PacRNNwr | 0.4662 | 0.6889 | 0.8216 | 0.4641 | 0.6871 | 0.8211 | 1.9939 | |
| PacRNN | 0.4681 | 0.6893 | 0.8222 | 0.4663 | 0.6887 | 0.8217 | 1.9813 | |
| Dipole | 0.5094 | 0.7235 | 0.8417 | N/A | ||||
| Retain | 0.4698 | 0.7068 | 0.8335 | N/A | ||||
| MIMIC III DoctorAI | 0.4655 | 0.6959 | 0.8323 | 0.4627 | 0.6979 | 0.8297 | 1.4282 | |
| PacRNNwr | 0.5584 | 0.7704 | 0.8747 | 0.5555 | 0.7617 | 0.8702 | 1.2952 | |
| PacRNN | 0.5665 | 0.7749 | 0.8779 | 0.5631 | 0.7640 | 0.8733 | 1.2843 | |
| Methods | CMS | MIMIC III | ||
|---|---|---|---|---|
| Dx | Dx&Time | Dx | Dx&Time | |
| Dipole | 0.8745 | N/A | 0.8905 | N/A |
| Retain | 0.8728 | N/A | 0.8887 | N/A |
| DoctorAI | 0.8717 | 0.8712 | 0.8864 | 0.8857 |
| PacRNNwr | 0.8776 | 0.8769 | 0.9063 | 0.9042 |
| PacRNN | 0.8781 | 0.8773 | 0.9091 | 0.9074 |
Time prediction task. We further compare our method with the following approaches for evaluating the performance of visit time prediction:
- DoctorAI: It is also capable of predicting time.
- Homogeneous Poisson Process: The intensity function is a constant, which produces an estimate of the average inter-event gaps.
- Hawkes Process: We fit a self-excitation Hawkes process for the intensity function modeling λ(t) = γ0 + α ∑tj<t γ(t, tj).
- Self-correcting Process: We fit a self-correcting process for the intensity function modeling λ(t) = exp(µt - ∑tj<t α).
Evaluation Metrics. To evaluate the performance of each method on diagnosis prediction task, we adopt the Top-k recall and AUC score as measurement metrics. Top-k recall is defined as the number of correct diagnosis codes in top k ranked list divided by the number of ground-truth diagnoses. In our experiments, we set k to be 10, 20, and 30. AUC [Rendle et al., 2009] measures the overall results of pairwise ranking. It is suitable for highly imbalanced datasets, as in our case where the negative diseases take a high proportion.
where I(·) is an indicator function that equals to 1 if s(ui, dj) > s(ui, dk), otherwise 0.
To evaluate the performance of each method on time prediction task, we adopt root-mean-square error (RMSE) which is a frequently used measure of the differences between real values and predicted values.
Implementation Details. We set βt = 1 and βr = 0.01 with the help of validation set. In all experiments, the learning rate is set to be 0.001, embedding size l = 50 and hidden state size p = 50 for baselines and our methods. We also use regularization (l2 norm with the coefficient 0.0001), drop-out strategies (with the drop-out rate 0.5) and batch size 20 for all methods.
In BPR, ranking loss optimization on all disease pairs (dk, dk′) ∈ (D+,D-) of each patient leads to poor convergence owing to negative skewness, and high computation cost (O(|D+||D-|)). Therefore, for each dk ∈ D+, we randomly sample 10 diagnosis d′k ∈ D-.
We perform 100 iterations and report the best performance for each method.
5.3 Experimental Results
Diagnosis Prediction Results
Table 2 shows the accuracies of the proposed PacRNN model and baselines on both CMS and MIMIC III datasets for the diagnosis prediction task. We report the results in two settings: (i) optimization only for Diagnosis Prediction (Dx) and (ii) joint optimization for both diagnosis and time predictions (Dx&Time).
In Table 2, one can observe that the accuracies on the MIMIC III dataset are higher than those on the CMS dataset. The reason is that CMS is a kind of claims data, in which revisit to hospitals can be affected by many personal factors, such as financial status, the location of residence, means of transportation, and lifestyle. In comparison, MIMIC III is collected from ICU, in which diseases are generally severe and have high possibility to reoccur.
| ICD Code (Real) | Description | ICD Code (PacRNN) | Description | ICD Code (Doc- torAI) | Description | |
|---|---|---|---|---|---|---|
| 1 | 82 | Fractures | 20 | Malignant Neoplasm of Lym- phatic and Hematopoietic Poi- etic Tissue | 78* | Symptoms |
| 2 | 99 | Other and Unspecified Effects of External Causes | 51* | Other Diseases of Respira- tory System | 49 | Chronic Obstructive Pul- monary Disease and Allied Conditions |
| 3 | 51 | Other Diseases of Respiratory System | 99* | Other and Unspecified Ef- fects of External Causes | 28 | Diseases of the Blood and Blood-Forming |
| 4 | 48 | Pneumonia and Influenza | 27 | Other Metabolic and Immu- nity Disorders | 40 | Hypertensive Disease |
| 5 | 57 | Other Diseases of Digestive System | 48* | Pneumonia and Influenza | 27 | Other Metabolic and Immu- nity Disorders |
| 6 | 42 | Other Forms of Heart Disease | 26 | Nutritional Deficiencies | 30 | Neurotic Disorders, Person- ality Disorders and Other Nonpsychotic Mental Disor- ders |
| 7 | 03 | Other Bacterial Diseases | 03* | Other Bacterial Diseases | 45 | Diseases of Veins and Lym- phatics and Other Diseases of Circulatory System |
| 8 | 78 | Symptoms | 78* | Symptoms | 03* | Other Bacterial Diseases |
| 9 | 28 | Diseases of the Blood and Blood-Forming Organ | 57* | Other Diseases of Digestive System | ||
| 10 | 29 | Psychosis | 99* | Other and Unspecified Ef- fects of External Causes |
We note that the accuracy of DoctorAI is somewhat lower than others on both datasets. The main reason is that DoctorAI is the only one without using attention mechanism. It predicts the diagnosis depending on the last hidden state of the RNN, which cannot memorize all the past information, causing that DoctorAI mainly focuses on the information of recent visits. However, RETAIN, Dipole and our methods, i.e., PacRNNwr and PacRNN, can take all the visits into consideration. By assigning different attention weights to each visit, these methods achieve better performance than DoctorAI. Furthermore, our methods directly optimize for ranking, outperform Retain and Dipole on both datasets.
Compared with PacRNNwr, PacRNN achieves better performance by regularizing latent factors of diseases by their co-occurrence, assuming that frequent co-occurring diseases tend to have similar representation. Note that the accuracies of the joint task are lower than those of the task only predicting diagnosis, because that the hypothesis space of the joint prediction task is larger.
We also measure all methods by AUC metrics. The results are shown in Table 3. Similarly, our proposed models, PacRNNwr and PacRNN achieve better ranking performance.
Time Prediction Results
We use the expectation of the log time interval between the current and next events as our estimation. For PacRNN, PacRNNwr and DoctorAI, we make the time prediction by jointly optimizing diagnosis prediction and time prediction, namely, with setting Dx&Time as shown in Table 2.
The right column of Table 2 shows the RMSE values for the time prediction task, the smaller the better. Note that only DoctorAI of the baselines in Table 2 is capable of predicting next visit time. One can observe that our methods outperform DoctorAI on both datasets, demonstrating that time prediction models based on point process can achieve higher accuracy. Again, attention mechanism proves to be useful in time prediction task.
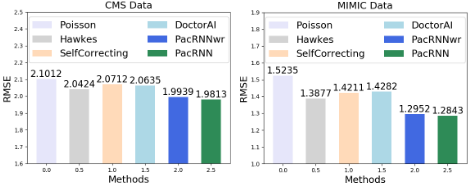
To further verify the performance of our methods on time prediction task. We introduce more point process based baselines. Fig. 3 shows the time prediction accuracies of all methods. It shows that our methods PacRNNwr and PacRNN have better performance. Hawkes processes, Homogeneous Poisson Process, and Self-correcting Process are all typical point process models, which are making specific assumptions about the functional forms of the generative processes, which may not reflect the reality, and thus the respective fixed parametric representations may restrict the expressive power of these models.
Case Study
Table 4 shows one example patient from real MIMIC III data, with top-10 diseases predicted by PacRNN and DoctorAI. The ICD codes marked with an asterisk are correctly predicted. Our method has better ranking performance (3 correct ones in top-5) than DoctorAI (1 in top-5). It is worth noting that ICD code 51 (Other Diseases of Respiratory System) and 48 (Pneumonia and Influenza) are correctly diagnosed by PacRNN, in the rank positions of 2 and 5 respectively. Both diseases are not observed in the historical visits of this patient, demonstrating that our method is capable of predicting new diseases. The two diseases (ICD code 51 and 48) often co-occur. Regularization based on disease correlation can help for correct predictions.
6 Conclusions
In this paper, we propose to formulate the clinical event prediction problem as a pairwise ranking problem considering the high rate of misdiagnosis and missed diagnosis across the entire world. We propose PacRNN, an end-to-end pairwiseranking based collaborative recurrent neural networks for clinical event prediction. Experimental results on two real world EHR datasets demonstrate the robust performance, interpretability, and efficacy of PacRNN.
Acknowledgments
The work of Fei Wang is supported by NSF IIS-1750326 and IIS-1716432.
@inproceedings{ijcai2018p489,
  title     = {Pairwise-Ranking based Collaborative Recurrent Neural Networks for Clinical Event Prediction},
  author    = {Qiao, Zhi and Zhao, Shiwan and Xiao, Cao and Li, Xiang and Qin, Yong and Wang, Fei},
  booktitle = {Proceedings of the Twenty-Seventh International Joint Conference on
               Artificial Intelligence, {IJCAI-18}},
  publisher = {International Joint Conferences on Artificial Intelligence Organization},
  editor    = {Jérôme Lang},
  pages     = {3520--3526},
  year      = {2018},
  month     = {7},
  note      = {Main track},
  doi       = {10.24963/ijcai.2018/489},
  url       = {https://doi.org/10.24963/ijcai.2018/489},
}
TY - CPAPER TI - Pairwise-Ranking based Collaborative Recurrent Neural Networks for Clinical Event Prediction AU - Qiao, Zhi AU - Zhao, Shiwan AU - Xiao, Cao AU - Li, Xiang AU - Qin, Yong AU - Wang, Fei T2 - Proceedings of the Twenty-Seventh International Joint Conference on Artificial Intelligence, IJCAI-18 PB - International Joint Conferences on Artificial Intelligence Organization PY - 2018 SP - 3520 EP - 3526 DO - 10.24963/ijcai.2018/489 UR - https://doi.org/10.24963/ijcai.2018/489 ER -Copied
Machine-readable versions of this paper, for tools and AI agents:





