
Cross-Domain Depression Detection via Harvesting Social Media
Proceedings of the Twenty-Seventh International Joint Conference on Artificial Intelligence. Main track. Pages 1611-1617.
https://doi.org/10.24963/ijcai.2018/223
Keywords
- Multidisciplinary Topics and Applications: Multidisciplinary Topics and Applications
- Humans and AI: Personalization and User Modeling
- Machine Learning Applications: Humanities
Abstract
Depression detection is a significant issue for human well-being. In previous studies, online detection has proven effective in Twitter, enabling proactive care for depressed users. Owing to cultural differences, replicating the method to other social media platforms, such as Chinese Weibo, however, might lead to poor performance because of insufficient available labeled (self-reported depression) data for model training. In this paper, we study an interesting but challenging problem of enhancing detection in a certain target domain (e.g. Weibo) with ample Twitter data as the source domain. We first systematically analyze the depression-related feature patterns across domains and summarize two major detection challenges, namely isomerism and divergency. We further propose a cross-domain Deep Neural Network model with Feature Adaptive Transformation & Combination strategy (DNN-FATC) that transfers the relevant information across heterogeneous domains. Experiments demonstrate improved performance compared to existing heterogeneous transfer methods or training directly in the target domain (over 3.4% improvement in F1), indicating the potential of our model to enable depression detection via social media for more countries with different cultural settings.
- [Chattopadhyay et al., 2012] Rita Chattopadhyay, Qian Sun, Wei Fan, Ian Davidson, Sethuraman Panchanathan, and Jieping Ye. Multisource domain adaptation and its application to early detec- tion of fatigue. ACM Transactions on Knowledge Discovery from Data (TKDD), 6(4):18, 2012.
- [Choudhury et al., 2013] Munmun De Choudhury, Michael Ga- mon, Scott Counts, and Eric Horvitz. Predicting depression via social media. In Proceedings of the International Conference on Weblogs and Social Media, pages 128-137, 2013.
- [Daumé III, 2007] Hal Daumé III. Frustratingly easy domain adap- tation. In Proceedings of the 45th Annual Meeting of the Associ- ation of Computational Linguistics, pages 256-263, 2007.
- [Gao et al., 2013] Rui Gao, Bibo Hao, He Li, Yusong Gao, and Tingshao Zhu. Developing simplified chinese psychological lin- guistic analysis dictionary for microblog. In International Con- ference on Brain and Health Informatics, pages 359-368, 2013.
- [Hoffman et al., 2013] Judy Hoffman, Erik Rodner, Jeff Donahue, Kate Saenko, and Trevor Darrell. Efficient learning of domain- invariant image representations. In International Conference on Learning Representations, 2013.
- [Kailath, 1967] Thomas Kailath. The divergence and bhattacharyya distance measures in signal selection. IEEE transactions on com- munication technology, 15(1):52-60, 1967.
- [Kleinman, 2004] Arthur Kleinman. Culture and depression. New England Journal of Medicine, 351(10):951-953, 2004.
- [Kobayashi, 1981] Shigenobu Kobayashi. The aim and method of the color image scale. Color research & application, 6(2):93- 107, 1981.
- [Kulis et al., 2011] B Kulis, K Saenko, and T Darrell. What you saw is not what you get: Domain adaptation using asymmetric kernel transforms. In Computer Vision and Pattern Recognition, pages 1785-1792, 2011.
- [Li et al., 2014] Wen Li, Lixin Duan, Dong Xu, and Ivor W. Tsang. Learning with augmented features for supervised and semi- supervised heterogeneous domain adaptation. IEEE Transactions on Pattern Analysis and Machine Intelligence, 36(6):1134-1148, June 2014.
- [Li et al., 2015] Ang Li, Bibo Hao, Shuoting Bai, Zhu Tingshao, et al. Predicting psychological features based on web behavioral data: Mental health status and subjective well-being. Chinese Science Bulletin, 11:994-1001, 2015.
- [Park et al., 2012] Minsu Park, Chiyoung Cha, and Meeyoung Cha. Depressive moods of users portrayed in twitter. In Proceedings of the ACM SIGKDD Workshop on healthcare informatics, pages 1-8, 2012.
- [Park et al., 2013] Minsu Park, David W. McDonald, and Meey- oung Cha. Perception differences between the depressed and non-depressed users in twitter. In Proceedings of the Interna- tional Conference on Weblogs and Social Media, pages 476-485, 2013.
- [Pennebaker et al., 2001] James W. Pennebaker, Martha E. Francis, and Roger J. Booth. Linguistic inquiry and word count: Liwc 2001. Mahway: Lawrence Erlbaum Associates, 2001.
- [Piccinelli and Wilkinson, 2000] Marco Piccinelli and Greg Wilkinson. Gender differences in depression. The British Journal of Psychiatry, 177(6):486-492, 2000.
- [Resnik et al., 2015] Philip Resnik, William Armstrong, Leonardo Claudino, Thang Nguyen, Viet An Nguyen, and Jordan Boyd- Graber. Beyond lda: Exploring supervised topic modeling for depression-related language in twitter. In Proceedings of the 2nd Workshop on Computational Linguistics and Clinical Psychol- ogy: From Linguistic Signal to Clinical Reality, pages 99-107, 2015.
- [Rothe et al., 1996] I. Rothe, H. Susse, and K. Voss. The method of normalization to determine invariants. IEEE Transactions on Pattern Analysis & Machine Intelligence, 18(4):366-376, 1996.
- [Shen et al., 2017] Guangyao Shen, Jia Jia, Liqiang Nie, Fuli Feng, Cunjun Zhang, Tianrui Hu, Tat-Seng Chua, and Wenwu Zhu. De- pression detection via harvesting social media: A multimodal dic- tionary learning solution. In Proceedings of the Twenty-Sixth International Joint Conference on Artificial Intelligence, pages 3838-3844, 2017. IJCAI
- [Wang and Liu, 2004] Danfen Wang and Linlan Liu. The depres- sion of chinese and the reflection related to their society and cul- ture. Chinese General Practice, 7(5):315-317, 2004.
- [Wang et al., 2013a] Xinyu Wang, Chunhong Zhang, Yang Ji, Li Sun, Leijia Wu, and Zhana Bao. A depression detection model based on sentiment analysis in micro-blog social network. In the International Workshops on Trends and Applications in Knowl- edge Discovery and Data Mining, pages 201-213, 2013.
- [Wang et al., 2013b] Xinyu Wang, Chunhong Zhang, and Li Sun. An improved model for depression detection in micro-blog so- cial network. In the International Conference on Data Mining Workshops, pages 80-87, 2013.
- [Wang et al., 2014] Xiaohui Wang, Jia Jia, Jiaming Yin, and Lian- hong Cai. Interpretable aesthetic features for affective image classification. In IEEE International Conference on Image Pro- cessing, pages 3230-3234, 2014.
- [Weiss et al., 2016] Karl Weiss, Taghi M Khoshgoftaar, and DingDing Wang. A survey of transfer learning. Journal of Big Data, 3(1):9, 2016.
- [WHO, 1992] WHO. The ICD-10 classification of mental and be- havioural disorders: clinical descriptions and diagnostic guide- lines, volume 1. World Health Organization, 1992.
- [WHO, 2017] WHO. Depression and other common mental disor- ders: global health estimates. World Health Organization, 2017.
- [Xu and Zhang, 2016] Ronghua Xu and Qingpeng Zhang. Under- standing online health groups for depression: Social network and linguistic perspectives. Journal of Medical Internet Research, 18(3):e63, 2016.
References were extracted automatically from the PDF and may contain errors.
Full text extracted automatically from the PDF; figures, tables and equations may differ. The PDF is the version of record.
1 Introduction
Depression has been one of the leading factors to global burden of disease, with more than 300 million people affected [WHO, 2017]. Preventing depression can conduce to human well-being, of which early detection is an essential task. Powerful depression criteria like ICD-10 [WHO, 1992] have been widely employed in clinical diagnosis. However, people are somehow antipathetic towards consulting psychological doctors, especially at the early stage of depression, leading to the deterioration of condition.
Nowadays, people are increasingly relying on social media like Twitter 1 and Weibo 2 to share their daily activities and thoughts. The user-generated content may further reflect their personal states, hence enabling the analysis of users' mental wellness via harvesting social media. Psychological studies over depressed users online have been conducted in recent years, considering users' social networks, linguistic patterns, attitudes, etc. [Park et al., 2013; Xu and Zhang, 2016]. Research efforts on depression detection were also made. Choudhury et al. [2013] for the first time managed to detect depressive disorders via Twitter, while Shen et al. [2017] further proposed a multimodal depressive dictionary learning model. With such online detection systems, proactive care could be provided for depressed users.
∗Corresponding author: J. Jia (jjia@mail.tsinghua.edu.cn)
The greatest challenge of online depression detection lies in the labeling of depressed users for model training. Traditional methods like questionnaires employed in [Choudhury et al., 2013] are credible, but expensive and inefficient. It is worth mentioning that Shen et al. [2017] constructed a large well-labeled Twitter dataset by self-reported sentence pattern matching (i.e., matching depression-related expressions like "I'm diagnosed with depression" in user-generated content). Sufficient labeled training data enables effective depression detection in Twitter. However, replicating the method to other social media platforms might face challenges due to cultural differences, e.g. distinctive attitudes towards depression and disparate online depression discussion environment [Wang and Liu, 2004; Kleinman, 2004]. Taking for example Twitter and Weibo, the prevalent platform respectively in the West and in China, by using the patterns utilized in [Shen et al., 2017], we found 481 depressed users out of 100 million randomly crawled tweets in Twitter while only 142 matches were obtained when we repeated the trial in Weibo. This leads us to an interesting but challenging problem: can we utilize the multi-source datasets to improve depression detection performance for a specific platform?
1 https://twitter.com/.
2 https://weibo.com/.
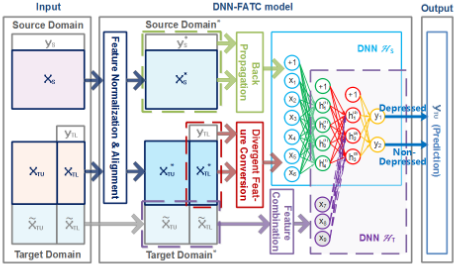
In this work, we systematically study the problem by employing Twitter and Weibo as the source and target domain respectively. Considering cultural diversities, this is nontrivial owing to the following challenges: 1) How to bridge the gap between the heterogeneous feature spaces of different domains? 2) How to design a model that exploits the source domain data to enhance detection for the target domain? We first construct benchmark datasets from Twitter and Weibo. For Weibo, we crawl 400 million tweets from which 580 depressed and 580 non-depressed users are obtained via selfreported sentence pattern matching. For Twitter, we employ the dataset constructed by Shen et al. [2017], with 1,394 depressed and 1,394 non-depressed users. We then conduct indepth investigations over feature patterns across domains and find that in different domains, the same feature may follow distinctive distributions (isomerism), or contribute to detection disparately (divergency). Leveraging the discoveries, we propose a cross-domain Deep Neural Network model with Feature Adaptive Transformation & Combination strategy (DNN-FATC) to effectively transfer the relevant information across heterogeneous domains. We conduct extensive experiments and our model significantly outperforms existing heterogeneous transfer approaches (+3.4% to +4.8% in F1), as well as directly training with the Weibo dataset (+5.2% to +14.3% in F1). Figure 1 presents our framework.
We summarize the main contributions as follows:
- We propose the problem of enhancing online depression detection with multi-source datasets, which is novel to our knowledge. We also construct benchmark datasets to facilitate the research community.
- We reveal two major detection challenges regarding cross-domain feature patterns, defined as isomerism and divergency. This provides the theoretical guidance for cross-domain depression detection models.
- We propose a model named DNN-FATC which achieves remarkable performance in the poorly labeled target domain by utilizing the rich data of source domain. This will hopefully facilitate depression detection via social media for more countries of different cultural settings.
2 RelatedWork
2.1 Online Depression Analysis and Detection
Psychological studies over online depressed users have been conducted in recent years. Park et al. [2012] analyzed language use in describing depressive moods in Twitter. Park et al. [2013] explored Twitter users' depressive attitudes and behaviors via face-to-face interviews. Xu and Zhang [2016] studied online discussion of depression-related issues in terms of social networks and linguistic patterns.
Combined with these researches, depression detection via social media has become possible. [Choudhury et al., 2013]
first explored the potential of employing social media to detect major depressive disorders. Wang's two works [2013a; 2013b] presented a model to calculate the probability of a user being depressed, based on both node and linkage features. Resnik et al. [2015] studied the supervised topic models in analysis of linguistic signals for detecting depression. Shen et al. [2017] proposed a multimodal depressive dictionary learning model that combined multi-modal features. These depression detection efforts demonstrated the feasibility of analysis over massive depressed users in social media.
2.2 Heterogeneous Transfer Learning
Transfer learning aims to create a high-performance learner for the target domain trained from related source domains [Weiss et al., 2016]. Existing transfer methods were proposed mainly to deal with textual or visual tasks by leveraging numerous unimodal low-level features. ARC-t [Kulis et al., 2011] learns an asymmetric transformation to transfer feature knowledge. MMDT [Hoffman et al., 2013] jointly learns affine separating hyperplanes in the source and a transformation from target points into the source. HFA [Li et al., 2014] projects the feature spaces to a common latent space.
However, such methods may be unsuitable for depression detection where correspondences of features across domains are usually quite clear, e.g., follower count in Twitter simply corresponds to follower count in Weibo. Thus, the sophisticated feature mapping methods make little sense. In fact, the difficulty here lies mainly in the very different patterns and the possibly opposite influences on classification of the same feature across domains. Therefore, a new transfer method specific to cross-domain depression detection is in need.
3 ProblemFormulation
Suppose V is a set of users on a certain social media platform, and N denotes the total number of users. Each user vi ∈ V is represented by an M-dimensional feature vector which may involve multiple categories and vary in different platforms. Let X∈ RN×M be the feature matrix. The depression state of user vi is denoted by two-valued variable yi, and y∈RM is the depression states of all users. The dataset of the social media can be denoted by D = {X, y}.
The study involves two datasets DS and DT , corresponding to two different social media platforms. Following the common formulation in transfer learning, DS and DT refer to datasets from the source and target domain, respectively. We intend to detect depressed users in DT based on both datasets. In particular, we only have few labeled samples in DT for model training, in accordance with the common setting in supervised transfer learning problems [Daum´e III, 2007; Chattopadhyay et al., 2012]. That is to say, DT can be represented as DT = DTL∪DTU, where DTL = {XTL, yTL},DTU = {XT U }, XTL ∈ RNTL×MT , XT U ∈ RNTU ×MT , NT = NTL + NTU,NTL≪NTU and NTL≪NS. On the other hand, the two platforms may have partially different features. Since the aim is to detect depression in DT , we leave out the features that are available only in DS. Thus, DS and DT share MS common features while DT has another ME exclusive features.
With notations above, we formally define our problem as: given the source and target domain datasets DS and DT , where DT =DTL∪DTU has limited labels and partially exclusive features, we aim to learn function f : {DS , DTL, DT U }→ yTU to detect the depression states of users in DTU.
| Group | Feature | #S | #T | Description |
|---|---|---|---|---|
| Textual | Emotional Word Count | 2 | 2 | The number of positive and negative emotional words. |
| Emoticon Count | 3 | 3 | The number of positive, neutral and negative emoticons. | |
| Pronoun Count | 2 | 3 | The number of first-person singular / plural pronouns, and other personal pronouns. | |
| Punctuation Count | 3 | The number of 3 typical punctuations('!' , '?' , '...'). | ||
| Topic-Related Word Count | 8 | The number of words related to biology, body, health, death, society, money, work and leisure. | ||
| Text Length | 1 | 1 | The mean length of the tweet texts. | |
| Visual | Saturation&Brightness | 4 | 4 | The mean value of saturation and brightness, and their contrasts. |
| Warm/Clear Color | 2 | 2 | Ratio of colors with hue in [30, 110] and colors with saturation < 0.7. | |
| Five-Color Theme | 15 | 15 | A combination of five dominant colors in HSV color space. | |
| User Profile & Posting Behaviour | User Profile | 2 | Gender and length of screen name. | |
| Tweet Count | 2 | 2 | The number of tweets published in the certain 4 weeks and ever since. | |
| Tweeting Type | 1 | 2 | The proportion of original tweets and tweets with pictures. | |
| Tweeting Time | 24 | 24 | The proportion of tweets posted in each hour of the day. | |
| Social Interaction | Social Engagement | 1 | 3 | The number of retweets, comments and mentions per tweet. |
| Follow & Favorites | 3 | 4 | The number of followers, friends and favorites and proportion of bi-followers. |
| Dataset | DT (+) | DT (-) | DS(+) | DS(-) |
| Users | 580 | 580 | 1,394 | 1,394 |
| Tweets | 45,461 | 30,920 | 290,886 | 1,119,466 |
4 Data and Features
4.1 Data Collection
We take Twitter and Weibo as the source and target domain respectively. Depression typically results from cumulative events or disorder and users may show chronic depressive tendency in a series of tweets rather than one. As is illustrated in ICD-10 [WHO, 1992], It takes at least two weeks to make a definite diagnosis of depression. Therefore, in accordance with clinical experiences, each sample includes a period of four weeks of tweet data, together with the user profile.
Weibo Dataset DT . We construct DT based on 400 million crawled tweets from 2009.10 to 2012.10. Inspired by Shen et al. [2017], users are identified as depressed when self-reported sentence pattern " I'm diagnosed with depression" is matched. A sophisticated Chinese regular expression 3 is designed that both excludes noisy content and takes into account the flexible ways of Chinese expressions. The matched tweets are further manually checked whether containing a genuine depression diagnosis statement. Eventually, 580 depressed users are identified out of the original dataset. Besides, users are labeled as non-depressed if no tweets containing "depress" were published in the sampling period. We randomly select 580 non-depressed users to keep a balance with the depressed samples in terms of scale. Manual check is also made that no depression-related content is involved.
Twitter Dataset DS. A Twitter dataset constructed by Shen et al. [2017] is employed. It contains 2,788 users and the post time of tweets ranges from 2009 to 2016.
The statistics of dataset DT , DS are summarized in Table 2.
3 http://t.cn/R3rrD2b.
4.2 Feature Extraction
We extract 78 features in DT , involving 4 groups, with details illustrated in Table 1. On the other hand, 115 features were studied in DS by Shen et al. [2017], including 60 features shared in both domains. Since the aim is to detect depression in DT , we: 1) disregard the DS-exclusive features; 2) include the 18 DT -exclusive features, which we believe to be useful according to previous researches, as shown in bold in Table 1.
Textual Features (20 dimensions). Textual features are extracted in statistical forms to eliminate linguistic differences. We take the most commonly used linguistic features in sentiment analysis via TextMind [Gao et al., 2013], a Chinese language psychological analysis system, in consistence with the corresponding features in DS extracted by LIWC [Pennebaker et al., 2001]. Emoticons of different sentiment polarities are also studied to evaluate users' emotional states.
Visual Features (21 dimensions). Based on previous work on affective image classification and color psychology theories [Kobayashi, 1981; Wang et al., 2014], we perform image processing and color-related attributes computation.
User Profile & Posting Behavior Features (30 dimensions). We focus on posting behaviors to assess users' activeness. Tweeting time is studied as a reflection of daily schedules. For user profile, inspired by [Piccinelli and Wilkinson, 2000; Li et al., 2015], we extract gender and screen name length of Weibo users. Note the user profile is quite trustable, since real-name authentication is compulsory in Weibo.
Social Interaction Features (7 dimensions). It was found that depressed users were more sensitive in social media, longing more for social awareness and self-consoling [Park et al., 2013]. Therefore, we consider the typical social interaction behaviors, e.g. following, retweeting and mentioning.
4.3 Data Analysis
We further investigate the distributions of features and summarize two major detection challenges regarding crossdomain feature patterns. For each challenge, we present detailed explanations with a specific example.
Isomerism. One feature may follow distinctive integral distributions in different domains. We call this isomerism. The definition is unrelated to specific user groups (i.e., de-
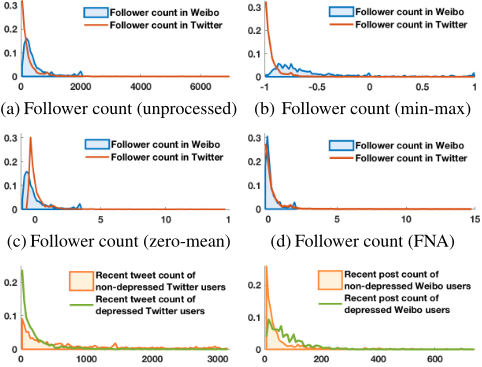
(e)Recent tweet count in Twitter (f)Recent tweet count inWeibo
Figure 2: Feature distributions. (a)-(d) illustrate follower count processed in different ways (as marked in brackets).
pressed / non-depressed users). Taking follower count for instance, the feature distribution varies greatly in the two platforms and a cap of 2,000 is imposed in Weibo, as can be seen from Figure 2(a). Thus, the same number of followers might have different implications across domains. For example, owning 128 followers has reached the middle level in Twitter, while this barely exceeds 14% of users in Weibo, indicating relatively low social engagement. Isomerism is quite common in the dataset and we attempt to reduce such differences by normalization methods like min-max normalization and zero-mean normalization, with results presented in Figure 2(b) and 2(c), where distinctions are still obvious. Consequently, an effective method is required to reduce the isomerism of features across domains.
Divergency. Due to cultural differences, the same feature may have distinctive, or even opposite implications on depression detection in different domains. We call this divergency and such features are referred to as divergent features. Figure 2(e) and 2(f) show the distributions of recent tweet count of different user groups. Surprisingly, the feature seems to contribute oppositely to detection in the two platforms. In Twitter, depressed users post relatively less tweets than the non-depressed, while the contrary is true in Weibo. Besides, divergent features also include positive word count, image saturation, etc and may tremendously impact the validity of transfer methods.
5 Methodology
The isomerism and divergency of features pose great challenges in effectively utilizing the knowledge learned from the source domain data. Therefore, we propose a cross-domain Deep Neural Network model with Feature Adaptive Transformation & Combination strategy (DNN-FATC) to handle these problems. Since DT is sparsely labeled, we construct the model based mainly on DS. The shared features, which are elucidated in Section 5.1 and 5.2, are processed against isomerism and divergency respectively, so that the model trained in the source domain can also perform well in the target domain. The extra features are integrated into the deep framework in the end, as stated in Section 5.3.
5.1 Feature Normalization &Alignment (FNA)
As elaborated in Section 4.3, integral distributions of a feature might differ greatly across domains. Normalization aims to obtain a standard position of objects [Rothe et al., 1996] while the frequently used min-max and zero-mean method do not perform well in our problem. This is because they rely on the mean, minimum or maximum of data, which may be gravely impacted by extreme values.
We perform transformations of feature normalization & alignment to fill the distributional gap of features, or in other words, to reduce the isomerism. Let vector xS∈RNS , xT ∈ RNT denote a same feature in DS and DT , we learn two linear transformations with parameters aS, aT , bS, bT that transform xS, xT into x∗S , x∗T and minimize their Bhattacharyya distance, an effective divergence measure of probability distributions [Kailath, 1967]. Let u∗0 , u∗K be the minimum and the maximum of the joint vector [x∗T S , x∗T T ], and divide the interval [u∗0 , u∗K ] into K isometric intervals. Let p∗Si and p∗Ti be the proportions of elements in x∗S and x∗T that take value in the ith interval , we then have
Eqn. 2 focuses on feature alignment and has infinitely many solutions. We further add two constraints. 1) We assume that the median of x∗T is exactly zero so that the transformed distribution is generally symmetric around the origin, which may be beneficial in the subsequent processing (Section 5.2). 2) For x∗S , we focus on the q1% and q2% (q1 <q2) quantile in terms of scaling. We uniformly map the data between the two quantiles into an interval with a fixed length of l. To understand this, a simple situation is when q1=0, q2=100 and l=2, the transformation is equivalent to min-max normalization. With q1 and q2 changeable, we can get rid of the q1% or q2% extreme data on both sides and robustly fit to features of various distributions. Suppose Q(x, q) denotes the q% quantile of x, we then have
and the four parameters aS,aT ,bS,bT can be determined to get normalized x∗S and x∗T with similar distributions. Figure 2(d) shows the transformed follower count with K = 100, q1 = 25, q2 = 25 and l = 0.5, which is quite desirable.
After performing the above method on all the MS shared features, distinction between the feature spaces of two domains can be reduced to the minimum, enabling us to take full advantage of the abundant labeled samples in DS during model training. Thus, we train a classifier HS based on dataset DS. In this work, a DNN is employed.
5.2 Divergent Feature Conversion (DFC)
We illustrate the existence of divergent features in Section 4.3. With such features, even if they share similar integral distributions in the two domains and classfier HS possesses good differentiation ability, direct application in the target domain will lead to totally wrong results. The key here is to find out the divergent features, and thereby conduct a targeted transformation. Considering the high complexity of HS, the transformation is performed on each target domain feature vector x∗Ti with two conversion factors αi and βi. We have x∗∗ Ti =αix∗Ti +βi, for i=1, 2, . . . ,MS, or in terms of matrix,
To recognize the divergent features, dataset DTL is employed for validation. We analyze the detection results of HS with different values of αi and βi, and preserve the parameter values which optimize the performance. A divergent feature is found when better performance is achieved with αi < 0. In reality, the identification result of one feature may change when other divergent features are converted. That is to say, the optimization problem relies on the combination of all features. Let F(H, D) be the performance indicator of model H over dataset D. Then we formulate the problem as
To solve Eqn. 6, the complexity of enumeration is O( (|αi| · |βi|)MS ) , where |αi|, |βi| denote the number of respective possible values. This is unsolvable in practice. Therefore, we set W as an upper bound for the times of enumeration. In each iteration, we traverse all the features in a random sequence, determine αi and βi for each feature orderly, and record α∗ , β∗ which lead to the best performance in the W trials, as the solution to Eqn. 6. In this way, we reduce the complexity without ignoring the interrelation among features.
After FNA, each pair of feature vectors x∗Ti and x∗Si have similar distributions which are roughly symmetric around the origin (note the median of x∗Ti is exactly 0). For divergent features, we intend to maintain the property to guarantee the validity of HS in DT and at the same time, reverse the mistaken impact on depression detection. As a result, we assume that αi ∈ {-1, 1} and βi = 0 so as to simultaneously realize the two targets. Specifically, when αi =-1 and βi = 0, a centrosymmetric transformation is performed and the impact is inverted in DT . Thus the conversion factor is a binary choice for each feature. We give up the original value of x∗Ti on condition that an improvement of performance indicator over a threshold σ is observed after conversion. σ is proposed to avoid overfitting. With α∗ , β∗ solved, we conduct the conversion for samples in DT by X∗∗ T = αX∗T +βI.
5.3 Feature Combination (FC)
With shared features well dealt with, we now combine the exclusive features in DT into the deep framework. Suppose HS is a d-layer network, with ni neurons in the ith layer, for i=1, 2, . . . , d, where n1 =MS and nd =2. We feed the ME exclusive features into the δth layer (δ < d), and thus build another (d-δ+1)-layer DNN denoted by HT , with (nδ +ME) neurons in the 1st layer, and nj+δ neurons in the (j + 1)th layer, for j = 1, 2, . . . , d - δ. Figure 1 provides a schematic illustration where d=4, δ=2, ME=3, MS=n1=6, n2= 4, n3 =3 and n4 =2. We set up HT with weights initialized to those of HS, except for weights in relation to the newly added ME neurons. In the subsequent processing, the last (d - δ) layers of HS are no longer used while the first δ layers of HS provide the nδ values for the input layer of HT . Based on above settings, we train HT on DTL via back propagation.
Similarly, as for detection of samples in DTU, the feature matrix of which has been transformed into X∗∗ TU (Section 5.2), we input theMS shared features intoHS for the intermediate nδ results, and then obtain the final predicted label with HT .
6 Experiments
6.1 Experimental Setup
We conduct experiments on datasets constructed in Section 4, where DS has 2,788 samples and DT has 1,160. Each dataset has an equal split of depressed and non-depressed users. We take 280 samples (approximately 10% the size of DS) in DT as DTL and the remaining as DTU for testing.
Since the proposed DNN-FATC model has multiple steps, we comprehensively compare all the combinations of different processing approaches in each step. We consider the following feature normalization methods:
- Min-Max Normalization (MN). Mapping all the data into [-1, 1] according to the maximum and the minimum.
- Zero-Mean Normalization (ZN). Linearly transforming data to obey standard normal distribution.
- Feature Normalization & Alignment (FNA). The proposed method in Section 5.1.
As for the utilization of DT and DS, we study:
- Direct Learning (DL). Learning a DNN merely on DT .
- Direct Learning on Shared Features (DLS). Learning a DNN merely on DT with the MS shared features.
- Direct Transfer (DT). Learning a DNN on DS and directly applying it on DT without any further adaptation. DL, DLS and DT are three naive approaches that only consider the information from one domain.
- Back Propagation (BP). After HS is learned on DS, retraining it on DTL by back propagation.
- Divergent Feature Conversion (DFC). The proposed method in Section 5.2.
- Feature Combination (FC). The proposed method in Section 5.3.
We also compare DNN-FATC with the following heterogeneous transfer learning approaches:
- ARC-t [Kulis et al., 2011]. It learns an asymmetric transformation metric between different feature spaces.
- MMDT [Hoffman et al., 2013]. It transforms all target features to a new domain-invariant representation.
- HFA [Li et al., 2014]. It learns a latent common space between the source and target domain.
In experiments, we combine the three normalization approaches with different dataset utilization methods and DNNFATC can be represented as FNA+DFC+FC. For the three transfer approaches, we employ the released codes of their papers. In each trial, DT is randomly split into two unequalsized sets DTL and DTU . The detection performance on DTU of each method is reported after over 10 randomized runs, respectively in terms of precision, recall and F1-measure.
6.2 Experimental Results
Performance. We report the performance of all methods in Table 3 and 4. Only F1-measure is shown here for readability and the full results can be accessed online 4 . DNN-FATC achieves the best performance, with 78.5% in F1-measure.
| DLs | DL | DT | BP | DFC | DFC+FC | |
|---|---|---|---|---|---|---|
| MN | 60.5±7.9 | 64.2±5.2 | 34.3±12.1 | 61.2±6.9 | 66.6±1.6 | 67.4±4.5 |
| ZN | 68.2±4.8 | 70.1±2.2 | 58.6±2.2 | 73.0±2.3 | 72.3±2.2 | 73.9±2.1 |
| FNA | 72.0±3.2 | 73.3±2.7 | 68.0±1.3 | 75.9±1.8 | 77.6±1.1 | 78.5±1.2 |
| FNA+DL | ARC-t | MMDT | HFA | DNN-FATC |
|---|---|---|---|---|
| 73.3±2.7 | 73.7±1.1 | 73.9±1.8 | 75.1±0.8 | 78.5±1.2 |
From Table 3, we have the following observations: 1) In terms of normalization, methods with FNA consistently outperform those using MN and ZN, demonstrating the effectiveness of FNA in reducing isomerism. In fact, FNA even works for direct learning, indicating the universality of normalization approaches with the idea of mapping two quantiles into a fixed-length. 2) DFC notably outperforms BP, indicating that in domain adaptation, divergence is a critical issue and DFC is a remarkable processing method. 3) DL and DFC+FC respectively outperform DLS and DFC, manifesting that the DT - exclusive features extracted in Section 4.2, e.g. topic-related words and user profile, are helpful to detection, and moreover, FC is an effective way to utilize them.
Table 4 shows the performance of transfer approaches, together with FNA+DL, the optimal direct learning method. It can be summarized that DS is useful to enhance depression detection in DT and DNN-FATC best fits the assignment.
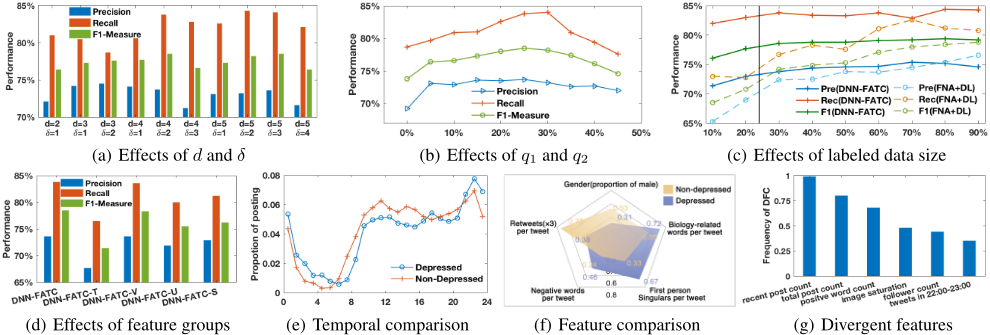
Parameter Analysis. For results reported in Table 3 and 4, we use a sigmoid activation function for DNN-FATC and the hyper-parameters are set as K=100, W =50, q1 = q2 = 25, l = 0.5, σ = 0.01, d = 4, δ = 2 for optimization after careful tuning. Actually, according to our extensive experiments, parameters have just limited impact on performance and four influential parameters are presented here. 1) Structural parameters of DNN d, δ. As illustrated in Figure 3(a), the best performance is obtained when d=4, δ=2 and inserting exclusive features into the intermediate layer is a better choice in feature combination. 2) FNA parameters q1, q2. We assume q1=q2=q for simplicity and Figure 3(b) presents the performance with variation of q. DNN-FATC is optimal when q=0.25, a moderate proportion of extreme data is excluded.
4 http://t.cn/R3rrD2b.
Data scalability Analysis. We train the model with different scales of labeled data in DT . Figure 3(c) illustrates the results, which shows that our model consistently outperforms direct learning. It is clear that DNN-FATC is of high applicability when target domain data has limited labels.
Feature Group Analysis. To understand the effectiveness of different feature groups, we test our model with one feature group unselected each time. Four situations are denoted as DNN-FATC-T, DNN-FATC-V, DNN-FATC-U and DNNFATC-S, respectively. As is shown in Figure 3(d), the performance severely hurts when textual features are removed while visual features contribute to detection slightly.
Case Study: Depressive Behaviors Discovery. Shen et al. [2017] discussed depressive behaviors in Twitter, while we also investigate some distinguishing features in Weibo, which is illustrated in Figure 3(e) and 3(f). We discover that in Weibo: 1) The depressed users are more likely to post tweets between 22:00 and 6:00, indicating that they are susceptible to insomnia. 2) Female users are more likely to suffer from depression. 3) Depressed users tend to use more biologyrelated words and first person singulars, manifesting more concern about health issues and personal affairs. 4) Depressed users are retweeted less, which may reflect their lack in social engagement and attention from others.
On the other hand, we also look into the divergent features which have dissimilar indication on detection across domains. We count for each feature the frequency of being converted in DFC and show the top-6 divergent features in Figure 3(g). Besides tweets count, positive word count also contributes disparately to depression detection in Twitter and Weibo.
7 Conclusion
In this paper, we raised the problem of enhancing depression detection via social media with multi-source datasets. We proposed a cross-domain Deep Neural Network model with Feature Adaptive Transformation & Combination strategy (DNN-FATC) to transfer the relevant information across heterogeneous domains. Experimental results verified the effectiveness of our method. In the future, we expect to further improve online detection by combining offline researches, and contribute to the well-being of more people.
Acknowledgments
This work is supported by National Key Research and Development Plan (2016YFB1001200), the Innovation Method Fund of China (2016IM010200), Tiangong Institute for Intelligent Computing, Tsinghua University, the National Natural Science Foundation of China (61772302) and the Royal Society-Newton Advanced Fellowship Award. This research is also part of the NExT research, supported by the National Research Foundation, Prime Minister's Office, Singapore under its IRC@SG Funding Initiative.
@inproceedings{ijcai2018p223,
  title     = {Cross-Domain Depression Detection via Harvesting Social Media},
  author    = {Shen, Tiancheng and Jia, Jia and Shen, Guangyao and Feng, Fuli and He, Xiangnan and Luan, Huanbo and Tang, Jie and Tiropanis, Thanassis and Chua, Tat-Seng and Hall, Wendy},
  booktitle = {Proceedings of the Twenty-Seventh International Joint Conference on
               Artificial Intelligence, {IJCAI-18}},
  publisher = {International Joint Conferences on Artificial Intelligence Organization},
  editor    = {Jérôme Lang},
  pages     = {1611--1617},
  year      = {2018},
  month     = {7},
  note      = {Main track},
  doi       = {10.24963/ijcai.2018/223},
  url       = {https://doi.org/10.24963/ijcai.2018/223},
}
TY - CPAPER TI - Cross-Domain Depression Detection via Harvesting Social Media AU - Shen, Tiancheng AU - Jia, Jia AU - Shen, Guangyao AU - Feng, Fuli AU - He, Xiangnan AU - Luan, Huanbo AU - Tang, Jie AU - Tiropanis, Thanassis AU - Chua, Tat-Seng AU - Hall, Wendy T2 - Proceedings of the Twenty-Seventh International Joint Conference on Artificial Intelligence, IJCAI-18 PB - International Joint Conferences on Artificial Intelligence Organization PY - 2018 SP - 1611 EP - 1617 DO - 10.24963/ijcai.2018/223 UR - https://doi.org/10.24963/ijcai.2018/223 ER -Copied
Machine-readable versions of this paper, for tools and AI agents:





