
HCR-Net: A Hybrid of Classification and Regression Network for Object Pose Estimation
Proceedings of the Twenty-Seventh International Joint Conference on Artificial Intelligence. Main track. Pages 1014-1020.
https://doi.org/10.24963/ijcai.2018/141
Keywords
- Computer Vision: 2D and 3D Computer Vision
- Computer Vision: Computer Vision
- Computer Vision: Perception
Abstract
Object pose estimation from a single image is a fundamental and challenging problem in computer vision and robotics. Generally, current methods treat pose estimation as a classification or a regression problem. However, regression based methods usually suffer from the issue of imbalanced training data, while classification methods are difficult to discriminate nearby poses. In this paper, a hybrid CNN model, which we call it HCR-Net that integrates both a classification network and a regression network, is proposed to deal with these issues. Our model is inspired by that regression methods can get better accuracy on homogeneously distributed datasets while classification methods are more effective for coarse quantization of the poses even if the dataset is not well balanced. The classification methods and the regression methods essentially complement each other. Thus we integrate both them into a neural network in a hybrid fashion and train it end-to-end with two novel loss functions. As a result, our method surpass the state-of-the-art methods, even with imbalanced training data and much less data augmentation. The experimental results on the challenging Pascal3D+ database demonstrate that our method outperforms the state-of-the-arts significantly, achieving improvements on ACC and AVP metrics up to 4% and 6%, respectively.
- [Aubry et al., 2014] Mathieu Aubry, Daniel Maturana, Alexei Efros, Bryan Russell, and Josef Sivic. Seeing 3d chairs: exemplar part-based 2d-3d alignment using a large dataset of cad models. In CVPR, 2014.
- [Chen et al., 2013] K. Chen, S. Gong, T. Xiang, and C. C. Loy. Cumulative attribute space for age and crowd density estimation. In 2013 IEEE Conference on Computer Vision and Pattern Recognition, pages 2467-2474, June 2013.
- [Cheng et al., 2016] Yanhua Cheng, Xin Zhao, Rui Cai, Zhiwei Li, Kaiqi Huang, and Yong Rui. Semi-supervised multimodal deep learning for rgb-d object recognition. In International Joint Conference on Artificial Intelligence, pages 3345-3351, 2016. IJCAI
- [Deng et al., 2009] J. Deng, W. Dong, R. Socher, L. J. Li, Kai Li, and Li Fei-Fei. Imagenet: A large-scale hierarchical image database. In 2009 IEEE Conference on Computer Vision and Pattern Recognition, pages 248-255, June 2009.
- [Elhoseiny et al., 2016] Mohamed Elhoseiny, Tarek Elgaaly, Amr Bakry, and Ahmed M Elgammal. A comparative analysis and study of multiview cnn models for joint object categorization and pose estimation. pages 888-897, 2016.
- Everingham et al., ] M. Everingham, L. Van Gool, C. K. I. Williams, J. Winn, and A. Zisserman. The PASCAL Visual Object Classes Challenge 2012 (VOC2012) Results. http://www.pascal- network.org/challenges/VOC/voc2012/workshop/index.html. Link
- [Fenzi et al., 2013] M. Fenzi, L. Leal-Taixe, B. Rosenhahn, and J. Ostermann. Class generative models based on feature regression for pose estimation of object categories. In 2013 IEEE Conference on Computer Vision and Pattern Recognition, pages 755-762, June 2013.
- [Girshick et al., 2014] R. Girshick, J. Donahue, T. Darrell, and J. Malik. Rich feature hierarchies for accurate object detection and semantic segmentation. In 2014 IEEE Conference on Computer Vision and Pattern Recognition, pages 580-587, June 2014.
- [Jia et al., 2014] Yangqing Jia, Evan Shelhamer, Jeff Donahue, Sergey Karayev, Jonathan Long, Ross Girshick, Sergio Guadarrama, and Trevor Darrell. Caffe: Convolutional architecture for fast feature embedding. arXiv preprint arXiv:1408.5093, 2014.
- [Krizhevsky et al., 2012] Alex Krizhevsky, Ilya Sutskever, and Geoffrey E Hinton. Imagenet classification with deep convolutional neural networks. In F. Pereira, C. J. C. Burges, L. Bottou, and K. Q. Weinberger, editors, Advances in Neural Information Processing Systems 25, pages 1097-1105.
- Curran Associates, Inc., 2012.
- [Lim et al., 2013] J. J. Lim, H. Pirsiavash, and A. Torralba. Parsing ikea objects: Fine pose estimation. In 2013 IEEE International Conference on Computer Vision, pages 2992-2999, Dec 2013.
- [Lin et al., 2017] Tsung-Yi Lin, Piotr Dollár, Ross Girshick, Kaiming He, Bharath Hariharan, and Serge Belongie. Feature pyramid networks for object detection. In CVPR, 2017.
- [Mahendran et al., 2017] Siddharth Mahendran, Haider Ali, and Rene Vidal. 3d pose regression using convolutional neural networks. In The IEEE Conference on Computer Vision and Pattern Recognition (CVPR) Workshops, July 2017.
- [Massa et al., 2014] Francisco Massa, Mathieu Aubry, and Renaud Marlet. Convolutional neural networks for joint object detection and pose estimation: A comparative study. Computer Science, 19(2a):412-417, 2014.
- [Massa et al., 2016] Francisco Massa, Renaud Marlet, and Mathieu Aubry. Crafting a multi-task CNN for viewpoint estimation. In Proceedings of the British Machine Vision Conference 2016, BMVC 2016, York, UK, September 19- 22, 2016, 2016.
- [Pavlakos et al., 2017] Georgios Pavlakos, Xiaowei Zhou, Aaron Chan, Konstantinos G Derpanis, and Kostas Daniilidis. 6-dof object pose from semantic keypoints. In International Conference on Robotics and Automation (ICRA), 2017.
- [Redondo-Cabrera et al., 2016] Carolina Redondo-Cabrera, Roberto J. López-Sastre, Yu Xiang, Tinne Tuytelaars, and Silvio Savarese. Pose estimation errors, the ultimate diagnosis. In Bastian Leibe, Jiri Matas, Nicu Sebe, and Max Welling, editors, Computer Vision -ECCV 2016, pages 118-134, Cham, 2016. Springer International Publishing.
- [Simonyan and Zisserman, 2014] K. Simonyan and A. Zisserman. Very deep convolutional networks for large-scale image recognition. CoRR, abs/1409.1556, 2014.
- [Su et al., 2015] H. Su, C. R. Qi, Y. Li, and L. J. Guibas. Render for cnn: Viewpoint estimation in images using cnns trained with rendered 3d model views. In 2015 IEEE International Conference on Computer Vision (ICCV), pages 2686-2694, Dec 2015.
- [Tulsiani and Malik, 2015] S. Tulsiani and J. Malik. Viewpoints and keypoints. In 2015 IEEE Conference on Computer Vision and Pattern Recognition (CVPR), pages 1510-1519, June 2015.
- [Wu et al., 2016] Jiajun Wu, Tianfan Xue, Joseph J. Lim, Yuandong Tian, Joshua B. Tenenbaum, Antonio Torralba, and William T. Freeman. Single image 3d interpreter network. In Bastian Leibe, Jiri Matas, Nicu Sebe, and Max Welling, editors, Computer Vision -ECCV 2016, pages 365-382, Cham, 2016. Springer International Publishing.
- [Xiang et al., 2014] Yu Xiang, Roozbeh Mottaghi, and Silvio Savarese. Beyond pascal: A benchmark for 3d object detection in the wild. In IEEE Winter Conference on Applications of Computer Vision (WACV), 2014.
- [Xiang et al., 2017] Yu Xiang, Tanner Schmidt, Venkatraman Narayanan, and Dieter Fox. Posecnn: A convolutional neural network for 6d object pose estimation in cluttered scenes. arXiv preprint arXiv:1711.00199, 2017.
References were extracted automatically from the PDF and may contain errors.
Full text extracted automatically from the PDF; figures, tables and equations may differ. The PDF is the version of record.
1 Introduction
In this paper, we address the problem of accurate 3D pose estimation from a single image. Single image based 3D pose estimation is fundamental and important to a variety of computer vision and robotics applications ranging from classic tasks including human-computer interaction, image based modeling, to modern applications like autonomous driving, autonomous navigation, and augmented reality. The core task of 3D pose estimation from a single image is to compute the transformation between an object and the camera. Due to the limited visual constraints from only one image, estimating the transformation is very challenging comparing with the multi-view geometry reconstruction.
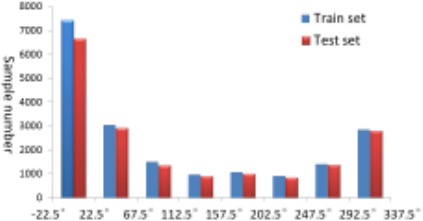
With the success of deep leaning [Cheng et al., 2016], although remarkable progress has been made in 3D pose estimation, current state-of-the-art methods are still difficult to deal with real-world images with sufficient robustness and accuracy, especially given an imbalanced training dataset. Recent CNN based pose estimation methods formulate this problem by either multi-class classification [Su et al., 2015; Tulsiani and Malik, 2015] or regression [Mahendran et al., 2017; Fenzi et al., 2013]. Multi-class classification methods assume that the pose angles can be discreted and poses are independent from each other. However, such discrete method does not consider the natural continuous structure of the pose space, and nearby poses indeed are strongly correlated and usually have closer similarities than those further apart [Massa et al., 2014]. Irrespective of this correlation constraint, multi-class classification methods will have difficulty to discriminate similar poses when object appearance varies little. Regression methods seek to learn a mapping function from feature vectors to output scalar output values. However, this kind of methods tend to offer smooth predictions concentrated around the most frequent poses of the training data. Thus regression methods suffer from the issue of sparse and imbalanced training data distribution [Chen et al., 2013]. In fact, almost all accredited datasets we used are not well balanced. As shown in Fig. 1, the poses of 12 object categories on the popular PASCAL3D+ dataset are very imbalanced. However, manually balancing the large datasets is obviously labor-intensive [Redondo-Cabrera et al., 2016]. With imbalanced training data, it is very challenging to accurately estimate the 3D poses from a single image.
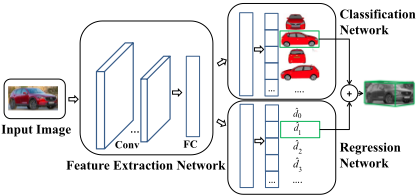
To tackle these issues mentioned above, a novel hybrid CNN model, which we call it HCR-Net that integrates both a classification network and a regression network is proposed, as shown in Fig. 2. We observe that regression methods can get better accuracy on homogeneously distributed datasets while classification methods are more effective for coarse quantization of the poses even if the dataset is not well balanced. We thus first coarsely discretize the pose angles into several principal orientations equally and solve this subproblem as a classification task. The principal orientation provides a coarse level estimation of the pose, and the pose distribution within the interval of each principal orientation are better balanced than that of the global dataset. To obtain the true pose value, we then use regression to estimate the accurate difference angle between the coarse pose (principal orientation) and the true pose, which is our second subproblem. The classification network provides a well balanced sub-datasets for regression network while the regression network contributes to discriminating nearby poses by estimating a difference angle from the principle orientation based on the classification sub-network. The classification methods and the regression methods essentially complement each other. By integrating these two sub-network into our network in a hybrid fashion, our method can effectively alleviate the impact of data imbalance and improve the accuracy of nearby 3D pose estimation. Moreover, to compensate the classification error results from the hard boundaries between principal orientations, a weighted cross entropy loss and a smooth Euclidean loss are proposed.
In summary, our contributions are as follows:
- A HCR-Net that integrates both a classification network and a regression network is proposed. Our method can effectively alleviate the influence from data imbalance. To the best of our knowledge, this is the first time this idea is used in this task.
- Two effective loss functions corresponding to the two
sub-problems are proposed.
- Our approach is simple and effective. With much smaller training samples and without any other extra information, we obtain significantly superior performance on the challenging PASCAL3D+ dataset, and outperforms the state-of-the-art methods on ACCπ6 and AV P metrics up to 4% and 6%, respectively.
2 RelatedWork
Existing methods for object pose estimation can be roughly separated into two classes: instance level and category level. The former one targets estimating pose for a few specific objects [Xiang et al., 2017; Lim et al., 2013], while the later one targets estimating for an entire category. It is very challenging for the later as it is necessary to handle the large intra-class variation in the categories. For this reason, some work focuses on classes with simple 3D geometry such as chairs [Aubry et al., 2014]. To estimate object pose, some researchers first predict 2D keypoints from an image and then use 3D object model to predict 3D pose given these keypoints [Wu et al., 2016; Pavlakos et al., 2017], while some work directly predict pose from images, which are closer to what we do. Most existing methods in the later case fall into two categories: classification and regression. Although most methods adopt the classification model, whether classification or regression is more suitable is still an open question. [Massa et al., 2016] highlighted the superiority of classification approaches over regression approaches. [Elhoseiny et al., 2016] investigated and analyzed the influence of layers of various CNN models on the pose estimation problem. However, few work paid attention to the issue of imbalanced data distribution, except [Redondo-Cabrera et al., 2016] pointed out that all models showed a strong preference for the frontal views.
In this work, we focus on the category level object pose estimation. Given a RGB image, our goal is to estimate its pose in terms of azimuth angle θ, elevation angle φ and in-plane rotation angle ψ. Combining the advantages of classification and regression methods, we propose a hybrid CNN model to estimate object pose. With our HCR-Net, the issue of imbalanced data is well alleviated.
3 HCR-Net for Object Pose Estimation
In this section, we describe details of our problem decomposition method in Sec 3.1, and how we design the network architecture and loss functions in Sec 3.2.
3.1 ProblemDecomposition
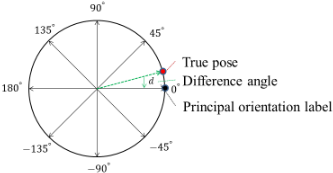
The key idea of our method is to decouple the pose estimation problem into two sub-problems: principal orientation classification and difference angle regression. Principal orientations are obtained by discretizing the [-180, 180) angle into N principal orientations equally. Therefore, the angle difference between two adjacent principal orientations is G = 360 N degrees. Each training sample is assigned to one of the N labels based on its orientation's proximity to the principal orientations. However, this task can only provide a coarse pose value. To obtain the true object pose, we further need to estimate the difference angle value between the coarse pose and the true pose, and we solve this sub-problem by regression. Then, the pose estimation task is converted to a hybrid of principal orientations classification and difference angle regression task.
Fig. 3 depicts a discretization example with N = 8. The 8 black solid lines represent 8 principal orientations. The red and black dot denote the true pose and its principal orientation label respectively, and d denotes the difference angle value. The main advantage of principal orientation discretization is to alleviate the issue of imbalanced training data. However, it is a tradeoff to set the value of N, neither too large nor too small. If N is too large, some principal orientation bins may do not have enough training samples, on the other hand, the imbalanced issue will not be well alleviated if N is too small.
3.2 HCR-Net
3.2.1 Network Architecture
As illustrated in Fig. 2, our network consists of a feature extraction network, a classification network and a regression network. The feature extraction network is shared by classification and regression networks, which are parallel with each other. Rather than solving the regression task after the classification task, we take a parallel structure for the two tasks. The reason is that the two tasks require features with two complementary properties. For images with similar poses from the same object category, the classification task tries to obtain similar features for them, while the regression task tries to learn the difference between them. Hence, the learning of the two tasks is opposite in a certain extent. Consider the difference of the two tasks, it is necessary to separate the network into two branches for better performance. In fact, the process of principal orientation discretization divides one object category into N sub-categories. In this sense, the problem of pose estimation of C classes with range of [-180, 180) is converted into a problem of pose estimation of C × N sub-categories with range of [- 360 2N , 360 2N ). Therefore, it is also reasonable to tackle the two tasks in parallel structure.
Fig. 2 shows an overview of our method with 4 principal orientations. Without loss of generality, the output length can be adjusted according to the principal orientation number. The classification network outputs a vector ˆO of length C ×N, and ˆOi represents the probability of the input image to be the i-th sub-category. For the regression network, the most intuitive idea is that it outputs the difference angle for every sub-category. However, because of the extremely imbalanced sample distribution, there may be very few training samples available in some sub-categories. Therefore, we seek to the second choice, different principal orientations of the same category are grouped into a new category and regress the difference angle of the C new categories with regression range [- 360 2N , 360 2N ), or samples of the same principal orientation of all categories are grouped into a new category and regress the difference angle of the N principal orientations. In the first case, samples of different subcategories in the same category are trained together. In the second case, samples in the same principal orientations of all categories are trained together. The regression output ˆ d has length of C and N in the two cases, respectively. Our network can be easily combined with any backbone architecture, such as AlexNet [Krizhevsky et al., 2012], VGG [Simonyan and Zisserman, 2014], FPN [Lin et al., 2017] and so on.
3.2.2 Loss Function
We use a multi-task loss L to jointly train the classification and regression networks as follows:
which consists of a classification error Lcls and a regression error Lreg, O and d denote the ground truth principal orientation label and difference angle, respectively. The hyper-parameter λ controls the balance between the two tasks. In order to better solve the two tasks, we propose two new loss functions, named as smooth Euclidean loss and weighted cross entropy loss.
Smooth Euclidean Loss Function For the regression task, the simplest way to train the pose regressor is by using an Euclidean loss as follows:
where x and y are two input vectors and L is the vector length. However, there are two issues when using the standard Euclidean loss for training our network. The first issue is that there may be exploding gradients because of the large range of regression target and sample outliers. The second issue is that the standard Euclidean loss computes loss of the output vector on all classes for each training sample, despite the fact that each sample only has one ground-truth class label, which results in useless competition between classes when training. To prevent the two issues, we use a more efficient loss modified from Euclidean loss as follows:
where L is the length of the input vector, w is the weights vector, wi is set to be 1 if i equals to the ground-truth class label c and 0 otherwise. f(x) is the Huber loss function, and th is a threshold to smooth loss gradient so that it is less sensitive to outliers and exploding gradients. In this way, the loss is only computed for the ground-truth class c and only the related network layer weights update during training. We show by experiments that this formulation is more effective for our network training.
Weighted Cross Entropy Loss Function The standard categorical cross-entropy loss is commonly used for classification task, and Lcls(k, ˆ p) = -logpk is the log loss for true class k. However, as pose space is continuous, there will be errors in the principal orientation classification network which results from the hard boundary between adjacent principal orientations. Suppose the principal orientation label of a sample is k and its second nearest principal orientation label is m, it is very easy to classify the sample into m-th principal orientation bin. In order to compensate this kind of error, we propose a weighted cross entropy loss function as follows:
where w is a weight variable, and is computed as w = N · d/360 which denotes the angle distance between the actual angle value to the second nearest principal orientation. In addition, to cooperate this loss function, we consider the pose overlaps in the regression network. The difference angle of the nearest and second nearest principal bins are both regressed. Then, a sample that is misclassified in a wrong principal orientation bin can still have its pose well estimated.
4 Experiments
In this section, we first introduce the dataset and evaluation metric we use. In 4.2, we introduce implementation details of our framework. Then, in 4.3, we analyse performance of different parameter choices. Finally, in 4.4 we compare our results with the state-of-the-art methods on object pose estimation under various metrics.
4.1 Dataset and EvaluationMetric
We use the challenging Pascal3D+ dataset (release version 1.1) [Xiang et al., 2014] for our experiments. Pascal3D+ consists of 12 common rigid object categories with continuous pose annotations, including aeroplane (aero), bicycle (bike), boat, bottle, bus, car, chair, diningtable (dtable), motorbike (mbike), sofa, train, and tvmonitor (tv). The dataset selects images containing interested objects from PASCAL VOC 2012 dataset [Everingham et al., ] and ImageNet [Deng et al., 2009]. As in other works, we crop the image patches inside ground-truth bounding box annotations of the training data. We use the ImageNet-training+validation images and Pascal-training images as our training data, and un-occluded and un-truncated Pascal-validation images are used as testing data as with others. We only flip the training images to augment our training data.
For comparison, we test our method in the same way as compared work. We separately test our method on ground-truth bounding boxes and the joint detection and pose estimation task which obtains bounding boxes from RCNN with bounding box regression [Girshick et al., 2014]. To evaluate the performance on the ground-truth bounding boxes, we use metrics proposed in [Tulsiani and Malik, 2015], which are based on geodesic distance (∆(R1,R2) = ∥∥log(RT 1 R2)∥∥F /√2) over the manifold of rotation matrices. ∆(Rgt,Rpred) captures the difference between ground truth pose Rgt and predicted pose Rpred (azimuth, elevation and in-plane rotation). The median error (MedErr) and accuracy within a fixed threshold (Accπ6 ) are used. To evaluate the performance on joint detection and pose estimation task, we use AVP (Average Viewpoint Prediction) advocated by
[Xiang et al., 2014]. This metric requires both 2D detection and pose estimation to be correct.
4.2 Implementation Details
We implement our method using the VGG16 [Simonyan and Zisserman, 2014] network pre-trained on ImageNet image classification task to initialize our network. For fair comparison, the pre-trained AlexNet [Krizhevsky et al., 2012] network is used to finetune our network when compared with [Su et al., 2015]. The classification and regression network are both separated from fc6 layers. As azimuth angle is the bottleneck of the pose estimation problem currently, only the azimuth angle is discretized into principal orientations and we prefer regression method to estimate elevation and in-plane rotation angle. The two tasks are also separated from fc6 layers.
We train our network in multiple steps. After network initialization, we first train the principal orientations classification network, lower shared feature extraction layers and fix other three branch layers. Then, we fix the lower shared feature extraction layers, classification network layers and train the three angle regression layers. The two steps continue training for 10k iterations. Finally, we jointly train the four tasks for 60k iterations. The batchsize is set to be 64, with a learning rate of 0.001 which is decreased by 10 at every 6k, 6k, 30k iterations for the three steps, respectively. We use a weight decay of 0.0005 and a momentum of 0.9, and implement our network on Caffe [Jia et al., 2014] framework.
4.3 Ablative Analysis
In this section we show results of different parameter choices for our method, as shown in Table 1. For paper constraint, we only show the mean value of the 12 object categories on the accuracy and median angle error metrics.
Effect of Number of Principal Orientations. The number of principal orientations is an important factor, we compare the performance of different N from 4 to 12 with step size of 2. As can be seen from columns 1-4 and 9 of Table 1, N equals to 8 is an appropriate choice, which has 3% - 4% improvement compared with other choices on the mean accuracy metric.
Effect of Smooth Euclidean Loss. Columns 5-9 of Table 1 compare results of different loss settings in the regression network. We can see that the proposed smooth Euclidean loss outperforms the traditional Euclidean loss by 3% on mean accuracy metric when th is equal to 5. The choice of the threshold value th is also very important. The results confirm our statement in 3.2 that there will be gradient explosion if th is too large and it will be too weak if th is too small. We set th = 5 in the following experiments.
Effect of Weighted Cross Entropy Loss. Before evaluating the effect of weighted cross entropy loss, we first compare the performance of different regression mode of the difference angle. Columns of 9-10 of Table 1 show results of regressing the difference angle of every category and every principal orientation, respectively. We can see that they have similar performance on accuracy metric but the later one has better results on the median angle error metric. The reason may be that the training data are more balanced if the principal orientation of all categories are grouped together. When weighted cross entropy loss is used (column 11), the mean accuracy is increased by 2% while the mean median angle error remains unchanged. For further experiments, we regress the difference angle of every principal orientation.
| # | 1 | 2 | 3 | 4 | 5 | 6 | 7 | 8 | 9 | 10 | 11 | 12 | 13 |
|---|---|---|---|---|---|---|---|---|---|---|---|---|---|
| Metric | 4+5 | 6+5 | 10+5 | 12+5 | 8+EL | 8+1 | 8+10 | 8+15 | 8+5 | 8+5+P | 8+5+P+WCE | REG | CLS |
| mAcc π6 | 0.82 | 0.81 | 0.82 | 0.81 | 0.82 | 0.84 | 0.83 | 0.82 | 0.85 | 0.84 | 0.86 | 0.75 | 0.77 |
| mMedErr | 10.9 | 12.1 | 12.9 | 12.0 | 12.9 | 12.5 | 12.4 | 12.8 | 9.7 | 8.9 | 8.9 | 14.3 | 12.9 |
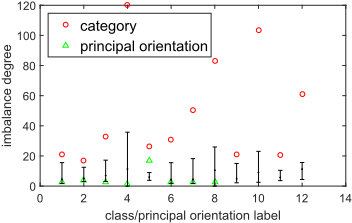
Figure 4: Imbalance degree of the training data.
Analysis of Classification and Regression. To confirm the validity of our framework, we also implement regression and classification methods that have the same network architecture with ours, except that they separate three branches for azimuth, elevation and in-plane angle estimation respectively. Results are shown in columns of 12-13 in Table 1. We train the regression method with smooth Euclidean loss (th = 5) for better results. We can observe that our method increases the mean accuracy by 11% and 9% and decrease the mean median angle error by 5.3 and 3.9, respectively, compared to regression and classification methods. This confirms the significant superiority of our approach.
To further demonstrate the advantage of our approach on alleviating the issue of imbalanced training data, the imbalance degree is shown in Fig. 4, which is defined as: (ma - mi)/me, ma, mi and me denote the maximum, minimum and mean number of samples of the training data respectively. The red hollow circle denotes the imbalance degree of the 12 categories when classification method with 360 bins is used. The black line shows the maximum and minimum imbalance degree on 8 principal orientations of 12 categories, and the black dots indicate the mean value of the 8 principal orientation bins of each category. The 8 green triangles denote the imbalance degree of 8 principal orientation bins which are grouped all categories together. It can be seen that after principal orientation discretization, the imbalance degree dramatically decreases. And if the data of the same principal orientation of all categories are grouped together, the imbalance degree decreases further.
4.4 Comparison with state-of-the-art Methods
To evaluate the performance of our method, we compare with two state-of-the-art methods based on classification, which denoted as 'Render' [Su et al., 2015] and 'V&K' [Tulsiani and Malik, 2015], respectively. We also compare with the newly proposed regression based method named as 'Reg M' [Mahendran et al., 2017]. The differences of these methods are presented in Table 2. It should be noted that we use much smaller training samples than the three compared methods. We just use image flipping to augment training data and finally obtain 59790 training samples, while Render method use two million rendered images, V&K method augment training data by 2D jittering and Reg M augment training data by 3D jittering and rendered images of Render. For fair comparison, we implement our method using Alexnet ('Our A') when compared with Render and using VGG network ('Our V') when compared with V&K and Reg M.
Pose Estimation with Ground Truth box. We first analyze the performance of our method using ground-truth bounding box image as input, and it is independent of factors like mis-localization. The performance of our method and comparisons are shown in Table 3. We can observe that our method obtains significantly better results than the compared methods with the same network structure, and compared with Render and V&K our method has 4% - 5% improvement on accuracy metric and decreases the median angle error metrics by 2.4 and 4.7, respectively. To visualize results of our method, Fig. 5 shows examples of 3D model projected using estimated poses of our method.
Joint Detection and Pose Estimation. Following the compared methods, we test our method on joint detection and pose estimation task. For fair comparison, we use the same detection results and network structures with the compared methods. Table 4 shows comparison results with Render, V&K and Reg M. The results clearly demonstrate that our method performs significantly better than Render and Reg M methods, and obtains about 6% improvement compared with Render. For V&K, we obtain comparable results, in the finer view level we get slightly worse results, and in the coarser view level we have better performance.
5 Conclusion
In this paper, we propose a HCR-Net that integrates both a classification network and a regression network. Our method can effectively alleviate influence from the data imbalance issue and improve pose estimation accuracy. With much less augmented training samples and without any other extra information, our method obtains significantly superior performance on the challenging PASCAL3D+ dataset compared with the state-of-the-art methods. In the future, we will investigate how to adaptively learn the principal orientations to obtain an optimal combination of classification and regression. We wish our work could inspire more in-depth research efforts towards solving the challenging pose estimation problem.

| V&K | Render | Reg M | Our | |
|---|---|---|---|---|
| Problem formulation | CLS | Fine-grained CLS | REG | CLS + REG |
| Representation | DA | DA | Axis-angle / Quaternion | DA + Euler angle |
| Loss function | CE | Weighted CE | Geodesic loss | CE + smooth EL |
| Data augmentation | 2DJ | Rendered images | 3DJ + rendered images | Image flipping |
| Number of training set | - | 2 million ren | 2 million ren + 2.8 million aug | 59570 |
| Network architecture | VGG-Net | AlexNet | VGG-M | AlexNet/VGG-Net |
| Method | aero | bike | boat | bottle | bus | car | chair | table | mbike | sofa | train | tv | mean |
|---|---|---|---|---|---|---|---|---|---|---|---|---|---|
| Accπ6 (Render) | 0.74 | 0.83 | 0.52 | 0.91 | 0.91 | 0.88 | 0.86 | 0.73 | 0.78 | 0.90 | 0.86 | 0.92 | 0.82 |
| Accπ6 (Our A) | 0.84 | 0.86 | 0.64 | 0.94 | 0.95 | 0.89 | 0.77 | 0.86 | 0.94 | 0.87 | 0.86 | 0.92 | 0.86 |
| Accπ6 (V&K) | 0.81 | 0.77 | 0.59 | 0.93 | 0.98 | 0.89 | 0.80 | 0.62 | 0.88 | 0.82 | 0.80 | 0.80 | 0.81 |
| Accπ6 (Our V) | 0.81 | 0.89 | 0.67 | 0.95 | 0.97 | 0.89 | 0.79 | 0.76 | 0.93 | 0.87 | 0.83 | 0.91 | 0.86 |
| MedErr (Render) | 15.4 | 14.8 | 25.6 | 9.3 | 3.6 | 6.0 | 9.7 | 10.8 | 16.7 | 9.5 | 6.1 | 12.6 | 11.7 |
| MedErr (Our A) | 9.9 | 12.1 | 19.3 | 6.3 | 2.7 | 4.3 | 12.4 | 10.5 | 11.7 | 8.1 | 4.3 | 10.2 | 9.3 |
| MedErr (V&K) | 13.8 | 17.7 | 21.3 | 12.9 | 5.8 | 9.1 | 14.8 | 15.2 | 14.7 | 13.7 | 8.7 | 15.4 | 13.6 |
| MedErr (Reg M) | 16.00 | 21.29 | 39.26 | 9.85 | 3.98 | 7.82 | 22.19 | 22.90 | 18.87 | 12.18 | 7.27 | 16.76 | 16.53 |
| MedErr (Our V) | 9.2 | 12.0 | 16.5 | 6.2 | 2.4 | 4.5 | 12.2 | 8.1 | 11.2 | 8.2 | 4.67 | 11.2 | 8.9 |
| # | Method | aero | bike | boat | bottle | bus | car | chair | table | mbike | sofa | train | tv | mean |
|---|---|---|---|---|---|---|---|---|---|---|---|---|---|---|
| 1 | Render-4V | 54.0 | 50.5 | 15.1 | - | 57.1 | 418 | 15.7 | 18.6 | 50.8 | 28.4 | 46.1 | 58.2 | 39.7 |
| 2 | Render-8V | 44.5 | 41.1 | 10.1 | - | 48.0 | 36.6 | 13.7 | 15.1 | 39.9 | 26.8 | 39.1 | 46.5 | 32.9 |
| 3 | Render-16V | 27.5 | 25.8 | 6.5 | - | 45.8 | 29.7 | 8.5 | 12.0 | 31.4 | 17.7 | 29.7 | 31.4 | 24.2 |
| 4 | Render-24V | 21.5 | 22.0 | 4.1 | - | 38.6 | 25.5 | 7.4 | 11.0 | 24.4 | 15.0 | 28.0 | 19.8 | 19.8 |
| 5 | Our A-4V | 65.1 | 58.2 | 19.7 | - | 62.2 | 47.7 | 17.5 | 23.3 | 62.9 | 32.8 | 50.9 | 59.6 | 45.5 |
| 6 | Our A-8V | 56.4 | 50.8 | 15.9 | - | 51.4 | 47.1 | 14.6 | 18.2 | 53.0 | 30.4 | 47.1 | 48.7 | 39.4 |
| 7 | Our A-16V | 40.7 | 33.5 | 9.8 | - | 54.4 | 37.3 | 9.5 | 15.43 | 41.2 | 25.0 | 33.2 | 31.5 | 30.1 |
| 8 | Our A-24V | 32.6 | 26.2 | 6.9 | - | 44.7 | 34.3 | 7.8 | 10.87 | 34.1 | 20.2 | 35.9 | 22.7 | 25.1 |
| 9 | V&K-4V | 63.1 | 59.4 | 23 | - | 69.8 | 55.2 | 25.1 | 24.3 | 61.1 | 43.8 | 59.4 | 55.4 | 49.1 |
| 10 | V&K-8V | 57.5 | 54.8 | 18.9 | - | 59.4 | 51.5 | 24.7 | 20.4 | 59.5 | 43.7 | 53.3 | 45.6 | 44.5 |
| 11 | V&K-16V | 46.6 | 42 | 12.7 | - | 64.6 | 42.8 | 20.8 | 18.5 | 38.8 | 33.5 | 42.4 | 32.9 | 36.0 |
| 12 | V&K-24V | 37.0 | 33.4 | 10.0 | - | 54.1 | 40.0 | 17.5 | 19.9 | 34.3 | 28.9 | 43.9 | 22.7 | 31.1 |
| 13 | Reg M-4V | 52.43 | 50.80 | 19.74 | 35.66 | 61.24 | 46.82 | 20.85 | 20.31 | 50.60 | 42.01 | 53.42 | 53.11 | 42.25 |
| 14 | Reg M-8V | 42.98 | 37.96 | 13.18 | 34.61 | 41.59 | 38.66 | 16.13 | 12.55 | 37.94 | 33.19 | 43.00 | 40.43 | 32.68 |
| 15 | Reg M-16V | 29.90 | 24.37 | 7.73 | 32.06 | 38.75 | 29.23 | 12.18 | 10.32 | 25.62 | 24.82 | 29.50 | 25.16 | 24.14 |
| 16 | Reg M-24V | 21.71 | 14.21 | 5.62 | 29.44 | 29.16 | 25.15 | 9.16 | 6.98 | 18.94 | 15.47 | 26.38 | 17.97 | 18.35 |
| 17 | Our V-4V | 63.3 | 63.4 | 24.1 | - | 71.8 | 55.7 | 25.6 | 29.9 | 68.0 | 53.9 | 62.4 | 59.4 | 52.6 |
| 18 | Our V-8V | 59.1 | 54.2 | 19.3 | - | 64.3 | 51.7 | 23.7 | 24.9 | 56.7 | 50.4 | 55.1 | 48.2 | 46.4 |
| 19 | Our V-16V | 45.0 | 36.6 | 13.0 | - | 61.7 | 42.3 | 16.4 | 21.5 | 35.2 | 37.7 | 46.5 | 33.3 | 34.4 |
| 20 | Our V-24V | 36.4 | 28.8 | 9.0 | - | 58.6 | 36.9 | 12.1 | 14.9 | 31.5 | 31.4 | 43.8 | 22.9 | 29.3 |
* Comparison under the AVP metric for four quantization cases of 360-degree views (into 4, 8, 16, 24 bins respectively, with increasing difficulty).
Table 4: Comparison with jointly object detection and pose estimation.
@inproceedings{ijcai2018p141,
  title     = {HCR-Net: A Hybrid of Classification and Regression Network for Object Pose Estimation},
  author    = {Wang, Zairan and Li, Weiming and Kao, Yueying and Zou, Dongqing and Wang, Qiang and Ahn, Minsu and Hong, Sunghoon},
  booktitle = {Proceedings of the Twenty-Seventh International Joint Conference on
               Artificial Intelligence, {IJCAI-18}},
  publisher = {International Joint Conferences on Artificial Intelligence Organization},
  editor    = {Jérôme Lang},
  pages     = {1014--1020},
  year      = {2018},
  month     = {7},
  note      = {Main track},
  doi       = {10.24963/ijcai.2018/141},
  url       = {https://doi.org/10.24963/ijcai.2018/141},
}
TY - CPAPER TI - HCR-Net: A Hybrid of Classification and Regression Network for Object Pose Estimation AU - Wang, Zairan AU - Li, Weiming AU - Kao, Yueying AU - Zou, Dongqing AU - Wang, Qiang AU - Ahn, Minsu AU - Hong, Sunghoon T2 - Proceedings of the Twenty-Seventh International Joint Conference on Artificial Intelligence, IJCAI-18 PB - International Joint Conferences on Artificial Intelligence Organization PY - 2018 SP - 1014 EP - 1020 DO - 10.24963/ijcai.2018/141 UR - https://doi.org/10.24963/ijcai.2018/141 ER -Copied
Machine-readable versions of this paper, for tools and AI agents:





