
Stochastic Online Anomaly Analysis for Streaming Time Series
Proceedings of the Twenty-Sixth International Joint Conference on Artificial Intelligence. Main track. Pages 3189-3195.
https://doi.org/10.24963/ijcai.2017/445
Keywords
- Machine Learning: Machine Learning
- Machine Learning: Time-series/Data Streams
Abstract
Identifying patterns in time series that exhibit anomalous behavior is of increasing importance in many domains, such as financial and Web data analysis. In real applications, time series data often arrive continuously, and usually only a single scan is allowed through the data. Batch learning and retrospective segmentation methods would not be well applicable to such scenarios. In this paper, we present an online nonparametric Bayesian method OLAD for anomaly analysis in streaming time series. Moreover, we develop a novel and efficient online learning approach for the OLAD model based on stochastic gradient descent. The proposed method can effectively learn the underlying dynamics of anomaly-contaminated heavy-tailed time series and identify potential anomalous events. Empirical analysis on real-world datasets demonstrates the effectiveness of our method.
- [Aggarwal, 2013] Charu Aggarwal. Outlier analysis. Springer, 2013.
- [Chandola et al., 2009] Varun Chandola, Arindam Banerjee, and Vipin Kumar. Anomaly detection: A survey. ACM Computing Surveys, 41(3):15:1-15:58, 2009.
- [Duchi et al., 2011] John Duchi, Elad Hazan, and Yoram Singer. Adaptive subgradient methods for online learn- ing and stochastic optimization. The Journal of Machine Learning Research, 12:2121-2159, 2011.
- [Görnitz et al., 2015] Nico Görnitz, Mikio Braun, and Mar- ius Kloft. Hidden markov anomaly detection. In Proceed- ings of the 32 nd International Conference on Machine Learning, 2015.
- [Gupta et al., 2014] Manish Gupta, Jing Gao, Charu Aggar- wal, and Jiawei Han. Outlier detection for temporal data: a survey. IEEE Transaction on Knowledge and Data En- gineering, 25(1), 2014.
- [Hoffman et al., 2013] Matthew Hoffman, David Blei, Chong Wang, and John William Paisley. Stochastic variational inference. Journal of Machine Learning Research, 14(1):13031347, 2013.
- [Lakhina et al., 2004] Anukool Lakhina, Mark Crovella, and Christophe Diot. Diagnosing network-wide traffic anoma- lies. In Proceedings of SIGCOMM, 2004.
- [Ma and Perkins, 2003] Junshui Ma and Simon Perkins. Time-series novelty detection using one-class support vec- tor machines. In Proceedings of the International Joint Conference on Neural Networks, 2003.
- [Nadarajah and Kotz, 2008] Saralees Nadarajah and Samuel Kotz. Estimation methods for the multivariate t distri- bution. Acta Applicandae Mathematicae, 102(1):99-118, 2008.
- [Osborne et al., 2012] Michael Osborne, Stephen Roberts, Alex Rogers, and Nicholas Jennings. Real-time informa- tion processing of environmental sensor network data us- ing bayesian gaussian processes. ACM Transactions on Sensor Networks (TOSN), 9(1):1-32, 2012.
- [Pimentel et al., 2014] Marco Pimentel, David Clifton, Lei Clifton, and Lionel Tarassenko. A review of novelty de- tection. Signal Processing, 99:215-249, 2014.
- [Rasmussen and Williams, 2006] Carl Rasmussen and Christopher Williams. Gaussian Processes for Machine Learning. The MIT Press, 2006.
- [Robbins and Monro, 1951] Herbert Robbins and Sutton Monro. A stochastic approximation method. The annals of mathematical statistics, pages 400-407, 1951.
- [Roberts et al., 2013] Stephen Roberts, Michael Osborne, Mark Ebden, Steven Reece, Neale Gibson, and Suzanne Aigrain. Gaussian processes for time series modelling. Philosophical Transactions of the Royal Society of London A, 371(1984), 2013.
- [Roth, 2013] Michael Roth. On the multivariate t distri- bution. Technical Report LiTH-ISY-R-3059, Linköpings Universitet, 2013.
- [Saada and Meng, 2012] Mohamad Saada and Qinggang Meng. An efficient algorithm for anomaly detection in a flight system using dynamic bayesian networks. In Neural Information Processing, Volume 7665 of the series Lecture Notes in Computer Science, 2012.
- [Saligrama and Zhao, 2012] Venkatesh Saligrama and Manqi Zhao. Local anomaly detection. In Proceed- ings of the 15th International Conference on Artificial Intelligence and Statistics (AISTATS), 2012.
- [Seeger, 2004] Matthias Seeger. Low rank updates for the cholesky decomposition. Technical report, University of California, Berkeley, 2004.
- [Shah et al., 2014] Amar Shah, Andrew Wilson, and Zoubin Ghahramani. Student-t processes as alternatives to gaus- sian processes. In Proceedings of the 17th International Conference on Artificial Intelligence and Statistics (AIS- TATS), 2014.
- [Smith et al., 2012] Mark Smith, Steven Reece, Stephen Roberts, and Iead Rezek. Online maritime abnormality de- tection using gaussian processes and extreme value theory. In Proceedings of the 12th IEEE International Conference on Data Mining (ICDM), pages 645-654, 2012.
- [Vallis et al., 2014] Owen Vallis, Jordan Hochenbaum, and Arun Kejariwal. A novel technique for long-term anomaly detection in the cloud. In Proceedings of the 6th USENIX Workshop on Hot Topics in Cloud Computing, 2014.
- [Xu et al., 2016] Zhao Xu, Lorenzo von Ritter, and Kristian Kersting. Adaptive streaming anomaly analysis. In Pro- ceedings of NIPS 2016 Workshop on Artificial Intelligence for Data Science, 2016.
References were extracted automatically from the PDF and may contain errors.
Full text extracted automatically from the PDF; figures, tables and equations may differ. The PDF is the version of record.
1 Introduction
Sequential pattern mining is an important and challenging research area with interesting applications to finance, Web, mobile and IoT data analysis. For example, detection of anomalous events in the financial time series can help understand trading behavior, identify fraudulent transactions and estimate value-at-risk. Another example is anomaly analysis in network data, which can potentially improve the availability, performance, security, and the overall service experience of network systems. Due to its practical importance and technical challenges, a number of time series anomaly detection methods have been investigated in the literature [Aggarwal, 2013; Chandola et al., 2009; Gupta et al., 2014; Pimentel et al., 2014], such as support vector machines [Ma and Perkins, 2003], dynamic Bayesian networks [Saada and Meng, 2012], principal component analysis [Lakhina et al., 2004] and Gaussian process [Smith et al., 2012]. However, time series data in many real-world systems usually arrives in a streaming fashion, and is continuously accumulated. Consequently, it is practically impossible to store the entire stream for learning and inference to detect anomalies. Moreover, the models are expected to directly learn from the anomaly-contaminated heavy-tailed time series data and identify the deviations.
To address these challenges, we present a flexible and robust nonparametric Bayesian method OLAD for online anomaly detection in streaming time series. We develop an online Student-t process (TP) method to learn the underlying dynamics of time series and identify potential anomalous events in real time. By embedding the method in a nonparametric Bayesian framework, the OLAD has good properties such as nonparametric representation and analytic predictive distributions. The heavy-tailed distributions of the OLAD provide robustness against unknown anomalies in the time series. This allows the method to effectively capture the normal patterns of anomaly-contaminated time series during the iterative learning process. The OLAD has extra flexibility in that the predictive covariance explicitly depends on the known observations. The more accurate predictive covariance will help to enhance the anomaly detection performance. In addition, online learning is a challenging problem in nonparametric Bayesian models, especially for TP, as the observations are not independent of each other (see e.g. the non-diagonal covariances). We develop a novel approach based on stochastic gradient descent to learn the hyperparameters of Student-t processes in an online fashion. We optimize predictive likelihood of newly available observations, instead of the nondecomposable joint likelihood, to stochastically fit the model to the new data. As the commonly used backpropagation in neural networks is not applicable here, we develop the formulations for computing the gradients in the TP framework. Experiments on synthetic, network traffic and financial time series datasets demonstrate the flexibility and effectiveness of our method.
The rest of the paper is organized as follows. We start off with a brief review of related work. Afterwards we describe the OLAD method in Section 3. Before concluding, we present our experimental results on both real and synthetic datasets in Section 4.
2 RelatedWork
Anomaly analysis for sequential data [Aggarwal, 2013; Chandola et al., 2009; Gupta et al., 2014] is of practical importance in diverse application domains and poses a variety of technical challenges. Gornitz et al. [2015] presented a hidden Markov chain type structured output model for detection of outlier sequences. This method extends the one-class support vector machine by integration of structured output learning. Not like our work on finding outliers within a single time series, this method aims to detect anomalous ones from a set of time series. Lakhina et al. [2004] introduced a principal component analysis based method to discover normal and anomalous network conditions. It is an offline method and not applicable for the streaming time series analysis. Saligrama and Zhao [2012] proposed a graph-based statistical notion to compute anomaly scores of spatio-temporal data with local neighborhood distances. Saada and Meng [2012] introduced a method based on dynamic Bayesian networks (DBN) to find anomalies in flight data. They learned a DBN to model discrete pilot actions and to detect pilot errors in the past. These two methods model the spatio-temporal data and discrete action/environment data respectively, while our work focuses on continuous time series streams. Smith et al. [2012] combined Gaussian process and extreme value theory (EVT) to uncover anomalous behaviors in time series. They relaxed the basic i.i.d assumption (independent identical distribution) of EVT. Twitter's Anomaly Detection method introduced in [Vallis et al., 2014] is another recent work, which models regular patterns with time series decomposition and employs robust statistical metrics together with the generalized extreme studentized deviate (ESD) test to find deviation from the learned normality. In contrast to existing approaches, we propose a flexible and robust online anomaly detection method for streaming time series. By embedding itself in a robust nonparametric Bayesian framework, the method can better model the dynamics of time series in the presence of anomalies. Additionally, we present a novel and efficient online learning approach for the proposed model with stochastic method.
3 Online Anomaly Detection
In this section, we describe our online nonparametric Bayesian method OLAD for anomaly detection in streaming time series.
3.1 Time Series StreamModeling
Assume that there is a time series stream y = {y1, y2, . . .} with an infinite number of observations. We use Studentt process (TP) [Shah et al., 2014] to model the stream. In particular, the time series is viewed as a function yt = f(t) (shortened as ft) of the time t. The function f represents the underlying dynamics of the time series. This modeling method can easily address unevenly spaced time series and missing value problem. More importantly, for the task of anomaly detection, it can avoid introducing anomalies into predictors like the autoregression based methods do, thus potentially reduces the complexity of modeling anomalies in time series. The functional form of f is often unknown. As the real time series can be of any shape and include anomalous observations, we assume that the function f itself is random and drawn from a TP, which defines a robust nonparametric distribution over functions. By embedding itself in a robust nonparametric Bayesian framework, the time series modeling method has three main advantages. First we can quantify prediction uncertainty that could be introduced by limitations in the quantity and the quality of the data. Second, due to the flexible nonparametric nature, the method can model complex data as well as prevent overfitting if complex models are not warranted by the data. Most importantly, the method can make robust inference resistant to anomalies that may unduly affect performance of statistical models.
Now the streaming time series can be represented as an infinite dimensional vector {f1, f2, . . .}, which t'th dimension is the function value ft. The vector follows a TP prior
which is characterized as follows: mean function µ(t) and covariance function (a.k.a. kernel) k(t, t′ ) as well as degrees of freedom ν > 2. More precisely, the generative process for a time series stream can be specified as follows
That is, we first draw a covariance function ζ from the inverse Wishart process IWP(ν, k), which is then used to draw functions- the time series-from a Gaussian process GP(µ, (ν - 2)ζ). They are formally defined as follows:
Definition 1. A function ζ follows an inverse Wishart process (IWP) on some input space X with parameters ν ∈ R+ and base kernel (positive definite) k : X × X → R if for any finite collection x1, . . . , xn ∈ X, ζ(x1, . . . , xn) follows an inverse Wishart distribution IWn(ν,K), where K ∈ Π(n) with Ki,j = k(xi, xj) and Π(n) is a set of n×n real valued, symmetric, positive definite matrices.
Definition 2. A function f follows a Gaussian process (GP) on some input space X with parameters: mean µ : X → R and kernel (positive definite) ζ : X × X → R if for any finite collection x1, . . . , xn ∈ X, f(x1), . . . , f(xn) follow a multivariate Gaussian distribution Nn(m, K), where m ∈ Rn with mi = µ(xi) and K ∈ Π(n) with Ki,j = ζ(xi, xj ).
The generative process (1) reveals that a Student-t process actually defines a hierarchical Gaussian process: the covariance function of the Gaussian process is not parameterized, but random and drawn from an inverse Wishart process with a base kernel k. This additional generative level increases flexibility of the Student-t process and makes inference robust against outlier [Shah et al., 2014].
Given the hierarchical generative process, the distribution of a time series f = {ft : t = 1, . . . , n} of length n is:
Since the inverse Wishart distribution is a conjugate prior of the covariance matrix of a Gaussian distribution, the integration can be solved analytically. Thus we end up getting a multivariate Student-t distribution p(f |ν, m, K) by marginalizing out Σ. As already mentioned, the TP based time series model involves three parameters: mean function µ (computing m), kernel function k (computing K) and degree of freedom ν. Without loss of generality, we often assume a zero mean function [Rasmussen and Williams, 2006]. For the kernel k, typical choices include, e.g.:
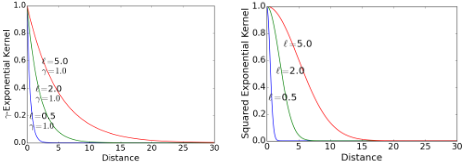
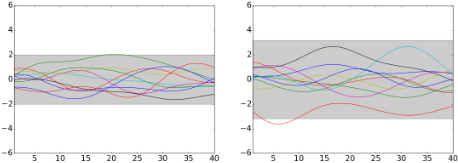
where d = t - t′ denotes the time difference between two observations. Typically, k(t, t′ ) quickly decays to zero with increasing distance d as illustrated in Fig. 1. This is a sensible feature in time series modeling as it turns out that historical data can be discarded reasonably if it is far away from the current time steps to be predicted; a kind of forgetting. More details about time series kernels can be found in [Roberts et al., 2013]. We also investigate automatic kernel selection for Student-t processes [Xu et al., 2016]. In addition, the degree of freedom ν also has an intuitive meaning. It controls how heavy-tailed the process is. A small ν means a heavy tail, and leads to a process that is more prone to producing outliers. This flexibility compared to Gaussian processes is illustrated in Fig. 2. As one can see, the variance of TP is significantly larger than GP.
Modeling noise in time series with TPs is also an important issue. In Bayesianmodeling, it is common tomodel the noisy observations as yt = ft + ϵt, where ϵt ∼ N(0, σ2n ) is independent noise. When f follows a Student-t distribution, as in our case, the model is unfortunately not analytically tractable. To overcome this problem, the noise is modeled via integrating it into the base kernel k, see e.g. [Shah et al., 2014], i.e., k(t, t′ ) + σ2n δ(t, t′ ), where δ is the delta function.
Putting everything together, the joint distribution of a noisy time series of length n can be defined as a multivariate Student-t distribution MV Tn(ν, 0, K + σ2n I) =
where Γ and I denote Gamma function and identity matrix, respectively.
3.2 Prediction of Normal Behaviors
After getting the underlying dynamics of the time series, represented as the function f, we can now estimate the normal behavior of streaming time series in the near future. Formally, given the model and the observed noisy time series y = {y1, . . . , yn} of length n, we predict the unknown value f∗ at the next time t∗ ←n+1.
The predictive distribution of f∗ can be computed as follows. Based on the property of the TP, (y; f∗) follows a (n + 1)-dimensional Student-t distribution with zero-mean and covariance matrix[K +σ2n I k∗
where k∗,∗ = k(t∗, t∗) is the variance of the new function value f∗, and k∗ is a column vector of size n, whose i'th entry is k(ti, t∗). With this, the predictive distribution of f∗ is analytically tractable [Roth, 2013]. More precisely, we have
where UV T denotes the univariate Student-t distribution. One may notice that: the variance of f∗ depends on the observed time series. The variance will increase when there are anomalies in the observations. It is prudent for reducing false alarm in anomaly detection.
However, the time series in many cases arrive as streams. This makes batch mode computation prohibitively expensive. In particular, at each time step t∗ > n, we have to perform the one-step ahead prediction from scratch as described in (3). To solve the problem, we develop an online prediction for Student-t processes, which is inspired by that for Gaussian processes [Osborne et al., 2012; Seeger, 2004].
Assume that we have performed a one-step ahead prediction at time n + 1. Now the observation ynew at time n + 1 is newly available, and we want to make a prediction for the next time step t∗ ← n + 2. The covariance matrix of the totally n + 1 observations ˜y = (y; ynew) can be written as
which updates the covariance matrix of the last time step by just adding one column and one row with the covariance knew between new and previous observations, and the variance knew,new+σ2n of the new observation. The covariance matrix is then represented with Cholesky decomposition ˜K = ˜L˜LT with the Cholesky factor ˜L = [ L 0 ˜ ℓTnew ˜ ℓnew,new ], where
˜ ℓnew is a column vector of size n, and L is the Cholesky factor of K + σ2n I, computed in the last time step. Then we get the online update with:
For computational efficiency and numerical stability, we use auxiliary variables ˜a = ˜L \ ˜y and ˜b = ˜L \ k∗. The notation x = A\c means solving the triangular system Ax = c by forward substitution. Again we use incremental representation ˜a ≡ (a; ˜anew) and get
With the online updated variables the prediction can be com-
The entire procedure of the online method for one-step ahead prediction is summarized in Alg. 1. The method reduces the computational complexity O(n3 ) of the batch mode to O(n2 ). As kernels decay quickly with increasing distance d (see Fig. 1), the historical data can then be discarded and we can keep a reasonable small n with good predictions.
Algorithm 1: Online one-step ahead prediction for streaming time series
Input : ynew (newly available observation), y (previous observations), knew (covariance between ynew and y), k∗ (covariance between fn+2 and y, ynew), knew,new (variance of fnew), k∗,∗ (variance of fn+2), σ2n (noise variance)
Output: m∗ (mean) and σ2 ∗ (variance) of the one-step ahead prediction.
3.3 Hyperparameter Estimation
The OLAD model is in a full Bayesian framework, the hyperparameters can then be estimated by optimizing a loss function that is generally defined as negative log-likelihood. In addition, we explore a stochastic gradient descent based method for online parameter estimation.
We first estimate the hyperparameters by minimizing the negative log-likelihood with gradient methods [Nadarajah and Kotz, 2008]:
where the constant terms are removed. The derivatives w.r.t. the hyperparameters are computed as follows:
with α = LT \ a, ˆ ν = log(ν - 2). ψ is digamma function, and θi denotes the i'th kernel parameter. We compute the derivative w.r.t. ˆ ν, instead of ν, due to the constraint ν > 2.
With the success of deep learning, stochastic gradient descent (SGD) method attracts increasing attention [Robbins and Monro, 1951; Duchi et al., 2011; Hoffman et al., 2013]. Here we also develop an SGD-based method for online parameter estimation by sequentially fitting the newly arrived observation. In the nonparametric Bayesian framework, the loss function (8) is intractable with SGD as the observations are not independent of each other (non-diagonal kernel matrix). To solve the problem, we introduce a novel loss function: the negative log predictive likelihood of the new observation:
with the corresponding derivatives computed as:
The online method fits the time series in real time and can even lead to some non-stationary effects in practice.
3.4 Detecting Anomalies in Streams
The OLAD provides a natural way to detect anomalies from streaming time series. With historical data, the OLAD will learn the underlying dynamics of time series resistant to outliers due to the robust inference property. The one-step ahead forecast depending on the learned dynamics can be viewed as the normality of the time series in the near future. If the real observation deviates from the normality, then it will very likely be an anomaly.
| OLAD-1 | OLAD-2 | GPEVT | GP | HESD | ||
|---|---|---|---|---|---|---|
| p = 0.95 | p = 0.93 | |||||
| AUC | 0.7794 | 0.7821 | 0.6669 | 0.6708 | 0.7048 | 0.6764 |
| R2 | 0.5570 | 0.5735 | 0.3232 | 0.3414 | 0.3333 | - |
According to the predictive distribution p(f∗|y)-a onedimensional Student-t distribution-we can define a predictive interval of a certain probability P, which means the real observation will fall in the interval with a probability P. As the predictive distribution is a heavy-tailed Student-t distribution, the predictive uncertainty will grow to match the potential anomalies in historical data. This will reduce the possibility of false alarms in a data-driven fashion.
4 Empirical Analysis
We verify the proposed OLAD method on both real-world and synthetic data. We first evaluate the performance of the OLAD in an online anomaly detection scenario. The target of the experiments is to find the anomalous events in real network traffic data and financial data. The OLAD is compared to several recent baselines. Then we conduct experiments to further investigate the influence of outliers on different methods with synthetic data.
Experiments on network traffic data: We use the Yahoo dataset of real network traffic to some of the Yahoo services (https://webscope.sandbox.yahoo.com/catalog.php? datatype=s&did=70). It consists of time series representing the metrics of various Yahoo services with manually labeled anomalies. In the experiments, we apply our method to detect unusual traffic (anomalies) in data streams over time. In particular, the experiment setup is as follows. For each time series, the observations collected at the first T = 100 time steps are viewed as initialization. At each time step t after the initial period, we make a one-step ahead prediction for the next step t + 1 using the OLAD method. The prediction is a Student-t distribution with the mean m∗ and the variance σ2 ∗ (see Sec. 3.2). If the real observation yt+1 fells far outside the 99.99% predictive interval, then the observation at time t + 1 is identified as an anomaly event. The OLAD parameters is learned with the two developed methods (see Sec. 3.3), denoted as OLAD-1 and OLAD-2 respectively. We compare the OLAD with the following state-of-the-art methods:
- HESD [Vallis et al., 2014]: Twitter Anomaly Detection is based on time series decomposition and robust statistical metrics together with the generalized ESD test (https://github.com/twitter/AnomalyDetection).
- GPEVT [Smith et al., 2012]: Combine GPs and extreme value theory to detect anomalies in time series. The authors suggested to use the novelty threshold p = 0.95. We tested different values p ∈ {0.91 . . . 0.99}, and found the best results at p = 0.93.
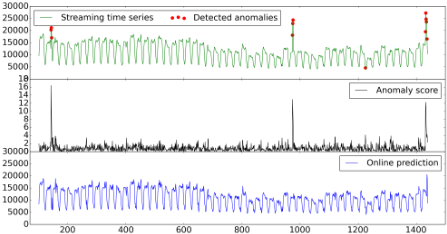
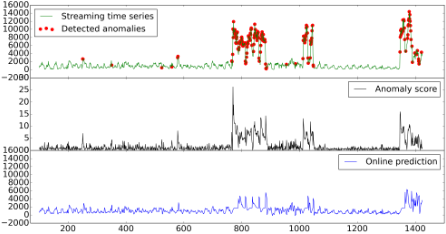
Figure 3: Detected anomalies from the Yahoo data.
- GP [Rasmussen and Williams, 2006]: Use GPs to capture normal patterns of time series.
To compare the performance of these approaches, we plot the ROC curves of the anomaly detection results, and then measure them with the area-under-the-curve (AUC). The criteria is commonly used in anomaly detection, see e.g. [Smith et al., 2012]. In addition, we compare the methods in terms of coefficient of determination (R2 ) since they detect anomalies based on predictions of the future behaviors of the streaming time series. Table 1 summarizes the experimental results averaged over randomly selected 20 time series. The R2 is unavailable for the HESD method since the Twitter Anomaly Detection package does not provide the prediction results as outputs. Here we use R2 , rather than MAE (mean absolute error) or RMSE (root mean squared error), to measure the predictive performance as the time series range differently, and it makes no sense to report averaged MAE or RMSE. From the experimental results, one can find that the OLAD provides better results with respect to anomaly detection and prediction of the future behaviors of time series. We further illustrate the results in Fig. 3 with two examples. It reveals that the proposed method can effectively detect anomalous traffic in streaming time series.
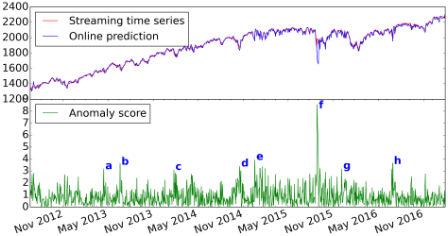
Experiments on financial data: We also validate the OLAD method with the S&P 500 index data (https://fred. stlouisfed.org/series/SP500) from January 2012 to January 2017. In Fig. 4, the top plot shows the predicted index with MAE = 16.3763 and R2 = 0.9892. The bottom plot shows the anomaly scores. Since the dataset has no labeled anomalies, we perform a qualitative analysis on the detected anomalies. We find that the results are quite interpretable and nicely coincide with the significant events with regard to the stock market (marked in the figure for large scores). For example, the detected recent anomalies are related to Brexit in June 2016, the ECB's stimulus package in December 2015, and the Chinese Yuan devaluation in August 2015.
| Outliers | MAE | RMSE | R2 | |||
|---|---|---|---|---|---|---|
| GP | OLAD | GP | OLAD | GP | OLAD | |
| 0 | 0.0140 | 0.0123 | 0.0245 | 0.0234 | 0.9991 | 0.9992 |
| 1 | 0.1205 | 0.1217 | 0.2190 | 0.2181 | 0.9317 | 0.9322 |
| 2 | 0.5128 | 0.1476 | 0.6346 | 0.2138 | 0.4263 | 0.9349 |
| 3 | 0.6515 | 0.1918 | 0.7730 | 0.2334 | 0.1488 | 0.9224 |
| 4 | 0.6762 | 0.2545 | 0.8002 | 0.3245 | 0.0879 | 0.8500 |
| 5 | 0.7329 | 0.4031 | 0.8523 | 0.6927 | 0 | 0.3164 |
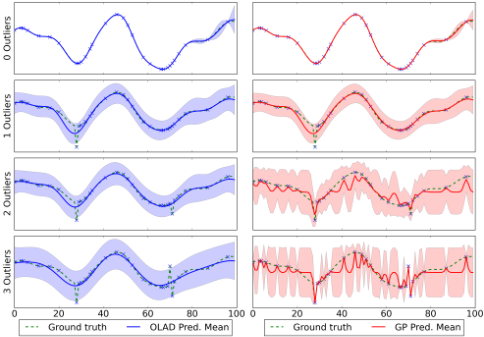
Experiments on synthetic data: We further conduct some supplementary experiments to evaluate the predictive performance of the OLAD method in learning the underlying dynamics of the contaminated time series with the simulated data. This is important for anomaly detection methods, which rely on the learned normal patterns to identify the deviation from the normality. We simulate the synthetic time series using Gaussian process with zero mean and squared exponential kernel. The time series sampled from a GP are more flexible to approach the complex real situations. In the simulation, we set the parameters of the kernel function as: ρ = 1.0 and ℓ = exp(2.0). The length of the time series was n = 100. We assume 30 time steps observed, and predict the remaining part of the time series. For the observed time steps, we randomly add m = 0, 1, . . . , 5 outliers. We compare the OLAD with the GP method, as it is the state-of-the-art in the literature, which achieves excellent performance in modeling time series, and the baseline GPEVT used in the last experiments is also based on the GP prediction. Since Twitter's Anomaly Detection package mainly focuses on anomaly detection and does not provide the time series predictions as outputs, it is not used as a baseline in this experiment. We measure the prediction results of the methods using MAE, RMSE and R2 . Table 2 summarizes the results averaged over 10 reruns. The results reveal that OLAD achieves comparable or better performance compared to the baseline GP, especially when time series are contaminated with anomalies. The degeneration of the predictive distribution of the GP with increasing number of outliers is mainly due to its weak robustness to outliers. With the same initial hyperparameter settings, the GP converges to reasonable hyperparameters and provides good predictions when there are few outliers, but degenerates when the number of outliers increases. The results are also illustrated in Fig. 5. One can see the OLAD captures the dynamics of time series in complex situations.
5 Conclusion
This paper presents an online nonparametric Bayesian method OLAD for detecting anomalous behavior in streaming time series. We develop a new and efficient stochastic online learning approach to capture temporal dynamics of time series, and estimate the predictive distribution of observations over time. OLAD also provides flexible and robust inference on anomaly-contaminated time series due to the heavytail property, and thus effectively identifies anomalous events. This advantage is of practical importance in the incremental learning process. Empirical analysis on both real and synthetic data shows promising results. There are many interesting avenues for future work such as extending the method to multivariate time series with complex correlations.
@inproceedings{ijcai2017p445,
  title     = {Stochastic Online Anomaly Analysis for Streaming Time Series},
  author    = {Xu, Zhao and Kersting, Kristian and von Ritter, Lorenzo},
  booktitle = {Proceedings of the Twenty-Sixth International Joint Conference on
               Artificial Intelligence, {IJCAI-17}},
  publisher = {International Joint Conferences on Artificial Intelligence Organization},
  editor    = {Carles Sierra},
  pages     = {3189--3195},
  year      = {2017},
  month     = {8},
  note      = {Main track},
  doi       = {10.24963/ijcai.2017/445},
  url       = {https://doi.org/10.24963/ijcai.2017/445},
}
TY - CPAPER TI - Stochastic Online Anomaly Analysis for Streaming Time Series AU - Xu, Zhao AU - Kersting, Kristian AU - von Ritter, Lorenzo T2 - Proceedings of the Twenty-Sixth International Joint Conference on Artificial Intelligence, IJCAI-17 PB - International Joint Conferences on Artificial Intelligence Organization PY - 2017 SP - 3189 EP - 3195 DO - 10.24963/ijcai.2017/445 UR - https://doi.org/10.24963/ijcai.2017/445 ER -Copied
Machine-readable versions of this paper, for tools and AI agents:





