
Learning Concise Representations of Users' Influences through Online Behaviors
Proceedings of the Twenty-Sixth International Joint Conference on Artificial Intelligence. Main track. Pages 2351-2357.
https://doi.org/10.24963/ijcai.2017/327
Keywords
- Machine Learning: Data Mining
- Machine Learning: Machine Learning
- Multidisciplinary Topics and Applications: AI and Social Sciences
Abstract
Whereas it is well known that social network users influence each other, a fundamental problem in influence maximization, opinion formation and viral marketing is that users' influences are difficult to quantify. Previous work has directly defined an independent model parameter to capture the interpersonal influence between each pair of users. However, such models do not consider how influences depend on each other if they originate from the same user or if they act on the same user. To do so, these models need a parameter for each pair of users, which results in high-dimensional models becoming easily trapped into the overfitting problem. Given these problems, another way of defining the parameters is needed to consider the dependencies. Thus we propose a model that defines parameters for every user with a latent influence vector and a susceptibility vector. Such low-dimensional and distributed representations naturally cause the interpersonal influences involving the same user to be coupled with each other, thus reducing the model's complexity. Additionally, the model can easily consider the sentimental polarities of users' messages and how sentiment affects users' influences. In this study, we conduct extensive experiments on real Microblog data, showing that our model with distributed representations achieves better accuracy than the state-of-the-art and pair-wise models, and that learning influences on sentiments benefit performance.
- [Althoff et al., 2016] Tim Althoff, Pranav Jindal, and Jure Leskovec. Online actions with offline impact: How online social networks influence online and offline user behavior. arXiv preprint arXiv:1612.03053, 2016.
- [Aral and Walker, 2012] S. Aral and D. Walker. Identifying influential and susceptible members of social networks. Science, 337(6092):337-341, 2012.
- [Artzi et al., 2012] Yoav Artzi, Patrick Pantel, and Michael Gamon. Predicting responses to microblog posts. In Pro- ceedings of the 2012 Conference of the North American Chapter of the Association for Computational Linguistics, pages 602-606, 2012.
- [Bindel et al., 2015] David Bindel, Jon Kleinberg, and Sigal Oren. How bad is forming your own opinion? Games and Economic Behavior, 92:248-265, 2015.
- [Crane and Sornette, 2008] R. Crane and D. Sornette. Ro- bust dynamic classes revealed by measuring the response function of a social system. Proceedings of the National Academy of Sciences, 105(41):15649-15653, 2008.
- [Du et al., 2013] Nan Du, Le Song, Hyenkyun Woo, and Hongyuan Zha. Uncover Topic-Sensitive Information Dif- fusion Networks. In Proceedings of the Sixteenth Interna- tional Conference on Artificial Intelligence and Statistics, pages 229-237, 2013.
- [Du et al., 2016a] Nan Du, Hanjun Dai, Rakshit Trivedi, Utkarsh Upadhyay, Manuel Gomez-Rodriguez, and Le Song. Recurrent marked temporal point processes: Em- bedding event history to vector. In Proceedings of the 22nd ACM SIGKDD International Conference on Knowledge Discovery and Data Mining, pages 1555-1564. ACM, 2016.
- [Du et al., 2016b] Nan Du, Yingyu Liang, Maria-Florina Balcan, Manuel Gomez-Rodriguez, Hongyuan Zha, and Le Song. Estimating diffusion networks: Recovery con- ditions, sample complexity & soft-thresholding algorithm. Journal of Machine Learning Research (JMLR), 2016.
- [Gionis et al., 2013] Aristides Gionis, Evimaria Terzi, and Panayiotis Tsaparas. Opinion maximization in social net- works. In SDM, pages 387-395. SIAM, 2013.
- [Gomez-Rodriguez et al., 2010] M. Gomez-Rodriguez, J. Leskovec, and A. Krause. Inferring networks of diffusion and influence. In Proceedings of the 16th ACM SIGKDD International Conference on Knowledge Discovery and Data Mining, pages 1019-1028, 2010.
- [Gomez-Rodriguez et al., 2011] Manuel Gomez-Rodriguez, David Balduzzi, and Bernhard Schölkopf. Uncovering the Temporal Dynamics of Diffusion Networks. In Pro- ceedings of the 28th International Conference on Machine Learning, pages 561-568, 2011.
- [Gomez-Rodriguez et al., 2013a] M. Gomez-Rodriguez, J. Leskovec, and B. Schölkopf. Modeling information propagation with survival theory. In Proceedings of the 30th ICML, pages 666-674, 2013.
- [Gomez-Rodriguez et al., 2013b] M. Gomez-Rodriguez, J. Leskovec, and B. Schölkopf. Structure and dynamics of information pathways in online media. In Proceedings of the 6th WSDM, pages 23-32, 2013.
- [Goyal et al., 2010] A. Goyal, F. Bonchi, and L. V. Laksh- manan. Learning influence probabilities in social net- works. In Proceedings of the 3rd WSDM, pages 241-250, 2010.
- [Lawless, 2011] Jerald F Lawless. Statistical Models and Methods for Lifetime Data, volume 362. 2011.
- [Liu et al., 2010] Lu Liu, Jie Tang, Jiawei Han, Meng Jiang, and Shiqiang Yang. Mining Topic-level Influence in Het- erogeneous Networks. October, pages 199-208, 2010.
- [Lu et al., 2016] Wei-Xue Lu, Chuan Zhou, and Jia Wu. Big social network influence maximization via recursively es- timating influence spread. Knowledge-Based Systems, 113:143-154, 2016.
- [Mavroforakis et al., 2015] Charalampos Mavroforakis, Is- abel Valera, and Manuel Gomez Rodriguez. Hierarchi- cal dirichlet hawkes process for modeling the dynamics of online learning activity. In Workshop on Networks in the Social and Information Sciences, 2015.
- [Mikolov et al., 2013] Tomas Mikolov, Ilya Sutskever, Kai Chen, Greg S Corrado, and Jeff Dean. Distributed repre- sentations of words and phrases and their compositional- ity. In Advances in neural information processing systems, pages 3111-3119, 2013.
- [Richardson and Domingos, 2002] Matthew Richardson and Pedro Domingos. Mining knowledge-sharing sites for vi- ral marketing. In Proceedings of the 8th ACM SIGKDD In- ternational Conference on Knowledge Discovery and Data Mining, pages 61-70, 2002.
- [Saito et al., 2008] K. Saito, R. Nakano, and M. Kimura. Prediction of information diffusion probabilities for inde- pendent cascade model. In Knowledge-Based Intelligent Information and Engineering Systems, pages 67-75, 2008.
- [Shen et al., 2014] Huawei Shen, Dashun Wang, Chaoming Song, and Albert-László Barabási. Modeling and predict- ing popularity dynamics via reinforced poisson processes. In Proceedings of the 28th AAAI Conference on Artificial Intelligence (AAAI 2014), pages 291-297, 2014.
- [Tang et al., 2009] J. Tang, J. Sun, C. Wang, and Z. Yang. Social influence analysis in large-scale networks. In Pro- ceedings of the 15th ACM SIGKDD International Confer- ence on Knowledge Discovery and Data Mining, pages 807-816, 2009.
- [Wang et al., 2015] Yongqing Wang, Huawei Shen, Shenghua Liu, and Xueqi Cheng. Learning user-specific latent influence and susceptibility from information cascades. In Twenty-Ninth AAAI Conference on Artificial Intelligence, 2015.
- [Wang et al., 2016a] Yichen Wang, Evangelos Theodorou, Apurv Verma, and Le Song. A stochastic differential equa- tion framework for guiding information diffusion. arXiv preprint arXiv:1603.09021, 2016.
- [Wang et al., 2016b] Yichen Wang, Bo Xie, Nan Du, and Le Song. Isotonic hawkes processes. In Proceedings of The 33rd International Conference on Machine Learning, pages 2226-2234, 2016.
- [Zeiler, 2012] Matthew D Zeiler. Adadelta: an adaptive learning rate method. arXiv preprint arXiv:1212.5701, 2012.
- [Zhao et al., 2015] Qingyuan Zhao, Murat A Erdogdu, Hera Y He, Anand Rajaraman, and Jure Leskovec. Seis- mic: A self-exciting point process model for predict- ing tweet popularity. In Proceedings of the 21th ACM SIGKDD International Conference on Knowledge Discov- ery and Data Mining, pages 1513-1522. ACM, 2015.
References were extracted automatically from the PDF and may contain errors.
Full text extracted automatically from the PDF; figures, tables and equations may differ. The PDF is the version of record.
1 Introduction
Social network services generally allow users to post, forward, share, or "like" a piece of information; to comment on a product or service; or to "check in" at a place of interest. All the above behaviors can be grouped as temporal sequences of users' activity, which are known as temporal cascades. Thus a temporal cascade contains users' actions with regard to a specific piece of information, product, place, etc. Since such actions are publicly visible, and since the system purposefully shares the information with related users or communities, users in a cascade influence each other [Goyal et al., 2010; Althoff et al., 2016], similar to a contagion of behaviors.
Scholars have applied the concept of contagion to study viral marketing [Richardson and Domingos, 2002], influence maximization [Gionis et al., 2013; Du et al., 2016b; Lu et al., 2016], and how opinion forms [Bindel et al., 2015; Wang et al., 2016a]. These studies and applications need a way to know the causality of who influences whom, as well as accurate values of influences. In addition, the influences are usually different, depending on who the actors and recipients of the action are [Aral and Walker, 2012]. Therefore, accurately quantifying the interpersonal influences involved is fundamental to a proper understanding of viral marketing, influence maximization, and understanding opinion formation.
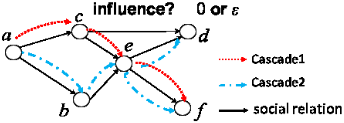
In previous works, interpersonal influences are estimated by machine learning from the observed data [Saito et al., 2008]. Those studies suffer from the overfitting problem in sparse data, because of how they define their model parameters. A free parameter on each user pair in those models. Such pair-wise parameters do not consider dependency, especially when those influences originate from or act on the same user. For the parameters of such user pairs, the overfitting problem occurs, resulting in inaccurate estimation. For an intuitive example in Figure 1, the interpersonal influence cannot be learned for user pair c and d, who do not appear in the same cascade with information passing between them. In such a case, even though c, d, and e form a social triangle, a zero or some empirically small constant ǫ is assigned, implying that information would never or seldom be passed between them in the future, which can be inaccurate. In fact, power-law-like distributions can always be found in social network analysis, which suggests that the number of user pairs between whom information is rarely passed cannot be ignored.
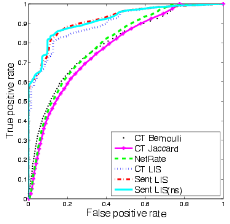
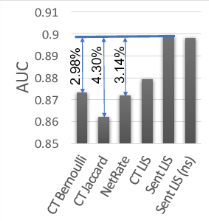
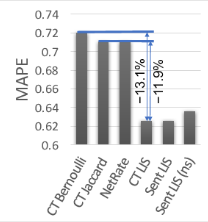
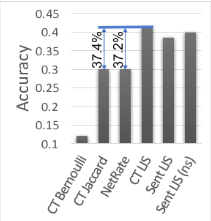
Figure 2: Our models are CT LIS, and its variants: Sent LIS and Sent LIS(ns). (a) The ROC curves of prediction results of next infected user. (b) The area under ROC curve (AUC) is used for next infected user prediction. (c) Mean absolute percentage error (MAPE) is used for cascade size prediction, and a good model should have small MAPE. (d) The top-one accuracy is used to measure the prediction accuracy of "who will be retweeted".
Therefore we propose to define model parameters for individual users as opposed to user pairs, specifically users' influence vectors and susceptibility vectors. For clarity, we use interpersonal influence to indicate the likelihood that information will be passed between two people, and influence vector to indicate a unilateral influence from a user and susceptibility vector is a unilateral susceptibility of a user. The interpersonal influences are modeled by the product of the influence vector from one user and the susceptibility vector from another. The advantages of our model named "CT LIS" is:
- Dependency awareness: our model captures the dependency of two interpersonal influences that are sending from the same user, or received by the same user, by the shared influence or the shared susceptibility vector respectively. For example, the interpersonal influence from c to d in Figure 1 is estimated with c's influence vector and d's susceptibility vector. The interpersonal influence of user c to user e contains c's influence vector as well. So, on account of the shared influence vector, the above two interpersonal influences couple with each other as expected. And interpersonal influence between user c and user d can be learned without overfitting.
- Conciseness: our model uses fewer parameters O(n · D), instead of O(n2 ) parameters for user pairs to represent users' influence, where n is the number of users, and D is the dimension of influence and susceptibility vectors. Using a less complex model offers an advantage in modeling sparse data.
- Effectiveness: our model achieved the best performance on real Microblog data for three prediction tasks on: next infected user, cascade size, and "who will be retweeted" (see Figure 2).
- Unification of temporal and categorical information: our model proposes a unified framework based on temporal model, to make use of infection time, and categorical attributes, like sentiments and topics of review text.
2 RelatedWork
Previous work on cascade dynamics was studied based on point-process or influence models. [Zhao et al., 2015; Shen et al., 2014] used the variants of Poisson process to predict cascade size. Hawkes process was also studied to model the dynamics [Mavroforakis et al., 2015; Wang et al., 2016b]. [Du et al., 2016a] proposed to use Recurrent Neural Network to predict the next point and time. The point-process based work model cascade dynamics in a macroscopic view, and did not explicitly consider the interpersonal influence.
In terms of influence models, scholars estimated interpersonal influences and their relationship to information propagation. Some of them made efforts to extract features that are related to propagation probability and learned from the observed information cascades [Crane and Sornette, 2008; Aral andWalker, 2012]. [Artzi et al., 2012] predicted whether a user would respond to or retweet a message, thus being influenced, based on classification of demographic and content features. [Saito et al., 2008] learned the propagation probability between neighbors of a directed network, using the orders of users become infected. [Goyal et al., 2010] proposed to estimate the interpersonal influences, using assumptions from the Bernoulli model and Jaccard Index separately. NetInf [Gomez-Rodriguez et al., 2010] modeled propagation probability, using exponential and power-law incubation time separately to infer the underlying network. [Tang et al., 2009; Liu et al., 2010] proposed a topic factor graph (TFG) to model the generative process of the topic-level social influence on large networks and heterogeneous networks respectively. LIS model [Wang et al., 2015] learned users' representations from the sequence of infected users, without temporal information.
Moreover, a series of work learned interpersonal influence with survival model and its variants to infer underlying networks. NetRate [Gomez-Rodriguez et al., 2011] used survival theory to model the transmission rate between every user pair, which was viewed as an edge weight of the influence network. [Gomez-Rodriguez et al., 2013a] then modeled the hazard rate in a survival model with additive and multiplicative risks separately to improve the performance of cascade size prediction. Afterwards, InfoPath [Gomez-Rodriguez et al., 2013b] was proposed to learn timevarying transmission rates for user pairs as the edge weights of the hidden dynamic network. The distribution of content topics has also been considered [Du et al., 2013]. Taken together, these methods work in a pair-wise manner, i.e., they learned the propagation probability between pairs of users. This approach is fundamentally different from the proposed method proposed in this paper, which focuses on inferring user-specific influence and susceptibility from historical cascades. Also influence representations on sentimental polarities can be learned in our model.
3 Learning Users' Influences
A temporal cascade C for actions on a target is defined as
where vi is the user who takes the action at time ti, and N is the total number of acting users, i.e., the cascade size. A temporal cascade is associated with an object, e.g., a message, a product, or a hotel. To simplify the description of our model, we do not specify the identity of the target or message until we establish the overall objective function at the end.
To make our model more general, we assume that any pair of users can have an interpersonal influence, or probability of passing information between them. A very small or zero value of influence can capture the underlying disconnections of the user network, and vice versa. When a social network is available, we can easily apply it in our model as a constraint that only connected users can influence each other.
3.1 Survival Analysis Model
Before presenting our model, we introduce the prior knowledge of the Survival Analysis Model [Lawless, 2011], which is used to model life time of a species exploring to some hazard environment. We mimic the life time as the incubation time before a user being infected and taking an action. Thus we define the infection time T of a user as a continuous random variable, with T ∈ [0,∞). Let f(t) and F(t) denote the probability density function (PDF) and the cumulative density function (CDF) respectively. The probability Pr(T ≤ t) = F(t). So the probability of a user not taking the action until time t is defined by the survivor function
Given that users survive until time t, a hazard function h(t) for users is defined as the instantaneous infection rate in time interval [t, t+ε) in a hazard situation, where ε is an infinitesimal elapsed time:
Noticing that f(t) = -S′ (t) and S(0) = 1 , the survivor function can be expressed as
3.2 Our ProposedModel
Our model represents a user vi with two non-negative Ddimensional vectors Ii and Si, which stand for influence representation and susceptibility representation respectively. D is a parameter for the size of vectors which is given. Without loss of generality, we can turn the representations into matrices to consider sentimental polarities. Each row of the matrices is the representation vector on a sentimental polarity. Influence matrix Ii and susceptibility matrix Si have K × D dimensions, where K is the number of sentimental polarities or classes. The sentiment of information is defined as a oneof-K vector o. Only one element in vector o can be 1 with the others being zero, indicating that the information belongs to that corresponding sentiment class. When K = 1 and o = 1, the model reverts back to vector representations of no sentiments. Thus we introduce our model in a general form with sentiment o in the following sections.
For a cascade with sentiment o, the transmission rate function φ(·) from users vj to vi, is defined by equation:
where matrix Ij and matrix Si are parameters that capture the influence of user vj and the susceptibility of user vi respectively. The transmission rate function (2) indicates the likelihood of successful passing of information between them. We use an exponential function to scale the transmission rate between 0 and 1 for regularization. So the extent of an interpersonal influence is calculated by equation (2).
To simplify, let Hji denote the set of parameters {Ij, Si, o}. With a transmission rate φ(Hji), we define the hazard function of the Survival Analysis Model for user vi at time t, under the influence from vj, as follows:
where t - tj + 1 depicts the hazard function monotonously decaying with the time elapsed from tj. Adding 1 avoids an unbounded hazard rate due to a zero or infinitesimal value of t - tj. Since equation (3) holds only when t ≥ tj, we define the hazard rate h(t|tj; φ(Hji)) = 0, when t < tj, namely, user vj has not been infected at time t. Moreover, as mentioned earlier, we can consider social network as another constraint by defining hazard function h(t|tj ; φ(Hji)) = 0, if user vi and user vj are not connected.
Given the survivor function (1) in the Survival Analysis Model, the survivor function S(t|tj; φ(Hji)) that user vi survives longer than t satisfies
Finally, given that influential user vj takes action or becomes infected at time tj, the probability density function of user vi happening (acting on the target) at time t is
With the assumption that a user is only infected by one of the previously infected users, the likelihood of user vi, i > 1
being infected at time ti in a cascade is
Thus given that user v1 takes the first action at time t1, the joint likelihood of observing the whole cascade is
To consider the negative cases, we define a time window of our observation for cascade C. The end of the time window is tE, and tE > tN. The users who do not act until tE are survivors under the influence of infected users. Thus the probability of a negative case for the survival of user vl is
Considering the negative cases, the log-likelihood of a cascade is
The negative cases contain any pair of an infected user and a surviving user. The number of survivors is always the majority of the overall social network. Thus the number of negative user pairs is much larger than that of positive pairs in a cascade. For learning efficiency, we adopt the negative sampling strategy [Mikolov et al., 2013]. We sample L users as negative cases according to the distribution P(u) ∝ R3/4 u , where Ru is the frequency of user u becoming infected in a cascade. It is worth noticing that sampling of negative cases is repeated in every optimization iteration to honor the expectation. The infection frequency of a user indicates how easily he or she could become infected again. Observing a frequently infected user who survives provides more information regarding the likelihood. Sampling negative cases from the distribution of users' infected frequencies is a better choice.
Finally, the optimization problem of learning users' influence representations and susceptibility representations is
where superscript c is used to identify the values or functions that are related to cascade C. The log-likelihood of all the observed cascades is summarized in the above objective function.
3.3 Optimization
The model learns the distributed representations of users' influences, by means of a gradient algorithm. The gradients of the transmission rate function on matrix Iv and matrix Su are
The gradients are are K × D matrices. Only the k-th row in each matrix has a non-zero gradient, when a cascade belongs to the k-th sentiment class, i.e, ok = 1.
As the negative cases for a cascade are repeatedly sampled in every iteration, we define [Vcs ]τ as the set of negative users in the τ-th iteration of the algorithm for cascade C:
where L is the set size. Moreover, Only when user v becomes infected in a cascade, i.e., t1 ≤ tv ≤ tN, the gradients of the log-likelihood (5a) on matrix Iv are non-zero; Only when user v is infected and t1 < tv ≤ tN, or user v is in a negative case, the gradients on matrix Sv are non-zero; otherwise, the gradients are always zeros.
Therefore, the gradients of the objective function (5a) on matrix Iv and matrix Sv are
where 1(·) is an indicator function, with an output of 1 if the argument is true, and 0 otherwise. The gradients gIv and gSv are K × D matrices.
The framework of Stochastic Gradient Descent (SGD) over shuffled mini-batches was employed for efficient optimization. The mini-batch size was set at 12 cascades. To solve the non-negative constraints on parameters, Projected Gradient (PG) was used to adjust the gradients. Moreover, since deciding the learning rate is not trivial, we chose Adadelta to adaptively tune the learning rate with an insensitive decay constant ρ = 0.95 as suggested in [Zeiler, 2012].
4 Experiments
To evaluate our model, we used real Microblog data crawled from Sina Weibo 1 in which users' activity in passing messages is publicly available. The temporal cascades were extracted for all the messages in the data for evaluations.
1 Sina Weibo (http://www.weibo.com), is one of the biggest Microblog websites in China.
4.1 Data and Setup
We have an initial pool of 315.6 million records including posting, retweet, and mentioning of messages between Nov 1, 2013 and Feb 28, 2014 from the timelines of 312,000 users, from the Sina Weibo database. We filtered and chose the messages with frequently used emoticons. Emoticons are labeled with positive or negative sentiment; e.g., :) and :D express positive emotion, whereas :( and :-( express negative emotion, in order to determine the message's sentiment label. In fact, any reliable sentiment classifier can also be used to determine the sentiments, which is out of our reach. In our experiments, we choose emoticons to label message sentiments without loss of generality, and we have K = 2 sentiments. Since some parts of cascades might be missing, we crawled the missing retweet records for those chosen cascades that are not integrate in the data pool. Cascades of sizes less than 8 were removed to ensure that the messages examined have attracted enough attention. The resulting sample contained 6,219 active users, and a total of 44,021 cascades from Oct 31, 2013 to Mar 3, 2014. The preprocessed data start earlier than the original data because we withdrew the missing data from the messages.
To set up the experiments, the cascades were evenly split into 10 groups. Ten-fold cross-testing is used for our evaluations, alternately training 9 of 10 groups and testing the remaining one. As we discussed in the previous work, the most representative influence models that used the same information as our model are used as competitors: NetRate, continuous version of Jaccard and Bernoulli models (denoted as CT Jaccard and CT Bernoulli). Our CT LIS model has another two variants: Sent LIS with sentiment information, Sent LIS (ns) with negative sampling. With testing on vector size of users' representations, we choose D = 8 for both efficiency and stable objective value.
4.2 Study of Users' Influences and Susceptibilities
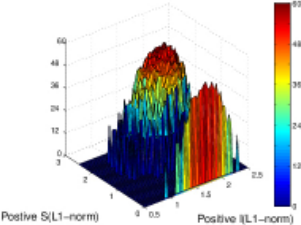
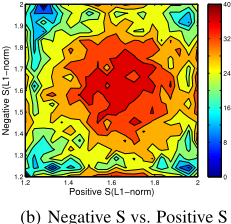
We present the distributions of influential and susceptible users from our results. With positive and negative sentiments, a user can have four vectors (from the two matrices): Positive I, Negative I, Positive S, and Negative S. We study those row vectors with L1-norms, i.e., the summation of the absolute value of each element. Thus we can use those L1-norms as coordinates of a point for each user. Figure 3 shows the contour maps to visualize the user distributions in different influence and susceptibility coordinate systems.
The distribution of "Positive S vs. Positive I" in Figure 3 (a) interestingly shows two groups of users in positive sentiment class, corresponding to two peaks in the figure. The group along the bottom axis has very lower susceptibilities but significant influences. The upper right group has both significant influences and susceptibilities. We will refer to these two groups of people as primary influential and secondary influential, respectively. The primary influential people have the power to influence other users, without being infected easily, as was also explained by Aral and Walker on Facebook users [Aral andWalker, 2012]. Interestingly, on Sina Weibo, users can get influence credit, or have more people retweet them, by being an agency or hub. So people invest considerable effort in retweeting (potentially) interesting messages
(a) Positive S vs. Positive I
to attract others to follow them and retweet from them. This type of user is not restricted to the Sina Weibo scenario. Some primary influential people like to explore new restaurants and make recommendations to their friends or audiences. Another type of user simply likes to browse other people's recommendations or ratings and advertise them to their own audiences. Similar activities might be seen in place of interest (POI) recommendation, hotel bookings, and online shopping as well. As for an online system, both primary influential and secondary influential people are important. The primary influential users represent the originating power of the system to bring new resources and initiate a cold start. The secondary influential users are good advertisers or hubs to enable other people to get information efficiently. As the primary influential people are considered high-quality users by system operators, the secondary influential ones may easily be persuaded to help in sharing advertisements. And on the negative sentiment class, we can also find the two groups of users.
In addition, from the user distribution on susceptibility vectors in Figure 3 (b), we can see that although a large group of users has the same significant susceptibilities (a large hot area in the middle), many users may be more susceptible to different sentimental messages, as shown in some hot areas closed to the four edges of the figure. We can also observe the similar distribution on influence vectors.
4.3 Prediction of Next Infected User
This task aims at predicting whether a user v will take an action (i.e., become infected) given time t. For every user, we calculate the likelihood of becoming infected. Thus we can use AUC of the ROC (receiver operating characteristic) curve (see Figure 2(a)), to measure the output likelihood.
The ROC curves in Figure 2(a) show that our models achieve better performance than list-wise models, considering the areas under the curves. All our variants, achieve higher AUC values in the classification metric.
In Figure 2(b), the average results of 10-fold cross-tests are reported. The figure shows that our CT LIS achieved consistent better AUC than the three baselines. And with sentiment information, our Sent LIS improved the AUC accuracy by at most 4.30%. Moreover, considering sentiment information improved the performance on this prediction task. Although Sent LIS(ns) cannot outperform Sent LIS, but the former's training is more efficient, since of the random sampled negative cases.
4.4 Cascade Size Prediction
Cascade size prediction (popularity) is a key part of influence maximization and viral marketing applications. In the application, we chose the first P user-time pairs in each cascade as the initial status, and we predicted the cascade size at time tN , tN > tP . tP is the infecting time of the last user in the initial tuples. We made our prediction by simulating the generation process of a cascade.
The time interval tN - tP is first evenly divided into discrete time points. Starting from the time point right after tP , every infected user u makes a random trial to infect user v at each time point τi > tP . The probability in a trial is
This is a conditional probability, given that user v will survive until time τi-1. Users who become infected in a random trial are added to the number of infected users for the next step of the simulation process. Thus, we use the mean absolute percentage error (MAPE) to measure the predictions with ground truth cascade sizes, where a smaller value indicates a better prediction. In the experiments, we chose first P = 10 users in a cascade as the initialization for the prediction. The simulations were repeated 100 times for every cascade in the test data, and the results were averaged to arrive at the prediction result.
Figure 2(c) shows that the best prediction result come from our models, achieving at least 11.9%MAPE reduction compared to the pair-wise models. Besides, considering sentiment or not did not bring much differences in our cascade size prediction, while the small differences may be the result of noisy sentiment labels.
4.5 Prediction of WhoWill Be Retweeted
"Who will be retweeted" (WBR) is a new application that helps to identify the causality of who influences whom to take an action. For example, it enables us to find out who has influenced or motivated the target user to retweet a message, "like" a webpage, buy a product, or go to some location. The relations of who retweets whom are extracted as previously described, which is treated as the ground truth. We use average Accuracy (Acc) of top-one prediction as metric.
Our results in causality judgment of who influences whom achieve more than 37.2% in the accuracy metric, as Figure 2(d) shows. Therefore, our models outperformed the pairwise models, without suffering from the over-fitting problem in causality judgment.
4.6 Discrimination of Interpersonal Influences
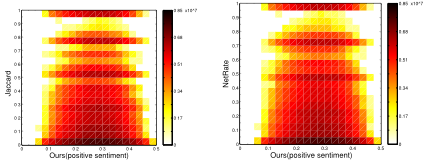
Figure 4 shows the heat map distribution of users' interpersonal influence values. In the two sub-figures, very hot and dark cells horizontally line at the bottom, with a range from 0.1 to 0.4. For the influences of those user pairs, our model discriminates the influential degrees from 0.1 to 0.4. In addition, our model shows a discriminating distribution of interpersonal influences at the higher values of the evaluation models. In summary, the figure suggests that our values are more discriminating, which can guarantee a better application performance.
(a) Our interpersonal influence
vs. CT Jaccard's
(b) Ours interpersonal influ-
ence vs. NetRate's
Figure 4: Heat map of interpersonal influences. Ours is more discriminating
5 Conclusions
In this study, we have proposed a model to learn the concise representations of users' influence from their historical behaviors. The contributions of our model include:
- Dependency awareness: our model captures the dependency of two interpersonal influences that are sending from the same user, or received by the same user, by the shared influence or the shared susceptibility vector respectively.
- Conciseness: our model use fewer parameters, offering an advantage in modeling sparse data.
- Effectiveness: Our model achieved the best performance on real Microblog data for three prediction tasks.
- Unification of temporal and categorical information: our model applies a unified framework based on temporal model, which can make use of sentiment information easily.
Acknowledgments
This work was partially funded by National Grand Fundamental Research 973 Program of China No. 2014CB340401 and 2013CB329602, the Beijing NSF No. 4172059, the National NSF of China No. 61472400 and U1605251. The authors thank Mr. Bruce Barron's advice on writing.
@inproceedings{ijcai2017p327,
  title     = {Learning Concise Representations of Users' Influences through Online Behaviors},
  author    = {Liu, Shenghua and Zheng, Houdong and Shen, Huawei and Cheng, Xueqi and Liao, Xiangwen},
  booktitle = {Proceedings of the Twenty-Sixth International Joint Conference on
               Artificial Intelligence, {IJCAI-17}},
  publisher = {International Joint Conferences on Artificial Intelligence Organization},
  editor    = {Carles Sierra},
  pages     = {2351--2357},
  year      = {2017},
  month     = {8},
  note      = {Main track},
  doi       = {10.24963/ijcai.2017/327},
  url       = {https://doi.org/10.24963/ijcai.2017/327},
}
TY - CPAPER TI - Learning Concise Representations of Users' Influences through Online Behaviors AU - Liu, Shenghua AU - Zheng, Houdong AU - Shen, Huawei AU - Cheng, Xueqi AU - Liao, Xiangwen T2 - Proceedings of the Twenty-Sixth International Joint Conference on Artificial Intelligence, IJCAI-17 PB - International Joint Conferences on Artificial Intelligence Organization PY - 2017 SP - 2351 EP - 2357 DO - 10.24963/ijcai.2017/327 UR - https://doi.org/10.24963/ijcai.2017/327 ER -Copied
Machine-readable versions of this paper, for tools and AI agents:





