
Optimal Network Security Hardening Using Attack Graph Games
Proceedings of the Twenty-Fourth International Joint Conference on Artificial Intelligence. Main Track. Pages 526-531.
© 2015 International Joint Conferences on Artificial Intelligence
Abstract
Preventing attacks in a computer network is the core problem in network security. We introduce a new game-theoretic model of the interaction between a network administrator who uses limited resource to harden a network and an attacker who follows a multi-stage plan to attack the network. The possible plans of the attacker are compactly represented using attack graphs, while the defender adds fake targets (honeypots) to the network to deceive the attacker. The compact representation of the attacker's strategies presents a computational challenge and finding the best response of the attacker is NP-hard. We present a solution method that first translates an attack graph into an MDP and solves it using policy search with a set of pruning techniques. We present an empirical evaluation of the model and solution algorithms, evaluating scalability, the types of solutions that are generated for realistic cases, and sensitivity analysis.
- [Ammann et al., 2002] Paul Ammann, Duminda Wijesekera, and Saket Kaushik. Scalable, graph-based network vulnerability analysis. In CCS, pages 217-224, 2002.
- [Bacic et al., 2006] Eugen Bacic, Michael Froh, and Glen Hender- son. Mulval extensions for dynamic asset protection. Technical report, DTIC Document, 2006.
- [Bellman, 1956] Richard Bellman. Dynamic programming and la- grange multipliers. PNAS, 42(10):767, 1956.
- [Boddy et al., 2005] Mark S Boddy, Johnathan Gohde, Thomas Haigh, and Steven A Harp. Course of action generation for cyber security using classical planning. In ICAPS, pages 12-21, 2005.
- [Buldas and Stepanenko, 2012] Ahto Buldas and Roman Stepa- nenko. Upper bounds for adversaries' utility in attack trees. In GameSec, pages 98-117. 2012.
- [Cai et al., 2009] Jin-Yi Cai, Vinod Yegneswaran, Chris Alfeld, and Paul Barford. An attacker-defender game for honeynets. In Com- puting and Combinatorics, pages 7-16. Springer, 2009.
- [Carroll and Grosu, 2011] Thomas E Carroll and Daniel Grosu. A game theoretic investigation of deception in network security. Se- curity and Communication Networks, 4(10):1162-1172, 2011.
- [Conitzer and Sandholm, 2006] Vincent Conitzer and Tuomas Sandholm. Computing the optimal strategy to commit to. In EC, pages 82-90, 2006.
- [Greiner et al., 2006] Russell Greiner, Ryan Hayward, Magdalena Jankowska, and Michael Molloy. Finding optimal satisficing strategies for and-or trees. Artificial Intelligence, pages 19-58, 2006.
- [Grimes et al., 2005] Roger A Grimes, Alexzander Nepomnjashiy, and Jacco Tunnissen. Honeypots for windows. 2005.
- [Hoey et al., 1999] Jesse Hoey, Robert St-Aubin, Alan Hu, and Craig Boutilier. Spudd: Stochastic planning using decision di- agrams. In UAI, pages 279-288, 1999.
- [Homer et al., 2009] John Homer, Xinming Ou, and David Schmidt. A sound and practical approach to quantifying security risk in enterprise networks. Kansas State University Technical Report, pages 1-15, 2009.
- [Homer et al., 2013] John Homer, Su Zhang, Xinming Ou, David Schmidt, Yanhui Du, S Raj Rajagopalan, and Anoop Singhal. Aggregating vulnerability metrics in enterprise networks using attack graphs. Journal of Computer Security, pages 561-597, 2013.
- [Ingols et al., 2006] Kyle Ingols, Richard Lippmann, and Keith Pi- wowarski. Practical attack graph generation for network defense. In ACSAC, pages 121-130, 2006.
- [Isa et al., 2007] Jiri Isa, Viliam Lisy, Zuzana Reitermanova, and Ondrej Sykora. Unconstrained influence diagram solver: Guido. In IEEE ICTAI, pages 24-27, 2007.
- [Lisý and Píbil, 2013] Viliam Lisý and Radek Píbil. Computing op- timal attack strategies using unconstrained influence diagrams. In PAISI, pages 38-46. 2013.
- [Mell et al., 2006] Peter Mell, Karen Scarfone, and Sasha Ro- manosky. Common vulnerability scoring system. Security & Privacy, pages 85-89, 2006.
- [Noel and Jajodia, 2004] Steven Noel and Sushil Jajodia. Manag- ing attack graph complexity through visual hierarchical aggrega- tion. In Proceedings of the 2004 ACM workshop on Visualization and data mining for computer security, pages 109-118. ACM, 2004.
- [Noel and Jajodia, 2008] Steven Noel and Sushil Jajodia. Optimal ids sensor placement and alert prioritization using attack graphs. Journal of Network and Systems Management, pages 259-275, 2008.
- [Noel et al., 2010] Steven Noel, Sushil Jajodia, Lingyu Wang, and Anoop Singhal. Measuring security risk of networks using attack graphs. International Journal of Next-Generation Computing, 1(1):135-147, 2010.
- [Obes et al., 2013] Jorge Lucangeli Obes, Carlos Sarraute, and Ger- ardo Richarte. Attack planning in the real world. arXiv preprint arXiv:1306.4044, 2013.
- [Ou et al., 2005] Xinming Ou, Sudhakar Govindavajhala, and An- drew W Appel. Mulval: A logic-based network security analyzer. In USENIX Security, 2005.
- [Ou et al., 2006] Xinming Ou, Wayne F. Boyer, and Miles A. Mc- Queen. A scalable approach to attack graph generation. In CCS, pages 336-345, 2006.
- [Provos, 2004] Niels Provos. A virtual honeypot framework. In USENIX Security Symposium, volume 173, 2004.
- [Qassrawi and Hongli, 2010] Mahmoud T Qassrawi and Zhang Hongli. Deception methodology in virtual honeypots. In Net- works Security Wireless Communications and Trusted Comput- ing (NSWCTC), 2010 Second International Conference on, vol- ume 2, pages 462-467. IEEE, 2010.
- [Sawilla and Ou, 2008] Reginald E. Sawilla and Xinming Ou. Iden- tifying critical attack assets in dependency attack graphs. In Sushil Jajodia and Javier Lopez, editors, Computer Security - ESORICS 2008, volume 5283 of Lecture Notes in Computer Sci- ence, pages 18-34. Springer Berlin Heidelberg, 2008.
- [Sheyner et al., 2002] O. Sheyner, J. Haines, S. Jha, R. Lippmann, and J.M. Wing. Automated generation and analysis of attack graphs. In IEEE S&P, pages 273-284, 2002.
- [Tambe, 2011] Milind Tambe. Security and Game Theory: Algo- rithms, Deployed Systems, Lessons Learned. Cambridge Univer- sity Press, 2011.
References were extracted automatically from the PDF and may contain errors.
Full text extracted automatically from the PDF; figures, tables and equations may differ. The PDF is the version of record.
1 Introduction
Networked computer systems support a wide range of critical functions in both civilian and military domains. Securing this infrastructure is extremely costly and there is a need for new automated decision support systems that aid human network administrators to detect and prevent attacks.
We focus on network security hardening problems in which a network administrator (defender) reduces the risk of attacks on the network by introducing honeypots (fake hosts or services) into their network [Qassrawi and Hongli, 2010]. Legitimate users do not interact with honeypots; hence, honeypots act as decoys and distract attackers from the real hosts, send intrusion detection alarms to the administrator, and/or gather detailed information the attacker's activity [Provos, 2004; Grimes et al., 2005]. However, believable honeypots are costly to set up and maintain. For example, in [Carroll and Grosu, 2011; Cai et al., 2009] the authors propose a gametheoretic model that studies various camouflaging signals that honeypots can send to the attacker in order to minimize the chance of being detected. Deciding how to optimally allocate honeypots to reduce the risk of attacks on a network presents a challenging decision for the defender. On the other hand, a well-informed attacker should anticipate the use of honeypots and try to avoid them.
We use game theory to model this adversarial interaction and to determine the best way to use honeypots against a well-informed attacker. We introduce a novel game-theoretic model of network hardening using honeypots that extends the existing line of Stackelberg security games [Tambe, 2011] by combining two elements: (1) we adopt a compact representation of strategies for attacking computer networks called attack graphs, (2) the defender uses deception instead of directly allocating resources to harden targets.
Attack graphs (AGs) can represent a rich space of sequential attacker actions for compromising a specific computer network. AGs can be automatically generated based on known vulnerability databases [Ingols et al., 2006; Ou et al., 2006] and they are widely used in the network security to identify the minimal subset of vulnerabilities/sensors to be fixed/placed to prevent all known attacks [Sheyner et al., 2002; Noel and Jajodia, 2008], or to calculate security risk measures (e.g., the probability of a successful attack) [Noel et al., 2010; Homer et al., 2013]. We use AGs as a compact representation of an attack plan library, from which the rational attacker chooses the optimal contingency plan to follow. However, finding the optimal attack plan in an attack graph is an NP-hard problem [Greiner et al., 2006]. We address this issue by translating attack graphs into an MDP and introducing a collection of pruning techniques that reduce the computation considerably.
Deploying honeypots changes the structure of the network and increases uncertainty for the attacker. In this game model we assume that the attacker knows the number of deployed honeypots and their type (e.g., a database server). However, the attacker does not know which specific hosts are honeypots and which are real. While the assumption that the attacker knows the number/type of honeypots is strong, it corresponds to a worst-case, well-informed attacker. Our model could also be extended to include uncertainty about these variables, but it would further increase the computational cost of solving the model.
We present five main contributions: (1) a novel gametheoretic model of security hardening based on attack graphs, (2) algorithms for analyzing these games, including fast methods based on MDPs for solving the attacker's planning problem, (3) a case study analyzing the hardening solutions for sample networks, (4) empirical evaluation of the computational scalability and limitations of the algorithms, and (5) sensitivity analysis for the parameters used to specify the model.
2 Network Hardening Game Using Honeypots
In this section we introduce a game-theoretic model for the network hardening problem. Our model is a Stackelberg game, where the defender acts first, taking actions to harden the network by adding honeypots (HPs). The attacker is the follower that selects an optimal attack plan based on (limited) knowledge about the defender's strategy. In particular, we assume that the attacker learns the number and type of HPs added to the network, but not which specific hosts are real and fake.
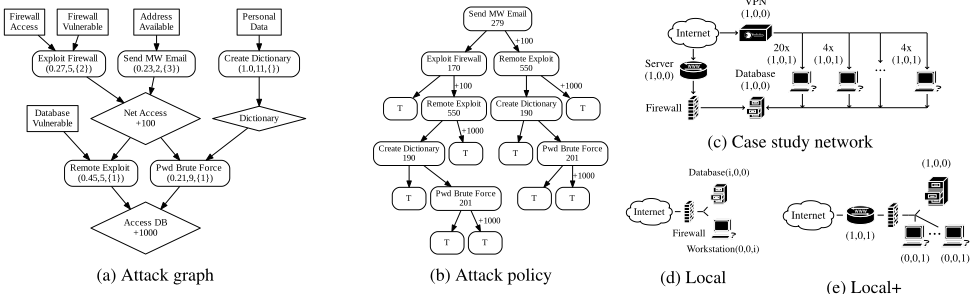
An instance of the game is based on a specific computer network like the one shown in Fig. 1c (based on [Homer et al., 2009]). A network has a set of host types T, such as firewalls, workstations, etc. Two hosts are of the same type if they run the same services and have the same connectivity in the network (i.e., a collection of identical workstations is modeled as a single type). All hosts of the same type present the same attack opportunities, so they can be represented only once in an attack graph. During an attack, a specific host of a given type is selected randomly with uniform probability.
More formally, a computer network y ∈ NT contains yt hosts of type t ∈ T. The defender can place up to k honeypots into the network y, so his actions are represented by x ∈ X ⊂ NT 0 with �t∈T xt ≤ k, specifying that xt hosts type t ∈ T will be added to the network as honeypots (e.g., by duplicating the configurations of the real hosts with obfuscated data). The modified network consists of zt = xt +yt hosts of type t. Adding more HPs of a specific type increases the likelihood that the attacker who interacts with this type of host will choose a HP instead of a real host. If the attacker interacts with a HP during an attack, he is immediately detected and the attack ends. The attacker is rational and maximizes the expected utility taking into account the probabilities of interacting with HPs, his actions' costs and success probabilities, and rewards from successful attacks. He selects his attack strategy from set X defined later. Installing and maintaining HPs has a cost for the defender depending on the host type (c(t) t ∈ T) that is duplicated. The defender minimizes his total expected loss l which consists of (1) the expected loss for the attacked hosts and (2) the cost for adding the HPs into the network. The Stackelberg equilibrium is found by selecting the pure action of the defender that minimizes the expected loss under the assumption that the attacker will respond with an optimal attack [Conitzer and Sandholm, 2006]. If the attacker is indifferent between multiple attacks, it is typical to break ties in favor of the defender [Tambe, 2011]. The defender's action is
The minimization over all defender actions is performed by systematically checking each option; however, the main computation burden of computing the optimal attack strategy is substantially reduced by caching and reusing results of subproblems that are often the same. Computation of this equilibrium relies on computing the optimal attack policy as explained in the following section.
3 Attack Graphs and Attacker's Strategies
There are multiple representations of attack graphs common in the literature. We use dependency attack graphs, which are more compact and allow more efficient analysis than the alternatives [Obes et al., 2013]. Fig. 1a is an example attack graph with high-level actions for illustration. Formally, it is a directed AND/OR graph consisting of fact nodes F (OR) and action nodes A (AND). Every action has preconditions (pre(a) ⊆ F) - a set of facts that must be true before the action can be performed - and effects (eff(a) ⊆ F) - a set of facts that become true if the action is successfully performed. These relations are represented by edges in the attack graph. We use the common monotonicity assumption [Ammann et al., 2002; Ou et al., 2006; Noel and Jajodia, 2004] that once a fact becomes true during an attack , it can never become false again as an effect of any action.
Every action has associated a probability of being performed successfully pa ∈ (0,1], and cost ca ∈ R+ that the attacker pays regardless of whether the action is successful. The costs represent the time and resources for the attacker to perform the action. Finally, every action a interacts with a set of host types ta ⊆ T . The first time the attacker interacts with a type t, a specific host of that type is selected with uniform probability. Future actions with the same host type interact with the same host. There is no reason to interact with a different host of the same type because (1) rewards are defined based on the types, so there is no additional benefit, and (2) interacting with another host increases the probability of interacting with a honeypot and ending the game. Each fact f ∈ F has associated an immediate reward r f ≥ 0 that the attacker receives when the fact becomes true (e.g., an attacker gains reward by gaining access to a particular host or compromising a specific service). At any time we allow the attacker to terminate his attack by a stop action denoted T.
An illustrative example of attack graph is depicted in Fig. 1a. Diamonds and rectangles are fact nodes that are initially false and true. Actions (rounded rectangles) are denoted with a label and a triple (pa,ca,ta). The attack proceeds in a top-down manner. At the beginning the attacker can perform actions Exploit-Firewall, Send-MW-Email or Create-Dictionary. The action Exploit-Firewall's preconditions are {Firewall-Access, Firewall-Vulnerable} and its effect is {Net-Access}. If this action is performed, the attacker immediately pays cost ca = 5, interacts with host types ta = {2}, and with probability pa = 0.27 the action's effects become true. In that case the attacker obtains reward +100.
Attack graphs can be automatically generated by various tools. We use the MulVAL [Ou et al., 2005], which constructs an attack graphs from information automatically collected by VPN
network scanning tools, such as Nessus 1 or OpenVAS 2 . Previous works (e.g., [Sawilla and Ou, 2008]) show that the information about the costs and success probabilities for different actions can be estimated using the Common Vulnerability Scoring System [Mell et al., 2006] values available in the National Vulnerability Database [Bacic et al., 2006], historical data, red team exercises, or be directly specified by the network administrator.
Optimal attack policy In order to fully characterize the attacker's reaction to the set of honeypots, we need to compute a full contingent attack policy, which defines an action for each situation that may arise during an attack. This allows identifying not only the actions likely to be executed by a rational attacker, but also the order of their execution. This is necessary to evaluate effectiveness of placing honeypots or any other intrusion detection sensors. Linear plans that may be provided by classical planners (e.g., [Obes et al., 2013; Boddy et al., 2005]) are not sufficient as they cannot represent attacker's behavior after action failures.
The attack strategies X are all contingent plans consistent with the attack graph. The optimal attack policy maximizes attacker's expected utility and in case of ties favors the defender. Fig. 1b depicts the optimal attack policy for the attack graph in Fig. 1a without any honeypots. Nodes represent suggested actions to perform with their expected rewards if strategy is followed. The first action suggested by this policy is to Send-MW-Email. If the action is successful, the attacker immediately obtains reward +100 for reaching Net-Access and follows the right (sub)policy (solid arc). If Send-MW-Email fails, attacker's best choice is to performExploit-Firewall and expect reward 170. The attack terminates (T) if there are no actions to perform or the expected rewards do not surpass the costs of the actions.
4 Solving AG usingMDP
In the Stackelberg game model we assume that the attacker observes the defender's strategy, which can be used in computing the best-response attack strategy. We represent the problem of computing the attacker's best response as a finite horizon Markov Decision Process (MDP) [Bellman, 1956]. The MDP for attack graph AG is defined as a tuple 〈B, S, P, r〉, where: (1) B = A∪{T} is the set of actions, (2) S is set of states s = (as,fs,ts), where: as ⊆ B is the set of actions that a rational attacker can still perform, fs ⊆ F is the set of achieved facts, and ts ⊆ T is the set of host types that the attacker has interacted with so far. The initial MDP state is s0 = (B, /0, /0). (3) P a ss′ ∈ (0,1] is the probability that performing action a in state s leads to state s′ . Performing action a can lead to one of three possible outcomes: either (i) a interacts with a honeypot with probability h = 1-�t:ta\t ( zt-xt zt ) and his attack immediately ends; (ii) action a does not interact with a honeypot and is successful with probability pa(1-h) or (iii) action a does not interact with a honeypot and neither is successful with probability (1- pa)(1-h).The sets defining the newly reached state are updated based on these outcomes. Finally, (4) r a ss′ is the attacker's reward for performing action a in state s leading to s′ . It is based on the set of facts that became true, the action cost ca and interaction with a honeypot.
1 http://www.nessus.org 2 http://www.openvas.org
We compute the optimal policy in this MDP using backward induction based on depth-first search, with several enhancements to speed up the search. A major performance enhancement is dynamic programming. Since the same states in the MDP can often be reached via more than one sequence of actions, we cache the expected rewards and corresponding policies of the visited states and reuse it when possible. In addition we use the following pruning techniques.
Sibling-Class Pruning
In this section we introduce the Sibling-Class Theorem (SCT) and its use to prune the search tree. This theorem states that in some cases, the optimal order for executing actions can be determined directly without search. It was proved in [Greiner et al., 2006] in the context of "probabilistic AND-OR tree resolution" (PAOTR). In [Buldas and Stepanenko, 2012], the AND part of the theorem is proven in the context of simplified attack graphs. Both works assume that actions have no preconditions, i.e., the inner nodes of the AND/OR tree represent only the conjunctions and disjunctions and do not have any costs or probabilities of success. Moreover, the theorem was proven only for the special case of trees not for directed acyclic graphs. We generalize the SCT to handle the more general case that we need for our attack graphs.
Actions a,b ∈ A belong to the same OR-sibling class iff they have the exact same effects. Actions a ⊆ A belong to the same AND-sibling class iff there is a "grandchild" action g ∈ A that can be executed iff all of the actions in a are successful and none of the actions has an effect that would help enable other actions, besides g. We define the R-ratio of actions in sibling classes as R(a) = pa ca if a belongs to an OR-sibling class; and R(a) = 1-pa ca if a belongs to an AND-sibling class.
Theorem 1 (Sibling class theorem) Let x be the optimal attack policy for the attack graph AG. Then for any actions x, y from the same sibling class, such that R(y) > R(x), x is never performed before y in x .
Intuitively, in OR-sibling class, it is reasonable to start with the high probability low cost actions. In AND-sibling class, it is reasonable to start with cheap actions that have low success probability to fail fast and avoid paying unnecessary costs. Due to limit constraints, the theorem is formally proven in the extended version of this paper. Unfortunately, actions that can interact with honeypots violate the monotonicity property assumed in the proof of SCT. These actions cannot be pruned neither preferred to other actions. Thus, we prune only actions that do not interact with honeypots, belong to exactly one sibling class and there is another action in the same sibling class with higher R-ratio.
Branch and Bound
We compute lower (LB) and upper (UB) bounds of the expected reward in each MDP state. Consequently, we use them to prune the MDP subtrees if they are provably suboptimal.
Lower bounds are computed from the values of the previously computed MDP subtrees and bound the future MDP subtrees. First, we present necessary properties of the optimal attack policy.
Proposition 1 Let x be the optimal attack policy in state s starting with action a, x+ and x- be its (sub)policies if action a succeeds or fails, respectively, and E[x ] be the value of the policy. Then, (i) E[x+]+r -ca/pa ≥E[x-], where r = �f :eff(a)\f r f is an immediate reward and (ii) E[x] ≥E[x-].
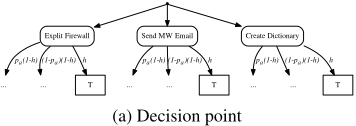
In Fig. 2a is the first decision point for the attack graph in Fig. 1a, where the attacker decides among three available actions: (Exploit-Firewall, Send-MW-Email or CreateDictionary). In every decision point of the MDP's depth-first search tree we explore each of its subtrees one by one and use maximal value M of the previous actions as a lower bound value for next action. Since every action's outcome (success or fails) is explored separately, we bound them individually. Action a's successful branch is bounded by M-r +ca/pa, which results from Prop. 1(i). Its false branch is bounded by M+ca-pa(E[a+ ]+r) 1-pa , where E[a+] is the action a's successful branch's expected reward, which results from Prop. 1(ii). Extended version of the paper contains the proof and bound derivations.
We compute the upper bound as the expected reward of the optimal policy in an attack graph relaxed in two ways. First, we ignore the action costs (ca = 0) and the probabilities of touching HPs (h = 0). This only improves the expected utility of the attack and causes the optimal strategy to always use all available actions. Therefore, we can compute the expected reward of the policy by computing the probability that each fact is achieved if the attacker attempts all actions. In order to compute this probability efficiently, we run a depth first search in the attack graph from each fact which provides a reward, traversing edges only in the opposite direction. Moreover, to avoid complications caused by cycles, we disregard edges leading to AND nodes from already traversed parts of the attack graph. Removing edges to AND nodes can always only increase the probability of reaching the reward fact.
5 Experiments
The experiments analyze the algorithm for optimal attack policy computation and evaluate game models for network hardening problems. All experiments were run on one core of Intel i7 3.5GHz processor with 10GB memory limit. Attack graphs for the experiments were generated with MulVAL [Ou et al., 2005] tool, augmented with additional cost and probability information.
Network topologies for experiments are depicted in Fig. 1c (Main-i), 1d (Local-i) and 1e (Local+i), where i is: (i) number of workstation client vulnerabilities in Local-i , (ii) number of workstations in Local+i and (iii) number of workstation groups in Main-i. Host types are labeled with (r, l,c), where r,l,c denotes the numbers of remote, local and client vulnerabilities for that type. The topology of the network and the number and type of vulnerabilities determines the number of actions in the attack graph.
5.1 Optimal Attack Planning
Pruning Techniques
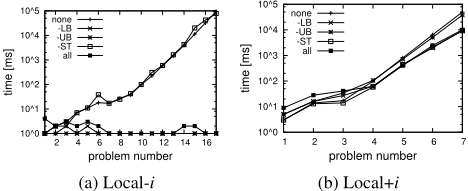
In this section we evaluate the contribution of the pruning techniques: Sibling Theorem (ST), lower bound (LB), and upper bound (UB) for the branch and bound. Since techniques may prune the same branches, we measure each technique's contribution by measuring the algorithms slowdown after disabling it. Thus, we compare 5 settings: none (no techniques is used), all (all techniques are used), -ST (all but ST), -LB (all but LB) and -UB (all but UB). Fig. 3 shows optimal attack policy computation times of networks Local-i and Loca+i using each technique setting. In Local-i network we add vulnerabilities to the workstation, creating large decision points. However, ST can effectively prune them and choose the best action (compare all to -ST). In Local+i network the branch and bound helps the most (-LB and -UB). In the remaining of experiments, we include all techniques since they do not have negative impact and can dramatically speed up the computation. We refer to the proposed attack planning algorithm as DP (dynamic-programing).
| Problem | # A | DP | UID | SPUDD |
| Local3 | 9 | <1 | <1 | <1 |
| Local11 | 25 | <1 | (OoM) | 3 |
| Local19 | 41 | <1 | (OoM) | 3348 |
| Local+3 | 16 | <1 | 71 | 1 |
| Local+6 | 28 | 3 | (OoM) | 125 |
| Local+8 | 36 | 406 | (OoM) | 1951 |
| (a) | ||||
| host | 1 | 2 | 3 | 5 |
|---|---|---|---|---|
| db | 0 | 0 | 1 | 2 |
| srv | 1 | 1 | 1 | 2 |
| vpn | 0 | 1 | 1 | 1 |
| 1grp | 0 | 0 | 0 | 0 |
| 2grp | 0 | 0 | 0 | 1 |
| (b) | ||||
Comparison with Other Algorithms
We compare DP to other two approaches that can compute the optimal policy for an attack graph. The first method converts the AG it to an Unconstrained Influence Diagram (UID) as described in [Lis´y and P´ıbil, 2013] and uses GUIDO [Isa et al., 2007] to solve it. The second approach translates AG to a probabilistic planning domain problem, which is then solved by SPUDD [Hoey et al., 1999]. It uses iterative value computation and was 3rd best planner in 2011 at the International Planning Competition (IPC) in the MDP track. We chose SPUDD because it guarantees to return an optimal contingency policy, while the first two planners from IPC do not. In Tab. 1(a) we present computation times of the algorithms. Our algorithm dramatically outperforms the other two approaches, where the hardest network Local+8 was solved 5x faster than using SPUDD planner.
5.2 Network Hardening Game Analysis
In this section we evaluate the network hardening. We focus on a typical small business network topology depicted in Fig. 1c (Main-i) and we find honeypot deployment that minimizes the defender's loss in this network. Attacker's actions costs in AG are set randomly between 1 and 100. The rewards for compromising the host types are 1000 for workstations (ws), 2000 for vpn, 2500 for server (srv) and 5000 for database (db). For simplicity, we assume that the defender values (lt ) them the same as the attacker. However, this payoff restriction is not required in our model. The defender pays chp(t) = glt for adding honeypot of type t, where g ∈ [0,1] is parameter we alter. It corresponds to the fact that more valuable hosts are generally more costly to imitate by honeypots.
Scalability Experiment
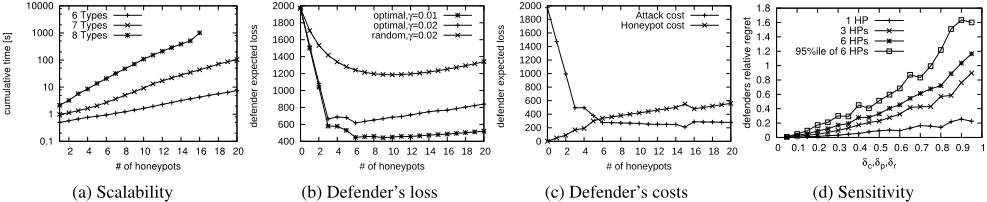
We analyze the scalability of our game model to determine the size of the networks that can reasonably be solved using our algorithms. For each network Main-i, we create a game model and find Stackelberg equilibrium. In Fig. 4a we present computation times (note log-scale y-axis) to solve networks Main-6 through Main-8 (individual plots), given the number of HPs that the defender can deploy. The algorithm scales exponentially with both parameters. However, we note that typical real-world cases will have few honeypots.
5.3 Case-Study
In this section we examine in detail the network Main-7 with g = 0.02. We analyze the defender's loss dependence on the number of honeypots and his relative regret for modeling the attack graph inaccurately (e.g., if he estimates the action costs, action probabilities or rewards incorrectly).
Defender's loss
Using a large number of HPs is not necessarily beneficial for the defender as they may cost more than they contribute to protecting the network. The defender's expected loss using different number of the HPs is shown in Fig. 4b (see "optimal, g = 0.02"), where it is optimal to deploy 6 HPs for g = 0.02 and for 9 HPs for the cheaper g = 0.01 setting. In the same figure, we also present the defender's loss for deploying random honeypots instead the optimal suggested by our model, which is roughly twice as bad. We also note how dramatically merely 3 HPs can decrease the expected loss using the game-theoretic approach.
In Fig. 4c are separate parts of the defender's loss: the expected loss for having the hosts attacked and the costs for deploying the HPs. Interestingly, with 16 HPs the defender decides to use less expensive HPs and put the network in higher risk, since this choice results in a lower overall expected loss.
In Tab. 1(b) we present the defender's optimal HP types allocations (rows) for a given total number of deployable HPs (columns). I.e., with one HP, it is best to duplicate the server (srv). The server is not the most valuable type (2500 while the database is worth 5000). However, it is a bottleneck of the network; protecting the server partially defends both the server and the database, rather than only database. With two HPs it is best to duplicate the server and VPN (again, the bottlenecks). Only with the 3rd HP does the defender duplicate the database.
Sensitivity Analysis
Computing the defender's optimal strategy heavily relies on the Attack Graph structure and knowledge of the action costs, probabilities and rewards, which the defender can only approximate in a real-world scenarios. In the following experiments we analyze the sensitivity of the defender's strategy and utility to inaccurate approximation of the attack graphs.
We use the following notation: defender's strategy ¯ d (resp. loss ¯ l ¯ d ) is computed from the attack graph known to the defender, which imprecisely approximates the attack graph truly describing attacker's behavior; d (resp. loss ld) is the optimal strategy based on the true attack graph according which the attacker really behaves; and l ¯ d is the defender's loss when strategy ¯ d is used against the real attack graph.
In the sensitivity analysis we compute the relative regret as regret = |l ¯ d - ld |/ ¯ l ¯ d , which is the defender's relative loss ratio for not knowing the attacker's real attack graph. In other words, if the defender knew the true attack graph model and acted optimally, this is how much he would gain. Thus, regret = 0 means he has no regret and regret = 1 means that his loss is by 100% greater than it could have been.
In this experiments the attack graph action probabilities and costs were chosen randomly from the intervals pa ∈ [0,1], ca ∈ [0,200] in order not to depend on the specific initial attack graph values provided by MulVAL. To generate the imprecise attack graph available to the defender, we perturbed the generated attack graph based on values (dp,dc,dr) ∈ [0,1]3 , where each value represents the limit on the size of the perturbation on action probabilities (dp), costs (dc) and fact rewards (dr). The perturbed attack graph is obtained as follows: for each action a ∈ A the perturbed probability ¯pa is chosen from an interval [pa -dp, pa +dp] restricted to [0.05,0.95] to prevent them becoming impossible ( ¯pa =0) or infallible ( ¯pa =1); perturbed cost ¯ ca is chosen from [ca(1-dc),ca(1+dc)]; and for each fact f ∈F, the perturbed fact reward is ¯ r f ∈ [r f (1-dr),r f (1+dr)], where the values are selected uniformly within the given intervals. Action probabilities are perturbed absolutely (by ±dp), but the costs and rewards are perturbed relative to their original value (by ±dcca and ±drr f ). The intuition behind this is that the higher the cost or reward values the larger the errors the defender could have made while modeling them, which cannot be assumed for probabilities.
In our experiments we perturbed the each component from 0.05 to 0.95 by 0.05 steps and measured the defender's loss. The results presented are mean values computed from 100 runs. In Fig. 4d we present the defender's relative regret for increasing error perturbations for deploying 1, 3 and 6 HPs, where we perturbed all three perturbation components. The results show the solutions are fairly robust, i.e., assuming that the defender models all components inaccurately by at most 30% (dc = dp = dr = 0.3) in scenario with 6 HPs, his HP deployment choice could have been better off by only 17%. We also examined the effect of perturbing each component individually, however, due to the space limit, we did not include figures (which are similar). Out of the three components, the defender's strategy was most sensitive to action probability perturbations, where the relative regret reaches value 0.8 for the case when dp = 0.95 for 6 HPs. The sensitivity to reward perturbations reached relative regret loss of about 0.3 for dr = 0.95. Results were least sensitive to action cost perturbations, resulting in relative regret loss below the value 0.002 even for dc = 0.95. Fig. 4d also presents the 95th percentile of the regret values for the case with 6 HPs to show the robustness in extreme cases.
Note that with an increasing number of HPs, the defender's relative regret grows (e.g., Fig. 4d), however, this can be misleading. Further data analysis revealed that the actual absolute regrets |l ¯ d -ld| for 3 HPs (318) and 6 HPs (340) are very similar. The reason why relative regret seem to grow with the increasing number of HPs is due to the decrease of the observed loss ¯ l ¯ d (denominator it relative regret formula). The observed loss ¯ l ¯ d for 3 HPs is 1994, while for 6 HPs 1049, which shows that the relative regret does not seem to depend on the number of HPs.
6 Conclusion
We introduce a game-theoretic model for the network hardening problem. The defender seeks an optimal deployment of honeypots into the network, while the attacker tries to attack the network and avoid the interaction with the honeypots. Our model provides a novel combination of using compact representation of the strategies of the attacker in the form of attack graphs, and using deception by the defender. By translating the attack graphs into MDPs and employing a number of pruning techniques, we are able to solve problems of realistic size and analyze the results for realistic case studies. Moreover, we showed that our model produces robust solutions even if the input data are imprecise.
Our work has significant potential for further research. Since the majority of the required input data can be automatically acquired by standard network scanning tools, or extracted from existing vulnerability databases, the proposed model can be deployed in real-world networks and evaluated in practice. Secondly, our model can be further extended from the game-theoretical perspective and use additional uncertainty about the knowledge of the attacker, or model multiple types of the attacker using Bayesian variants of Stackelberg games.
Acknowledgments
This research was supported by the Office of Naval Research Global (grant no. N62909-13-1-N256), the Danish National Research Foundation and the National Science Foundation of China (under the grant 61361136003) for the Sino-Danish Center for the Theory of Interactive Computation. Access to computing and storage facilities owned by parties and projects contributing to the National Grid Infrastructure MetaCentrum, provided under the programme "Projects of Large Infrastructure for Research, Development, and Innovations" (LM2010005), is greatly appreciated. Viliam Lis´y is a member of the Czech Chapter of The Honeynet Project.
@inproceedings{ijcai2015p80,
  title     = {Optimal Network Security Hardening Using Attack Graph Games},
  author    = {Durkota, Karel and Lisý, Viliam and Bošanský, Branislav and Kiekintveld, Christopher},
  booktitle = {Proceedings of the Twenty-Fourth International Joint Conference on
               Artificial Intelligence, {IJCAI-15}},
  publisher = {International Joint Conferences on Artificial Intelligence},
  editor    = {Qiang Yang and Michael Wooldridge},
  pages     = {526--531},
  year      = {2015},
  month     = {7},
  note      = {Main Track},
  url       = {https://ijcai.org/proceedings/2015/80},
}
TY - CPAPER TI - Optimal Network Security Hardening Using Attack Graph Games AU - Durkota, Karel AU - Lisý, Viliam AU - Bošanský, Branislav AU - Kiekintveld, Christopher T2 - Proceedings of the Twenty-Fourth International Joint Conference on Artificial Intelligence, IJCAI-15 PB - International Joint Conferences on Artificial Intelligence PY - 2015 SP - 526 EP - 531 UR - https://ijcai.org/proceedings/2015/80 ER -Copied
Machine-readable versions of this paper, for tools and AI agents:





