
Multi-view Self-Paced Learning for Clustering
Proceedings of the Twenty-Fourth International Joint Conference on Artificial Intelligence. Special Track on Machine Learning. Pages 3974-3979.
© 2015 International Joint Conferences on Artificial Intelligence
Abstract
Exploiting the information from multiple views can improve clustering accuracy. However, most existing multi-view clustering algorithms are non-convex and are thus prone to becoming stuck into bad local minima, especially when there are outliers and missing data. To overcome this problem, we present a new multi-view self-paced learning (MSPL) algorithm for clustering, that learns the multi-view model by not only progressing from 'easy' to 'complex' examples, but also from 'easy' to 'complex' views. Instead of binarily separating the examples or views into 'easy' and 'complex', we design a novel probabilistic smoothed weighting scheme. Employing multiple views for clustering and defining complexity across both examples and views are shown theoretically to be beneficial to optimal clustering. Experimental results on toy and real-world data demonstrate the efficacy of the proposed algorithm.
- [Cai et al., 2013] Xiao Cai, Feiping Nie, and Heng Huang. Multi- view k-means clustering on big data. In IJCAI, pages 2598-2604. AAAI Press, 2013.
- [Chaudhuri et al., 2009] Kamalika Chaudhuri, Sham M Kakade, Karen Livescu, and Karthik Sridharan. Multi-view clustering via canonical correlation analysis. In ICML, pages 129-136. ACM, 2009.
- [Dalal and Triggs, 2005] Navneet Dalal and Bill Triggs. His- tograms of oriented gradients for human detection. In CVPR, volume 1, pages 886-893, 2005.
- [Dalal et al., 2006] Navneet Dalal, Bill Triggs, and Cordelia Schmid. Human detection using oriented histograms of flow and appearance. In ECCV, pages 428-441. Springer, 2006.
- [de Sa, 2005] Virginia R de Sa. Spectral clustering with two views. In ICML workshop on learning with multiple views, pages 20-27, 2005.
- [Ding and He, 2004] Chris Ding and Xiaofeng He. K-means clus- tering via principal component analysis. In ICML, page 29. ACM, 2004.
- [Ding et al., 2005] Chris HQ Ding, Xiaofeng He, and Horst D Si- mon. On the equivalence of nonnegative matrix factorization and spectral clustering. In SDM, volume 5, pages 606-610. SIAM, 2005.
- [Guo, 2013] Yuhong Guo. Convex subspace representation learn- ing from multi-view data. In AAAI, volume 1, page 2, 2013.
- [Kumar et al., 2010] M Pawan Kumar, Benjamin Packer, and Daphne Koller. Self-paced learning for latent variable models. In NIPS, pages 1189-1197, 2010.
- [Kumar et al., 2011a] Abhishek Kumar, Piyush Rai, and Hal Daume. Co-regularized multi-view spectral clustering. In NIPS, pages 1413-1421, 2011.
- [Kumar et al., 2011b] M Pawan Kumar, Haithem Turki, Dan Pre- ston, and Daphne Koller. Learning specific-class segmentation from diverse data. In ICCV, pages 1800-1807. IEEE, 2011.
- [Laptev et al., 2008] Ivan Laptev, Marcin Marszalek, Cordelia Schmid, and Benjamin Rozenfeld. Learning realistic human ac- tions from movies. In CVPR, pages 1-8, 2008.
- [Liu et al., 2013] Jialu Liu, Chi Wang, Jing Gao, and Jiawei Han. Multi-view clustering via joint nonnegative matrix factorization. In SDM, volume 13, pages 252-260. SIAM, 2013.
- [Meilȃ, 2006] Marina Meilȃ. The uniqueness of a good optimum for k-means. In ICML, pages 625-632. ACM, 2006.
- [Meilȃ, 2012] Marina Meilȃ. Local equivalences of distances be- tween clusteringsa geometric perspective. Machine Learning, 86(3):369-389, 2012.
- [Nguyen et al., 2013] Cam-Tu Nguyen, De-Chuan Zhan, and Zhi- Hua Zhou. Multi-modal image annotation with multi-instance multi-label lda. In IJCAI, pages 1558-1564. AAAI Press, 2013. IJCAI
- [Oliva and Torralba, 2001] Aude Oliva and Antonio Torralba. Mod- eling the shape of the scene: A holistic representation of the spatial envelope. International journal of computer vision, 42(3):145-175, 2001.
- [Tang et al., 2012] Kevin Tang, Vignesh Ramanathan, Li Fei-Fei, and Daphne Koller. Shifting weights: Adapting object detectors from image to video. In NIPS, pages 638-646, 2012.
- [Wu and Rehg, 2008] Jianixn Wu and James M Rehg. Where am i: Place instance and category recognition using spatial pact. In CVPR, pages 1-8, 2008.
- [Xie and Xing, 2013] Pengtao Xie and Eric P Xing. Multi-modal distance metric learning. In IJCAI, pages 1806-1812. AAAI Press, 2013. IJCAI
- [Xu et al., 2013] Chang Xu, Dacheng Tao, and Chao Xu. A survey on multi-view learning. arXiv preprint arXiv:1304.5634, 2013.
- [Xu et al., 2014] Chang Xu, Dacheng Tao, and Chao Xu. Large- margin multi-view information bottleneck. IEEE Trans. Pattern Analysis and Machine Intelligence, 36(8):1559-1572, 2014.
- [Xu et al., 2015] Chang Xu, Dacheng Tao, and Chao Xu. Multi- view intact space learning. IEEE Trans. Pattern Analysis and Machine Intelligence, 2015.
- [Zhao et al., 2015] Qian Zhao, Deyu Meng, Lu Jiang, Qi Xie, Zongben Xu, and Alexander G Hauptmann. Self-paced learning for matrix factorization. In AAAI, 2015.
- [Zhou and Burges, 2007] Dengyong Zhou and Christopher JC Burges. Spectral clustering and transductive learning with multi- ple views. In ICML, pages 1159-1166. ACM, 2007.
References were extracted automatically from the PDF and may contain errors.
Full text extracted automatically from the PDF; figures, tables and equations may differ. The PDF is the version of record.
1 Introduction
Data collected from diverse sources or extracted from different feature extractors have heterogeneous features in many real-world applications [Xu et al., 2013]. For example, when classifying webpages, a webpage can be described by its content, the text of webpages linking to it, and the link structure of linked pages [Xu et al., 2014]. Several different descriptors have been proposed to enhance action recognition performance, each of which describes certain aspects of object action [Xu et al., 2015]. In particular, histograms of oriented gradients (HOG) [Dalal and Triggs, 2005] focus on static appearance information, histograms of optical flow (HOF) [Laptev et al., 2008] capture absolute motion information, and motion boundary histograms (MBH) [Dalal et al., 2006] encode related motion between pixels. Since these heterogeneous features have distinct physical meanings and represent objects from different perspectives, they can naturally be regarded as multiple data views [Nguyen et al., 2013; Xie and Xing, 2013].
Clustering aims to find meaningful groups of examples in an unsupervised manner for exploratory data analysis. Independently employing each view makes clustering inaccurate, since each individual view does not comprehensively describe all the examples. Therefore, it is beneficial to use multiple views and exploit their connections to improve clustering. This approach has given the rise to the field of multiview clustering.
A number of promising multi-view clustering algorithms have been developed. [de Sa, 2005; Zhou and Burges, 2007; Kumar et al., 2011a] fuse similarity measurements from diverse views to construct a graph for multi-view examples, which successfully extends conventional single-view spectral clustering methods to the multi-view setting. [Chaudhuri et al., 2009; Liu et al., 2013; Cai et al., 2013] project multiple views into a shared latent subspace, in which the conventional single-view clustering algorithms can then be used to discover clusters.
Most existing multi-view clustering methods aim to solve non-convex objective functions. These can result in the solutions stuck in bad local minima, especially in the presence of noise and outliers. A heuristic method to alleviate this problem is to launch the algorithm multiple times with different initializations and then choose the best solution. However, this strategy is time consuming and generally difficult to implement in the unsupervised setting, since there is no explicit criterion for model selection.
By simulating human learning, self-paced learning [Kumar et al., 2010] first attempts to train a model on 'easy' examples and then gradually take 'complex' examples into consideration. This has been shown to be beneficial in avoiding bad local minima and improving the generalization result [Kumar et al., 2011b; Tang et al., 2012; Zhao et al., 2015]. As well as the complexities of examples in each individual view, multiview examples might also have 'easy' and 'complex' views, and the distinction between 'easy' and 'complex' views might be different for distinct multi-view examples. For example, GIST features [Oliva and Torralba, 2001] achieve high accuracy when used to recognize natural scene images, while CENTRIST features [Wu and Rehg, 2008] are good at classifying indoor environment images.
In this paper, we propose Multi-view Self-Paced Learning (MSPL) for clustering, which learns multi-view models by considering the complexities of both examples and views. Instead of hard treating examples or views as 'easy' or 'complex', we design a smoothed weighting scheme that inherits the merits of logistic function and provides probabilistic weights. The resulting objective function is solved by a simple yet effective method. Using multiple views for clustering and the easy-to-complex strategy are proven theoretically to be beneficial for approximating the ideal clustering result. Experimental results on toy and real-world data demonstrate the effectiveness of the algorithm in distinguishing complexities across examples and views to improve clustering performance.
2 ProblemFormulation
As a classical algorithm, k-means clustering uses k prototype vectors (i.e., centers or centroids of k clusters) to characterize the data and minimize a sum of squared loss function to find these prototypes using a coordinate descent optimization method. It has been shown that non-negative matrix factorization is equivalent to relaxed k-means [Ding et al., 2005]. Given n examples X = [x1, · · · , xn] ∈ RD×n , the k-means clustering objective can be reformulated as
where C = [c1, · · · , ck] ∈ RD×k is the centroid matrix with ci as the cluster centroid of the i-th cluster, and B = [b1, · · · , bn] ∈ Rk×n denotes clustering assignment. If the jth example is assigned to the i-th cluster, Bij = 1; otherwise Bij = 0.
The original k-means clustering method only works for single-view data. The obvious route to adapting single-view clustering algorithms to the multi-view setting is to concatenate the features of multiple views into a long feature vector. Since multiple views have distinct physical meanings and describe the objects from different perspectives, treating these views equally without in-depth analysis usually fails to produce the optimal result. Therefore, it is necessary to exploit the connections between multiple views to improve clustering performance.
2.1 Multi-view Self-Paced Learning
Let Xv ∈ RDv×n and C v ∈ RDv×k denote the features and centroid matrix of the v-th view, respectively. In multi-view clustering, the clustering results of different views should be consistent; that is, given different centroid matrices, the clustering assignments of m views should be the same. Hence, Eq. (1) can be extended to handle multi-view examples:
where B is the assignment matrix shared by m views.
Neither the single-view formulation Eq. (1) nor the multiview formulation Eq. (2) is a convex problem, and thus they both have the risk of getting stuck in bad local minima during optimization. Recently, self-paced learning has been used to alleviate this problem. The general self-paced learning model is composed of a weighted loss term on all examples and a regularizer term imposed on example weights. By gradually increasing the penalty on the regularizer during model optimization, more examples are automatically included in training from 'easy' to 'complex' via a pure self-paced approach. The distinction between 'easy' and 'complex' not only exists across examples but also across views. Since multiple views have distinct physical meanings and describe examples from different perspectives, a multi-view example can naturally be more easily distinguished in one view than in the other views. By simultaneously considering the complexities of both examples and views, we develop multi-view self-paced learning for clustering:
where wv = [wv 1 , · · · ,wvn ] is composed of the weights of n examples in the v-th view, W = [w1 ; · · · ;wm], and f(W) denotes the regularizer determining the examples and views to be selected during training. The previously adopted f(W) in [Kumar et al., 2010] was simply
which indicates that the optimal weight for the i-th example in the v-th view is
where ℓvi stands for the reconstruction error of the i-th example in the v-th view. Taking 1λ as the threshold, 'easy' examples (views) have losses less than the threshold, while the losses of 'complex' examples (views) are greater than the threshold. The parameter λ controls the pace at which the model learns new examples (views), and it is usually iteratively decreased during optimization.
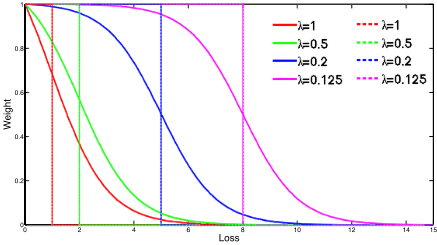
Note that the classical regularizer (i.e., Eq. (4)) hard selects examples (views) by assigning them binary weights, as shown in Figure 1. Since noise is usually non-homogeneously distributed in the data, it is unreasonable to absolutely assert that one example (view) is easy or complex. As demonstrated in many real-world applications, soft weighting is more effective than the hard weighting and can faithfully reflect the true importance of examples (views) during training. Hence, instead of hard weighting, we propose a new regularizer for self-paced learning:
data25
data26
data27
data28
data29
data30
data31
data32
data33
data34
data35
data36
data37
data38
data39
data40
data41
data42
data43
data44
data45
data46
h=1
h=0.5
h=0.2
h=0.125
Figure 1: Comparison of the regularizers for self-paced learning. Solid curves correspond to smoothed weighting (i.e., Eq. (8)), while dashed curves correspond to hard weighting (i.e., Eq. (5)).
The optimal weight of the i-th example in the v-th view can be solved using
by setting the gradient with respect to wvi to zero,
Compared to Eq. (5), Eq. (8) is a smoothed function related to ℓvi, and its function curves under different λ's are presented in Figure 1. It is instructive to note that function (8) can be regarded as an adapted logistic function, which is a well-known loss function in machine learning. Hence, Eq. (8) can inherit all the merits of logistic function, which is infinitely many times differentiable, strictly convex, and Lipschitz continuous. Most importantly, Eq. (8) provides a probabilistic interpretation of the weights, because given different inputs it always outputs values between zero and one. Instead of hard separating the examples and views into 'easy' and 'complex' as in Eq. (5), Eq. (8) tends to assign examples and views the probabilities of being 'easy'. Different from 1λ in Eq. (5), which determines whether w∗ vi = 1 or w∗ vi = 0 , 1λ in Eq. (8) influences the speed of change of the weight with regard to the loss. It can be seen that when the loss is less than 1λ , the examples and views can be implicitly treated as 'easy' since as their weights vary slowly with respect to the corresponding loss; otherwise, they are 'complex' in line with the fast variation of the weight with respect to the loss. Furthermore, as 1λ increase, more examples and views are likely to be included to train a mature model.
By combining Eqs. (3) and (6), we obtain the resulting objective function. In optimizing the proposed model, we probabilistically measure the complexity of examples and views and then gradually train the multi-view clustering model from 'easy' to 'complex' to prevent falling into bad local minima.
3 Optimization
We solve the optimization problem in an alternating fashion. Under fixed centroid matrices {C v }mv=1 and assignment matrix B, W can be optimized by
By adopting the regularizer f(W) as in Eq. (6), we find that the optimal W can naturally satisfy the constraint that wv ∈ [0, 1]n , ∀v ∈ [1,m]. According to the discussion in Section 2.1, the optimal solution W ∗ can be written out in a closed form as in Eq. (8).
If we focus on centroid matrix C v in the v-th view and keep the other centroid matrices, assignment matrix, and weight matrix fixed, we obtain the following sub-problem:
where W v = diag(√wv ). Taking the derivative of J with respect to C v , we obtain
Setting Eq. (11) as zero, we can update C v through
When we fix all the centroid matrices on different views and the weights, the original problem is reduced to
Since each entry of B is a binary integer and each column vector must only have a non-zero entry, it is difficult to optimize matrix B as a whole. We solve this problem by decoupling the data and assigning the cluster centroid for them sequentially and independently. For the i-th example, we need to solve
where bi is the i-th column vector of matrix B and records the clustering assignment of the i-th example. Given the fact that there are k candidates as the solution of Eq. (14), each of which is the column of matrix Ik = [e1, · · · , ek], we can perform an exhaustive search to obtain the solution of Eq. (14) as b∗i = ej, where j is decided as:
Given the above optimization scheme over each objective variable, we alternatively update {C v }mv=1 , B, and W and repeat the process iteratively until the objective function converges.
4 Theoretical Analysis
In this section, we analyze the advantages of multi-view clustering and the influence of self-paced learning on clustering performance. Since the weights of all examples and views will eventually be assigned 1's during training, we first analyze the resulting clustering performance without weights for simplicity, and then discuss the influence of self-paced learning on training.
Starting from Eq. (1), it is easy to note that the clusters' centroids are given by the averaged vectors of examples falling into them. The rows of B are mutually orthogonal vectors. We normalize these row vectors to length 1 and denote the newmatrix ˜ B. The distortion of multi-view clustering can thus be written as
Since the last cluster can be determined by the other (k - 1) clusters, we can uniquely represent ˜ B by matrix Y with (k - 1) orthogonal rows,
where V is a k × k orthogonal matrix with its last row as v-1 = [√ n1 n , · · · , √ nk n ], and 1 denotes the row vector of all 1's. D( ˜ B) can thus be reformulated in terms of Y
where we assume that the input data are centered at the origin, i.e., Xv 1T = 0. According to [Ding and He, 2004], the lower bound of D(Y ) is
where σv 1 , · · · , σv k are the top (k-1) principal eigenvalues of (Xv )T Xv .
We first attempt to bound the difference between D(Y ) and D∗ . Assume that U v t ∈ R(k-1)×n and U v r ∈ R(n-k+1)×n are composed of the top (k - 1) principal eigenvectors and the remaining (n - k + 1) principal eigenvectors of (Xv )T Xv in the v-the view, respectively. [U v t ;U v r ] can be regarded as the orthogonal basis in the v-th view in space Rn . Y can thus be represented by the bases in different views in distinct formulations:
where Ev t ∈ R(k-1)×(k-1) and Ev r ∈ R(k-1)×(n-k+1) are the coefficients corresponding to U v t and U v r in the v-th view, respectively. To better represent the dataset using k clusters, Y should be constructed using the top (k-1) principal eigenvectors in each view as much as possible; that is, the smaller {‖Ev r ‖F }mv=1 , the better the clustering. The following lemma provides a bound on {Ev r }mv=1 .
Lemma 1. By factorizing the clustering Y in the v-th view, we have
Proof. Denoting Dv(Y ) and D∗ v as the real and ideal distortion in the v-th view, respectively, we have
and Eq. (22) can be relaxed to
When α approaches σv k-1 , we obtain
Given σv k-1 - σv k ̸= 0, we obtain the desired result.
In general, D∗ cannot be achieved since it is usually impossible to make Y simultaneously consistent with the subspaces spanned by the top (k - 1) principal eigenvectors of {(Xv )T Xv }mv=1 in multiple views. Denoting Y opt as the clustering in multiple views with the smallest distortion, we then note that D∗ ≤ D(Y opt ) ≤ D(Y ). Given two clusterings ˜ B and ˜ B′ , it is easy to show that the confusion matrix is M = ˜ B( ˜ B′ )T . For a stable evaluation of clustering performance, the misclassification error (see e.g., [Meil˘a, 2012]) is computed by
whose connection with φ( ˜ B, ˜ B′ ) = ‖ ˜ B( ˜ B′ )T ‖2F is established in [Meil˘a, 2012]. The difference between ˜ B and ˜ Bopt can be bounded by the following theorem.
Theorem 1. Let ˜ B be the multi-view clustering result. Given pmin = mini ni/n and pmax = maxi ni/n, if δv ≤ k-1 2 and minv ϵ(δv) ≤ pmin, we have
where
Proof. Startingwith Eq. (17), we denote Vt as the first (k-1) rows of V , and formulate ˜ B as
Since (Xv )T Xv 1T = 0, 1 should be orthogonal with U v t , and thus 1 √n 1 can be constructed from U v r as 1 √n 1 = e1U v r .
Based on Eq. (20), we factorize Y in the v-th view, and thus Eq. (28) can be rewritten as
Similarly, for a second clustering ˜ B′ , we have
Considering different factorizations of ˜ B and ˜ B′ in multiple views, we employ Lemma 2 in [Meil˘a, 2006] to show that
where
and δv, δ′v ≤ k2 (see Lemma 1). Since Eq. (31) is applicable to multiple views, we obtain
[Meil˘a, 2012] establishes the connections between φ( ˜ B, ˜ B′ ) and ME( ˜ B, ˜ B′ ). Given pmin = mini ni/n and pmax = maxi ni/n, if φ( ˜ B, ˜ B′ ) ≥ k - ϵ and ϵ ≤ pmin then ME( ˜ B, ˜ B′ ) ≤ ϵpmax. Considering D(Y opt ) ≤ D(Y ), we summarize the above results to obtain
According to Theorem 1, the misclassification error is determined by the smallest δv among {δv}mv=1 in multiple views. In practice, although some views might be interrupted with noise and cannot produce satisfactory clusters, the overall clustering performance can be preserved by other more accurate views, due to the complementarity of multiple views. Moreover, the misclassification error is implicitly connected to the distortion function during training (see Lemma 1). By appropriately assigning larger weights to 'easy' examples and views, the distortion could be reduced and clustering performance could be improved.
5 Experiments
In this section, we evaluate MSPL on synthetic and real-word datasets. The proposed algorithm is compared to the canonical correlation analysis (CCA), centroid multi-view spectral method (CentroidSC) [Kumar et al., 2011a], pairwise multiview spectral clustering [Kumar et al., 2011a], subspacebased multi-view clustering (ConvexSub) [Guo, 2013], and robust multi-view k-means clustering (RMKMC) [Cai et al., 2013]. The clustering performance is measured using three standard evaluation matrices: clustering accuracy (ACC), normalized mutual information (NMI) and purity. Similar to k-means, we used the clustering solution on a small randomly sampled dataset for initialization. The initial λ is set such that more than half of examples (views) are selected, and then it is iteratively decreased.
| Methods | NMI | ACC | Purity |
|---|---|---|---|
| FOU | 0.547±0.028 | 0.556±0.062 | 0.579±0.048 |
| FAC | 0.679±0.032 | 0.707±0.065 | 0.737±0.051 |
| KAR | 0.666±0.030 | 0.689±0.051 | 0.714±0.044 |
| MOR | 0.643±0.034 | 0.614±0.058 | 0.642±0.050 |
| PIX | 0.703±0.040 | 0.694±0.067 | 0.723±0.059 |
| ZER | 0.512±0.025 | 0.534±0.052 | 0.568±0.043 |
| Con-MC | 0.739±0.039 | 0.728±0.067 | 0.760±0.059 |
| RMKMC | 0.807±0.033 | 0.788±0.075 | 0.824±0.052 |
| MSPL | 0.868 ±0.020 | 0.874 ±0.055 | 0.875 ±0.033 |
5.1 Toy Example
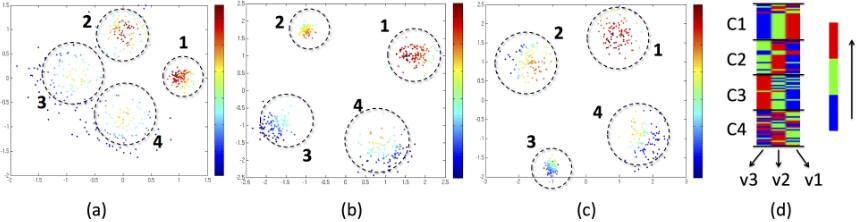
We first conduct a toy experiment using synthetic data to show our algorithm's ability to progressing from 'easy' to 'complex' examples and views in multi-view learning. The toy dataset is composed of 400 data points, each of which is described using 3 views, as shown in Figures 2 (a)-(c). The multi-view examples can be grouped into 4 clusters. The data points in each cluster on one view are sampled from a Gaussian distribution with the distinct center and variance.
We conduct multi-view clustering using the proposed MSPL algorithm with the smoothed weighting scheme on the toy dataset. If the weight wvi for the i-th example on the v-th view is near 1, we consider that the example on that view has been added for model training. The sequential orders of the examples selected during training on each view are recorded by colors. The darker color implies that the example is easier and thus is selected earlier. From Figures 2 (a)-(c), it can be found that the data points next to the cluster centers can be regarded as 'easy' examples and selected with high priorities, compared with those far away from their corresponding cluster centers. It is instructive to note that the greater variance of the clusters, the more complex the clustering. We record the sequential orders of the views selected for each example using the colors as well, and present the result in Figure 2 (d). From this figure, we find that the examples in the 1st cluster tend to select view-1 first, and then view-2 and view-3. This is because that the easiest view of 1st cluster is view-1, whose variance is smaller than those of view-2 and view-3. Similar conclusions can be derived for the 2nd and 3rd clusters. Since the variances of the 4th cluster in three views are similar, there is no explicit preference.
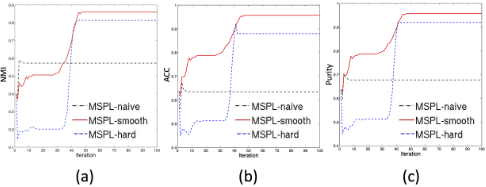
For the data matrix on each view, 80% of the entries are added to Gaussian noise, while the remaining entries are added to uniform noise. Denote the MSPL algorithm with classical hard weighting (i.e., Eq. (4)) as MSPL-hard, and that with proposed smoothed weighting (i.e., Eq. (6)) as MSPL-smooth. We compare these two weighting schemes on the toy noisy dataset. As an in-depth analysis on the behavior of the regularizers, we plot the curves of NMI, ACC and Purity with respect to iterations using hard and smoothed weighting schemes in Figure 3. For easy comparison, we also report the performance of multi-view clustering without selfpaced learning (denotedMSPL-naive), as shown in Eq. (2). It can be seen that both regularizers can eventually discover better clusterings than that of MSPL-naive. Compared with the MSPL-hard that is seriously perturbed in the first few iterations, the smoothed weighting delivers more accurate results, thus demonstrating the stability of smoothed weighting. For the advantages of smoothed weighting, we mainly focus on the evaluations on MSPL-smooth in what follows.
| Datasets | Con-MC | CCA | PairwiseSC | CentroidSC | ConvexSub | MSPL |
|---|---|---|---|---|---|---|
| Cornell | 0.094±0.003 | 0.090±0.003 | 0.112±0.002 | 0.104±0.002 | 0.233±0.001 | 0.215±0.002 |
| Texas | 0.143±0.005 | 0.120±0.002 | 0.179±0.002 | 0.169±0.002 | 0.245±0.004 | 0.255±0.003 |
| Washington | 0.159±0.007 | 0.223±0.003 | 0.212±0.002 | 0.185±0.002 | 0.251±0.004 | 0.281±0.005 |
| Wisconsin | 0.090±0.002 | 0.092±0.002 | 0.098±0.001 | 0.108±0.002 | 0.303±0.003 | 0.337±0.002 |
| Methods | NMI | ACC | Purity |
|---|---|---|---|
| CH | 0.077±0.003 | 0.067±0.002 | 0.087±0.002 |
| LSS | 0.081±0.005 | 0.071±0.002 | 0.088±0.002 |
| PHOG | 0.069±0.003 | 0.069±0.004 | 0.082±0.004 |
| ColorSIFT | 0.086±0.004 | 0.072±0.003 | 0.088±0.003 |
| SIFT | 0.094±0.005 | 0.073±0.003 | 0.091±0.004 |
| SURF | 0.088±0.003 | 0.076±0.003 | 0.097±0.004 |
| Con-MC | 0.107±0.003 | 0.080±0.001 | 0.100±0.001 |
| RMKMC | 0.117±0.005 | 0.094±0.005 | 0.114±0.005 |
| MSPL | 0.132 ±0.002 | 0.115 ±0.003 | 0.126 ±0.002 |
5.2 Multi-viewClustering Comparisons
We first evaluate the advantages of multi-view clustering over single-view clustering on the Handwritten Numerals and Animal with attribute datasets. The Handwritten Numerals dataset is composed of 2000 examples from 0 to 9 ten-digit classes. Six kinds of features are used to represent each example; that is, Fourier coefficients of the character shapes (FOU), profile correlations (FAC), KarhunenLove coefficients (KAR), pixel averages in 2 × 3 windows (PIX), Zernike moment (ZER), and morphological features (MOR). The Animal with attribute dataset contains 30475 examples from 50 classes and described by six features: Color Histogram (CH), Local Self-Similarity (LSS), PyramidHOG (PHOG), SIFT, colorSIFT, and SURF.
The clustering results on the Handwritten Numerals and Animal with attribute datasets are presented in Tables 1 and 2, respectively. In Con-MC, the features are concatenated on all views and then standard k-means clustering is applied. It can be seen that employing multiple views leads to improved clustering performance than using each view independently, demonstrating the benefits of integrating the information from different views. Moreover, all the multi-view clustering algorithms are better than the single-view clustering, and MSPL's clustering is even better than those of multi-view algorithms Con-MC and RMKMC. This is because that ConMC neglects the connections between different views while concatenating them for clustering, and RMKMC is likely to fall into a bad local minima due to its non-convex objective function.
We next compare different multi-view clustering algorithms on the WekKB dataset, which contains webpages collected from four universities: Cornell, Texas, Washington and Wisconsin. The webpages are distributed over five classes: student, project, course, staff, and faculty. 'Content' and 'link' are two views that describe each webpage.
The clustering performance in terms of NMI is reported in Table 3. Specifically, on the Washington dataset, the NMI of MSPL improves about 26% over that of CCA and 51%
over that of CentroidSC. The performance of MSPL is similar to that of ConvexSub, which is an elaborately designed convex algorithm that discovers the subspace shared by multiple views. It is instructive to note that MSPL decreases the risk of falling into bad local minima by carefully conducting clustering starting from 'easy' to 'complex' examples and views. On the other hand, ConvexSub separates the multi-view clustering task into two steps: learning the subspace shared by different views and launching k-means in this subspace. Together, this two-step approach carries a risk of bad local minima when clustering.
6 Conclusion
In this paper, we propose multi-view self-paced learning for clustering, which could overcome the drawback of bad local minima during optimization inherent in most existing nonconvex multi-view clustering algorithms. Inspired by selfpaced learning, the multi-view clustering model is trained starting from 'easy' to 'complex' examples and views. A smoothed weighting scheme provides a probabilistic interpretation of the weights of examples and views. The advantages of using multiple views for clustering and the influence of self-paced learning on clustering performance are analyzed theoretically. Experimental results on toy and realworld datasets demonstrate the advantages of the smoothed weighting scheme and the effectiveness of progressing from 'easy' to 'complex' examples and views when clustering.
Acknowledgments
The work was supported in part by Australian Research Council Projects FT-130101457, DP-140102164 and LP140100569, NSFC 61375026, 2015BAF15B00 and JCYJ 20120614152136201.
@inproceedings{ijcai2015p558,
  title     = {Multi-view Self-Paced Learning for Clustering},
  author    = {Xu, Chang and Tao, Dacheng and Xu, Chao},
  booktitle = {Proceedings of the Twenty-Fourth International Joint Conference on
               Artificial Intelligence, {IJCAI-15}},
  publisher = {International Joint Conferences on Artificial Intelligence},
  editor    = {Qiang Yang and Michael Wooldridge},
  pages     = {3974--3979},
  year      = {2015},
  month     = {7},
  note      = {Special Track on Machine Learning},
  url       = {https://ijcai.org/proceedings/2015/558},
}
TY - CPAPER TI - Multi-view Self-Paced Learning for Clustering AU - Xu, Chang AU - Tao, Dacheng AU - Xu, Chao T2 - Proceedings of the Twenty-Fourth International Joint Conference on Artificial Intelligence, IJCAI-15 PB - International Joint Conferences on Artificial Intelligence PY - 2015 SP - 3974 EP - 3979 UR - https://ijcai.org/proceedings/2015/558 ER -Copied
Machine-readable versions of this paper, for tools and AI agents:





