
Buried Utility Pipeline Mapping Based on Multiple Spatial Data Sources: A Bayesian Data Fusion Approach
Proceedings of the Twenty-Second International Joint Conference on Artificial Intelligence. Pages 2411-2416.
https://doi.org/10.5591/978-1-57735-516-8/IJCAI11-402
© 2011 International Joint Conferences on Artificial Intelligence
Abstract
Statutory records of underground utility apparatus (such as pipes andcables) are notoriously inaccurate, so street surveys are usually undertakenbefore road excavation takes place to minimize the extent and duration ofexcavation and for health and safety reasons. This involves the use ofsensors such as Ground Penetrating Radar (GPR). The GPR scans are thenmanually interpreted and combined with the expectations from the utilityrecords and other data such as surveyed manholes. The task is complex owingto the difficulty in interpreting the sensor data, and the spatialcomplexity and extent of under street assets. We explore the application ofAI techniques, in particular Bayesian data fusion (BDF), to automaticallygenerate maps of buried apparatus. Hypotheses about the spatial location anddirection of buried assets are extracted by identifying hyperbolae in theGPR scans. The spatial location of surveyed manholes provides further inputto the algorithm, as well as the prior expectations from the statutoryrecords. These three data sources are used to produce the most probable mapof the buried assets. Experimental results on real and simulated data setsare presented.
- [Ahmed and Campbell, 2010] N. Ahmed and M. Campbell. Variational Bayesian data fusion of multi-class discrete ob- servations with applications to cooperative human-robot estimation. In 2010 IEEE International Conference on Robotics and Automation, pages 186-191, 2010.
- [Burtwell et al., 2004] M. Burtwell, E. Faragher, D. Neville, C. Overton, CDF Rogers, and T. Woodward. Locating underground plant and equipment: Proposals for a re- search programme. UK Water Industry Research Report 03/WM/12/4, 2004.
- [Chen and Cohn, 2010a] H. Chen and A. G. Cohn. Buried utility pipeline mapping based on street survey and ground penetrating radar. In European Conference on Artificial Intelligence, pages 987-988, 2010.
- [Chen and Cohn, 2010b] H. Chen and A. G. Cohn. Prob- abilistic robust hyperbola mixture model for interpreting ground penetrating radar data. In IEEE World Congress on Computational Intelligence, pages 3367-3374, 2010.
- [Cremer et al., 2001] F. Cremer, K. Schutte, J. G. M. Schave- maker, and E. den Breejen. A comparison of decision-level sensor-fusion methods for anti-personnel landmine detec- tion. Information Fusion, 2(3):187-208, 2001.
- [Dell'Acqua et al., 2004] A. Dell'Acqua, A. Sarti, S. Tubaro, and L. Zanzi. Detection of linear objects in GPR data. Signal Processing, 84(4):785-799, 2004.
- [Durrant-Whyte and Bailey, 2006] H. Durrant-Whyte and T. Bailey. Simultaneous localization and mapping: part i. IEEE Robotics & Automation Mag., 13(2):99-110, 2006.
- [Giannopoulos, 2005] A. Giannopoulos. Modelling ground penetrating radar by GprMax. Construction and Building Materials, 19(10):755-762, 2005.
- [Jones et al., 2003] G. D. Jones, R. E. Allsop, and J. H. Gilby. Bayesian analysis for fusion of data from disparate imaging systems for surveillance. Image and Vision Com- puting, 21(10):843-849, 2003.
- [Neira and Tardós, 2001] J. Neira and J.D. Tardós. Data as- sociation in stochastic mapping using the joint compatibil- ity test. IEEE Transactions on Robotics and Automation, 17(6):890-897, 2001.
- [Royal et al., 2011] A. Royal, P. Atkins, M. Brennan, D. Chapman, H. Chen, A. Cohn, K. Foo, K. Goddard, R. Hayes, T. Hao, P. Lewin, N. Metje, J. Muggleton, A. Naji, G. Orlando, S. Pennock, M. Redfern, A. Saul, S. Swingler, P. Wang, and C.D.F. Rogers. Site assessment of multiple sensor approaches for buried utility detection. International Journal of Geophysics, 2011, (to appear).
- [Simone et al., 2002] G. Simone, A. Farina, F. C. Morabito, S. B. Serpico, and L. Bruzzone. Image fusion tech- niques for remote sensing applications. Information Fu- sion, 3(1):3-15, 2002.
- [Windsor et al., 2005] C. G. Windsor, L. Capineri, and P. Falorni. The estimation of buried pipe diameters by generalized hough transform of radar data. In Proceed- ings Progress In Electromagnetics Research Symposium (PIERS), pages 22-26, 2005.
References were extracted automatically from the PDF and may contain errors.
Full text extracted automatically from the PDF; figures, tables and equations may differ. The PDF is the version of record.
1 Introduction
Spatial information is ubiquitous and of vital importance for any agent operating in the physical (and many virtual worlds). The quantity and availability of spatial data is increasing dramatically, for example through the use of GPS-enabled mobile devices, sensors of all kinds, and the prevalence of GIS systems. However, owing to different provenances and methods of collection, spatial data relating to the same location may not be easy to integrate. Frequently spatial information concerning the same objects is available from multiple sources, but the data may conflict. This might be for many reasons, including varying granularity or accuracy of the information source, because of the use of relative mapping, or because of data ageing. In this paper, we explore one particular instance of this generic problem, but one which has great practical impact across the urbanised world.
Anthony Cohn G.
School of Computing University of Leeds Leeds, United Kingdom A.G.Cohn@leeds.ac.uk
Under the streets of most countries in the world, in particular industrialised ones, are millions of kilometres of buried utility assets: cable TV, telecommunication cables, gas (service pipes 1 and/or mains), electricity (ducts and cables), water mains and service pipes, and sewers. Maintaining and upgrading these networks are major undertakings, and as many are buried beneath roads and pavements, repairs and improvements are a major source of disruption to traffic.
In order to avoid unnecessary holes dug in wrong places and to minimize accidental strikes, it is normally required that information about buried utilities must be obtained before excavation occurs. However, the mapping information supplied by utilities is often of limited use, for many reasons, but particularly since they are notoriously spatially inaccurate, particularly for older assets [Burtwell et al., 2004]. Thus, street surveys are usually conducted before excavation takes place to minimize the extent and duration of excavation and for health and safety reasons. These surveys use sensors such as Ground Penetrating Radar (GPR). The GPR scans are then manually interpreted and combined with the expectations from the utility records and other data such as surveyed manholes. The task is complicated due to the difficulty in interpreting the sensor data, and the spatial complexity and extent of under street assets.
This paper proposes embedding AI into a surveying device by using a Bayesian data fusion (BDF) algorithm to automatically generate maps of buried utility apparatus by combining the hypotheses extracted from the sensor(s), the spatial location of surveyed manholes, as well as the expectations from the statutory records. In this paper we use GPR as the sole sensor, so hypotheses about the spatial location of buried assets are generated from GPR scans using a hyperbolae identification algorithm in the GPR "B-scans" - each such hyperbola may represent a "point identification" of a utility asset. To detect the direction of the buried pipes (and also to provide confirming evidence of their existence), several GPR scans are normally performed in parallel lines in close proximity and an estimation of the direction of a linear asset such as a pipe may be formed.
1 In this paper we use the word "pipe" generically to refer to buried underground apparatus such as pipes, cables, telecom conduits and sewers, which are generally laid in linear sections (though often not completely in a straight line as they may be bent as they are laid to follow a curve in the road, or because they were buried using "trenchless technology", in which the tunneling apparatus rarely follows a completely straight line).
2 Background
This paper investigates an algorithm for utility pipeline mapping by combining GPR scans, the spatial location of surveyed manholes and the statutory records. This algorithm relies on GPR data interpretation and BDF algorithms.
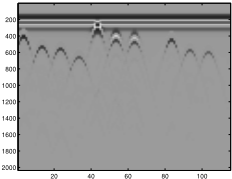
GPR has been widely used as a non-destructive tool for the investigation of the shallow subsurface, and is particularly useful in the detection and mapping of subsurface utilities and other solid objects [Dell'Acqua et al., 2004]. Typically, two patterns, hyperbolic curves and linear segments (see Fig. 4(a)), are observed in GPR images: the hyperbolic curves are due to objects with cross-section size of the order of the radar pulse wavelength; the linear segments stem from planar interfaces between layers with different electrical impedances. There are several approaches dealing with the automatic detection of patterns associated with buried objects in GPR data. Hough transform [Windsor et al., 2005] based methods are a typical technique. However, this method often needs to run hundreds of Hough transforms with different combinations of hyperbola parameters (a, b) to search the best fit hyperbola shape and this usually cannot be deployed in real-time applications. Another problem with this kind of algorithm is how to specify a suitable threshold for the number of votes to determine the number of hyperbolae in the image.
In [Chen and Cohn, 2010b] a swift and robust probabilistic mixture model based on a classification expectation maximization algorithm and orthogonal distance fitting was proposed for hyperbola identification to address these problems. We employ this improved algorithm to investigate GPR data interpretation based on sets of consecutively scanned GPR data in a particular neighbourhood.
Data fusion is a technique to combine information coming from multiple sources in order to achieve improved accuracy and better inferences than by means of a single source. In general, fusion of multiple sources of information provides significant advantages over single source data. There are many applications of data fusion in surveillance systems [Jones et al., 2003], robotics [Cremer et al., 2001] and classification of remote sensing images [Simone et al., 2002]. Although Bayesian methods [Ahmed and Campbell, 2010] have been widely used for data fusing, there has been little work to utilize this framework in the spatial prediction area, and in particular for buried utility mapping problems.
In [Chen and Cohn, 2010a], we used GPR data and manhole observations (without statutory records, pipe linearity assumption and data fusion) for utility detection. Joint Compatibility Branch and Bound (JCBB) [Neira and Tard´os, 2001] was proposed to connect the utility pipes. This paper uses the same JCBB algorithm to generate an initial map. Then, we use BDF to update the map and the uncertainty by fusing several data sources, i.e. GPR, manhole observations, statutory records and the pipe linearity assumption.
3 Utility Pipeline Mapping Based on Bayesian Data Fusion
In this section, we present a utility pipeline mapping algorithm based on Bayesian data fusion (BDF), which includes relevant aspects of GPR data processing, and the BDF.
3.1 GPRData Analysis and Spatial Direction Estimation
GPR has been widely used in the detection and mapping of subsurface utilities and other solid objects [Dell'Acqua et al., 2004]. In practical operation, it is better to operate the GPR perpendicular to the pipes, since this will generate the characteristic hyperbolae (see Fig. 4.a). However, it will be difficult to satisfy this requirement for every scan in practice, especially when the scan is conducted off the road 2 .
In order to solve this problem, GPR operators make several scans in sequence (our GPR data consists of six scans in each position) forming a square 3 . We can then estimate the direction of the buried pipes from these GPR scans. [Chen and Cohn, 2010a] illustrate the most common three situations, i.e. the scan direction is perpendicular to, parallel to and at any other angle to, the pipe, when operating the GPR machine; we use this approach to determine the position of hyperbola automatically and thus to determine the approximate direction of a pipe segment.
3.2 Bayesian Data Fusion with Sensor Data
In practice, third-party utility maps are usually produced based on street survey, GPR scans and statutory records. Surveyors will investigate the on-site street furniture, such as manholes, for useful information about the buried assets: the absolute position of these manholes can be recorded, and, by lifting the inspection cover, it is usually possible to estimate the direction of pipes as they leave the chamber. However, this information is insufficient on its own for producing the utility pipeline maps. For example, it is difficult to know whether one pipe will extend beyond an intersection with another pipe (of the same asset type). In this case, GPR and statutory records will be employed to verify these hypotheses. BDF uses the following three kinds of data:
- Prior: statutory records. The BDF algorithm is applied at a set of "interesting" points and at each point (x, y), the information is extracted from statutory records. Since statutory records are inaccurate, local search near (x, y) is employed to find matching pipes. Denote a matching pipe as V =(x, y, θ)T . Uncertainty is represented by a matrix Cv, where θ is the direction of a pipe passing point (x, y), Cv = diag(Δx, Δy, Δθ) is the diagonal matrix where Δx, Δy and Δθ are the uncertainty variables.
2 Utility map records, which although notoriously inaccurate, at least in the UK, generally give the rough direction of the line of the buried apparatus (which is typically along the line of the road).
3 Note that it is normally considered to expensive (in operator time) to conduct a GPR survey of the entire area to be surveyed. Thus these small scale scans are made successively, sampling the area until sufficient confidence is gained that all apparatus has been detected.
- Hypotheses extracted from GPR scans and observations from manhole locations. Each observed pipe can be represented by a vector O = (x, y, θ)T and the uncertainty is represented by a matrix Co 4 .
- Pipe linearity assumption L. This is an indirect data source based on the observations of other pipe locations. Since most pipes are approximately linear, this variable provides evidence as to whether to connect pipes segments detected by GPR scans or manhole inspections.
In the Bayesian formation, suppose there is a variable of interest t = (x, y, θ) at a location (x, y), where θ is the direction of a pipe. In this study, the prior comes from statutory records V. The secondary information consists of a GPR scan or manhole survey 5 O at (x, y), and a linear assumption of pipes, L. This data at (x, y) is related to the variable of interest t through error terms Eo and El.
The BDF framework seeks the posterior probability p(t|O, L), given the information O, L at location (x, y). According to the Bayesian theorem for the posterior:
The prior p(t) can be inferred from the statutory records, which we assume follows a Gaussian distribution with mean V and covarianceCv, i.e.
Under the assumption of mutual independence of these data sources conditionally to the variable t,
Thus, the posterior probability is characterised by the following proportionality:
which shows that the posterior probability density function (pdf) p(t|O, L) can be written as a function of the prior p(t) and the conditional pdf.
Since the spatial error terms Eo and El represent an independent noise process, and it is reasonable to assume that p(O | t) and p(L | t) followmean-zero Gaussian distribution with covariance matrixes Co and Cl, i.e.
4 Note that the uncertainty of GPR Co,g is larger than the uncertainty of manhole observation Co,m as manhole investigation is generally more reliable than GPR scans.
5 It is unnecessary to conduct GPR scans on the manhole locations as manholes usually deliver more reliable results. Therefore, GPR scans and a manhole survey will not occur at the same location (at least for the same asset type).
then the posterior p(t|O,L) is also a Gaussian N(m,C). The posterior mean m and covariance matrix C can be obtained by the following equations:
These two equations indicate the Bayesian fusion rule is a weighted average of these three predictions. The weights are determined by the confidence value. The more the confidence, the larger the weights.
3.3 Data Preparation for Bayesian Data Fusion Pipe linearity Assumption by Joint Compatibility Branch and Bound
To use the pipe linearity assumption, we need to connect GPR and manhole survey to generate an initial map. This is similar to the spatial data association problem in robotics [DurrantWhyte and Bailey, 2006]. In this paper, the data association to be made is the connection of the observed manhole and GPR detection, i.e. determining the pipes among the observed information from manholes and GPR data analysis.
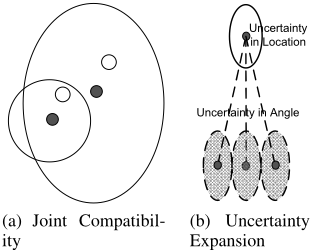
Joint Compatibility Branch and Bound (JCBB) is proposed to search for the possible pipes linking manholes and GPR scan points. JCBB looks for a set of correspondences between the measurements (GPR detections) and ending points (manholes) which are jointly consistent, and it measures the joint compatibility of a set of pairings that successfully rejects spurious matchings, and is hence known to be more robust in complex environments [Neira and Tard´os, 2001]. The mechanics of JCBB is illustrated in Fig. 1(a), where there are two GPR detections and two ending points denoting manholes, and the error of these two pairings are correlated.
After JCBB generates possible connections, each pipe will be regressed from the starting point to a possible ending point. The uncertainty of the starting point will also be regressed, yielding an ending point area. As Fig. 1(b) shows, the final uncertainty consists of location uncertainty and the angle uncertainty. If there is more than one pipe (in the initial map) going through the point of interest, the regressed pipe with minimal Mahalanobis distance between the regressed pipe and the pipe of interest at point (x, y) will be selected. The selected regressed pipe represents the pipe linearity assumption data L.
Statutory Records as Prior
Statutory records of underground utility apparatus are inaccurate 6 and incomplete. However, statutory records are our prior information for the mapping (at the least they usually give a reasonable indication of the minimum number of pipes in the ground). We employ information extracted from statutory records information for a prior in BDF algorithm.
Given a point of interest (PoI) (x, y), i.e. where a GPR detection has been found, we search the pipes in nearby locations (the extent is determined by accuracy and variance of the statutory records, which is specified manually) in the statutory records. The matching pipes are only accepted when their difference is less than a validation gate 7 . Denote each matched pipe as V = (x, y, θ). For unmatched pipes there is no record of the pipe in the statutory record and thus no statutory record V for the prior.
3.4 AlgorithmDescription
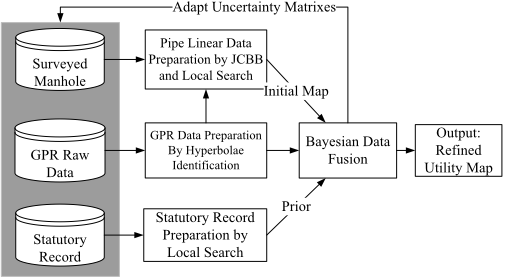
Based on the previous description, the algorithm can be summarised in Fig. 2. Note that the output of BDF is the posterior of the spatial location and direction of the pipes.
A verification method is employed to refine the map. The nearest neighbour standard filter (NNSF) [Chen and Cohn, 2010a] is used to verify the initial connection at each PoI. NNSF calculates the Mahalanobis distance between the regressed pipe and the posterior pipe, and accepts the initial connection when the distance is smaller than a validation gate (we use the same parameter in Section 3.3). Otherwise, NNSF rejects the initial connection, searches for another connection, reruns the BDF algorithm and conducts the verification again. If the refined connection does not pass the verification, the system does not use this connection.
6 This inaccuracy arises for many reasons, including changing survey techniques over the years, discrepancies arising from relative recording and manual digitisation.
7 The validation gate is obtained from the inverse cumulative distribution at a significance level (typical values are 0.95 or 0.99). We use 0.99 as the significance level.
Initially, the uncertainty matrixes for these three kinds of data are specified manually. When BDF obtains the posterior of the pipe location and direction at each PoI, these uncertainty matrixes will be updated by using the mean of the current uncertainty with the estimated uncertainty, i.e. the difference between posterior and the observed data.
4 Experimental Study
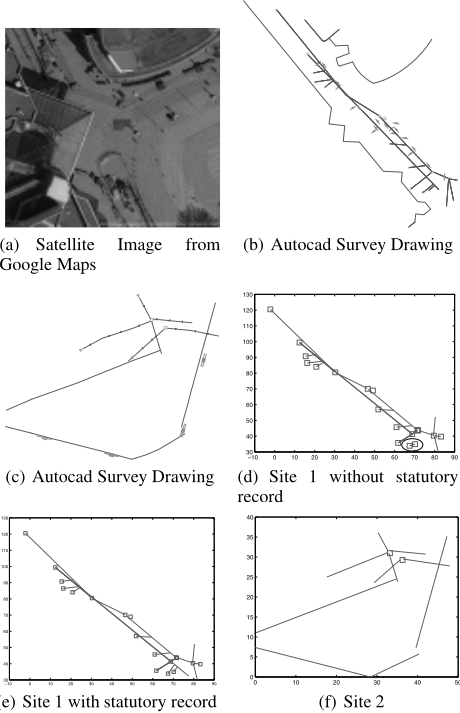
In order to evaluate the proposed algorithm, this section applies our algorithm to two real-world data sets and several simulated data sets. A summary of these data sets are reported in Table 1. Each real-world data set consists of an AutoCAD drawing representing the ground truth 8 , simulated statutory records that are generated by adding Gaussian spatial noise 9 , sets of GPR point scans and the manhole survey results. Each GPR scanning area consists of six pushes in a three metres neighbourhood area. The GPR is pushed forward three metres in each scan. The GPR scan boxes (the small boxes with a line going through the box) are also illustrated in Fig. 3(b) and 3(c). The line going through the box indicates the direction of GPR scan (i.e. the scan starts from the side of the box closest to this line) and the GPR operates orthogonally to this line. Each simulated dataset consists of a specification of underground pipeline networks, the statutory records, where the Gaussian spatial noise is added to the ground truth, sets of simulated GPR point scans and surveyed manholes. The GPR simulator GprMax [Giannopoulos, 2005] is used to generate a GPR response given an underground pipe specification in the simulated data sets.
8 Determining the actual ground truth would involve excavation. In lieu of this we used the drawings made by a professional survey company from a detailed in-street survey. (The GPR scans we use come from this company.)
| Data | Area (m×m) | # Pipe segments | # Manhole | #Scans |
|---|---|---|---|---|
| R1 | 100×100 | 19 | 18 | 23 |
| R2 | 100×100 | 10 | 2 | 26 |
| S1 | 100×100 | 22 | 7 | 36 |
| S2 | 100×100 | 38 | 10 | 54 |
| S3 | 100×100 | 44 | 18 | 76 |
| S4 | 100×100 | 61 | 21 | 93 |
In the experiments, the uncertainty for the manhole location was chosen as 0.2 metres and the uncertainty for the GPR point scan location as 0.4 metres. The uncertainty of pipe directions is fixed to 8 degrees for manhole observations, i.e. the uncertainty covariance matrix for manhole observation Co = diag(0.2, 0.2, 8), and the uncertainty is fixed at 10 degrees for GPR scans if we can successfully identify the pipe direction. However, if some of the six scans are inconsistent with the model, the uncertainty is increased to 15 degrees. This situation often occurs when GPR machines scan inappropriate surfaces, e.g. very moist soil or metal manhole covers, or part of the scans is limited by surface objects. The uncertainty for the statutory records Cv is specified as Cv = diag(1, 1, 8). The uncertainty matrix for the pipe linearity assumption is chosen as Cl = diag(1.5, 1.5, 15). Although the uncertainty is specified manually initially, the BDF algorithm will use its outputs to adapt the uncertainty matrix Co, Cv and Cl as described in Section 3.4. Therefore, the initial setting of uncertainty is not critical for convergence.
Fig. 3(a) shows a bird's eye view of one survey site representing the real world data, which is from a city centre area in the UK. Fig. 3(b) and 3(c) provide the AutoCAD drawings of the survey sites, from which we introduce Gaussian spatial noise to generate statutory records (not shown). Fig. 3(e) depicts the map obtained using BDF for this site, whilst Fig. 3(d) shows the effect of not using statutory records. Fig 3(c) shows the survey drawing for a second site, and Fig. 3(f) shows the map obtained by combining all three data sources for the second site.
9 The variance for this noise is 1 × 1 metre for spatial pipe locations and 8 degrees for pipe directions, i.e. the covariance matrix for statutory records Cv = diag(1, 1, 8). This is the same as simulated data. Note this process may introduce connection errors as well, e.g. it might merge two nearby manholes or two nearby parallel pipes.
| #error | BDF | BDF\V | BDF\L | BDF\GPR | JCBB(O) | V | Time(s) |
|---|---|---|---|---|---|---|---|
| R1 | 0 | 2 | 1 | 3 | 5 | 1 | 6.6 |
| R2 | 0 | 0 | 0 | 0 | 0 | 0 | 2.9 |
| S1 | 0 | 3 | 2 | 5 | 5 | 2 | 9.3 |
| S2 | 1 | 2 | 1 | 4 | 3 | 2 | 10.2 |
| S3 | 1 | 1 | 1 | 6 | 4 | 1 | 13.7 |
| S4 | 2 | 4 | 3 | 8 | 6 | 3 | 14.6 |
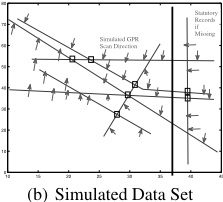
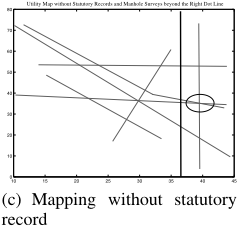
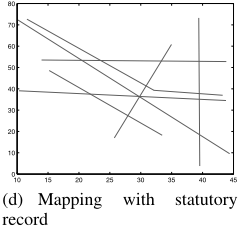
Fig. 4(b) shows a simulated dataset, where the arrows indicates the position and direction of simulated GPR scans. In Fig. 4(c), we manually remove 10 the "statutory record" to the right of the dotted line, and the result (Fig. 4(c)) shows that BDF makes an incorrect connection by treating two nearby manholes as one. However, the BDF with full data sources can successfully reconstruct the map (Fig. 4(d)). If the statutory records are incomplete, it might lead to connection errors without sufficient GPR/manhole data in a relatively complicated pipeline layout. However, if there is enough other data in the incomplete area, it might reduce the connection errors. This is one of the benefits of using the Bayesian data fusion algorithm. Spatial noise could lead to either spatial inaccuracy (minor) or connection errors (major problems). For spatial inaccuracy, the BDF algorithm can use other data to minimise the inaccuracy. The data fusion algorithm can reduce the number of connection errors arising from spatial noise (given sufficient data/observations from relatively noise-free data sources).
Table 2 reports a series of experiments on two real-world data sets (R1 and R2) and four simulated data sets (S1S4). We not only show the BDF on all data sources, i.e. V+O+L, but also report the performance of BDF without statutory records (BDF\V), BDF without pipe linearity assumption (BDF \L), BDF without GPR scans (BDF\GPR), and the performance of JCBB on only GPR/manhole survey (JCBB(O)). The table only reports the connection errors (not spatial inaccuracy), e.g. treating two nearbymanholes as one, or missing a connection between two manhole. The connection errors with respect to V are introduced by adding spatial noise, e.g. the new record with spatial noise might merge nearby manholes or nearby parallel pipes.
Table 3 reports the spatial inaccuracy E(x, θ) and the uncertainty C(x, θ) on these six data sets by using BDF,
10 It is not uncommon that real statutory records have missing information.
(a) Simulated GPR Result
| spatial error | BDF | BDF\V | BDF\L | BDF\GPR | JCBB(O) | V |
| E(x, θ)R1 | 0.3,3.3 | 0.5,7.2 | 0.4,4.7 | 0.7,5.8 | 0.7,9.4 | 0.8,6.5 |
| C(x, θ)R1 | 0.2,3.6 | 0.3,6.5 | 0.2,4.5 | 0.4,4.6 | 0.3,10.8 | 1,8 |
| E(x, θ)R2 | 0.4,2.8 | 0.4,6.3 | 0.4,4.1 | 0.9,5.4 | 0.8,10.1 | 0.6,6.1 |
| C(x, θ)R2 | 0.2,3.8 | 0.3,7.3 | 0.3,4.9 | 0.6,5.9 | 0.4,12.6 | 1,8 |
| E(x, θ)S1 | 0.3,3.1 | 0.5,7.9 | 0.3,5.0 | 0.9,8.6 | 0.8,10.6 | 0.7,6.9 |
| C(x, θ)S1 | 0.2,3.8 | 0.3,7.1 | 0.3,4.8 | 0.5,7.3 | 0.4,12.2 | 1,8 |
| E(x, θ)S2 | 0.3,3.4 | 0.5,7.9 | 0.5,5.1 | 0.9,9.3 | 0.8,10.7 | 0.7,7.1 |
| C(x, θ)S2 | 0.2,3.8 | 0.3,7.1 | 0.3,4.8 | 0.5,7.6 | 0.4,12.2 | 1,8 |
| E(x, θ)S3 | 0.4,3.6 | 0.8,8.4 | 0.5,5.3 | 0.9,10.2 | 0.9,11.2 | 0.8,7.2 |
| C(x, θ)S3 | 0.2,3.8 | 0.3,7.1 | 0.3,4.8 | 0.6,8.9 | 0.4,12.0 | 1,8 |
| E(x, θ)S4 | 0.4,3.8 | 0.9,8.6 | 0.5,5.6 | 1.0,11.1 | 0.9,11.5 | 0.8,6.8 |
| C(x, θ)S4 | 0.2,3.8 | 0.3,7.1 | 0.3,4.8 | 0.5,8.1 | 0.4,12.1 | 1,8 |
BDF without statutory records (BDF\V), BDF without pipe linearity assumption (BDF \L), BDF without GPR (BDF\GPR), and JCBB on only GPR/manhole survey (JCBB(O)).
According to Tables 2 and 3, BDF with full data sources outperforms other algorithms, while JCBB with only GPR/manhole survey is the worst algorithm. BDF\V is equal or inferior to BDF\L, indicating the statutory records usually contain more information, if presented, than the pipe linearity assumption. In general it is very unlikely that only using observations of street furniture (such as manholes) and statutory records will give good results (some buried utilities may well have no such street furniture in the surveyed area). Therefore, BDF\GPR generates inferior performance than BDF with all data sources. It is also worth noting that although for R2 no algorithmmakes any connection errors, the spatial inaccuracy reported in Table 3 shows that this is at minimum for the full BDF algorithm. All these results confirm the benefits of inclusion of more data sources and the effectiveness of the BDF algorithm in utility mapping.
The computation time of the BDF algorithm is reported in Table 2. The times are recorded on a 2.4Ghz laptop with 4GB memory on a single core. Clearly the algorithm can operate in real time as data is gathered (given the push speed of the GPR).
4.1 Analysis of the AI Subsystem
The overall system includes the operator for GPR machine with global positioning system (GPS) for location identification, a surveyor for manhole locations, a GPR machine, statutory records, and the AI subsystem. The task of the AI subsystem is to fuse these results together and automatically generate a buried utility map. The experiments have confirmed the potential effectiveness of the overall systems including the AI subsystem.
The AI subsystem is important in the functionality of the overall system because it provides an automatic and effective way for on-site work to produce a buried utility map. In current practice, the utility map is usually manually produced in the back office (or possibly in a specially adapted mobile office) using AutoCAD or similar software. Surveying is expensive, and any reduction in the time taken will be beneficial. It takes typically takes a three person surveying team a full day to map 150 linear metres over a typical 10m wide highway in a non city centre position with no traffic management issues or other restrictions. Much of the time is not spent in physically obtaining the data but rather in processing and connecting it - exactly the topic of our automated algorithm.
The inclusion of an AI subsystem to the overall system greatly reduces the effort required (and thus the cost of a survey). The AI subsystem effectively fuses GPR data, manhole surveys, statutory records and the linear assumptions of pipes and has the potential to generate possibly better drawings than manual production. Although manual production is based on the same data as the algorithm here, the automated system has the capacity for greater consistency, and evaluating all the possibilities, as well as requiring less skilled operators. Moreover, the AI subsystem not only gives the prediction of the utility map, but also gives the confidence of the prediction. Therefore, the performance of the overall system can be further improved by verifying the locations with low confidence value - i.e. since the system can deliver real-time mapping, there is the possibility to dynamically direct the operator to areas which would most improve the confidence level.
It should be noted that the algorithms used to infer the hyperbolae in the GPR scans are also AI-based techniques - thus the overall system combines several AI subsystems as illustrated in Fig. 2.
5 Conclusion
Previous approaches to produce buried utility pipeline maps depend on manual drawing and expert advice for GPR scans. These approaches are costly in terms of time and human labour. In this paper, we aim to address this problem.
In order to estimate the direction of buried pipes, we employ a recently proposed algorithm to automatically identify reflection radar hyperbolae in GPR scan data and thus extract the hypotheses, i.e. pipe segment positions and direction.
JCBB methods are then employed for an initial connection to facilitate the deployment of the pipe linearity assumption in data generation. Local search in the statutory records is conducted to account for the inaccuracy in these records.
After this data preparation phase, we propose a Bayesian data fusion algorithm for automatic utility mapping. Three kinds of data sources, i.e. manhole/GPR surveys, statutory records and pipe linear assumption, are combined in the BDF algorithm. The uncertainty of the location and direction of pipes are both considered in the algorithm.
The proposed algorithm contributes to an important practical application by largely automating the process of generating survey utility map combining sensor data, street observations and expectations from statutory records from all the asset holders. Given the extent of invasive streetworks in most countries, this has considerable potential for extensive application. It also illustrates an interesting variant of the classical robot SLAM problem.
At present the system operates off-line as a research prototype, but the goal is on-board operation, giving real-time mapping, and also the possibility of directing the operator to take further readings in the area of most uncertainty. Future work will also consider incorporating other sensors such as sonar and EM sensors [Royal et al., 2011].
Acknowledgments
This research is supported by an EPSRC grant (EP/F06585X/1): Mapping The Underworld: Multisensor Device Creation, Assessment, Protocols (http://www.mappingtheunderworld.ac.uk/).
@inproceedings{ijcai2011p402,
  title     = {Buried Utility Pipeline Mapping Based on Multiple Spatial Data Sources: A Bayesian Data Fusion Approach},
  author    = {Chen, Huanhuan and Cohn, Anthony G.},
  booktitle = {Proceedings of the Twenty-Second International Joint Conference on
               Artificial Intelligence, {IJCAI-11}},
  publisher = {AAAI Press/International Joint Conferences on Artificial Intelligence},
  editor    = {Toby Walsh},
  pages     = {2411--2416},
  year      = {2011},
  month     = {7},
  doi       = {10.5591/978-1-57735-516-8/IJCAI11-402},
  url       = {https://doi.org/10.5591/978-1-57735-516-8/IJCAI11-402},
}
TY - CPAPER TI - Buried Utility Pipeline Mapping Based on Multiple Spatial Data Sources: A Bayesian Data Fusion Approach AU - Chen, Huanhuan AU - Cohn, Anthony G. T2 - Proceedings of the Twenty-Second International Joint Conference on Artificial Intelligence, IJCAI-11 PB - AAAI Press/International Joint Conferences on Artificial Intelligence PY - 2011 SP - 2411 EP - 2416 DO - 10.5591/978-1-57735-516-8/IJCAI11-402 UR - https://doi.org/10.5591/978-1-57735-516-8/IJCAI11-402 ER -Copied
Machine-readable versions of this paper, for tools and AI agents:





