
3-D Interpretation of Single Line Drawings
Proceedings of the Nineteenth International Joint Conference on Artificial Intelligence. Pages 1738-1738.
© 2005 International Joint Conferences on Artificial Intelligence
Abstract
The human visual system can interpret two dimensional (2-D) line drawings like the Necker cube as three dimensional (3-D) wire frames. We focus attention on a principle to minimize the entropy of angle distribution between line segments in a 3-D wire frame as a concrete definition of the law of pragnanz in Gestalt Psychology. And we implement the principle with the perceptual preference of planarity to the loops of wire frames using a genetic algorithm. Experimental results show the good coincidence with human perception.
- [Ono et. al., 1998] Isao Ono, Yoshihiro Tatsuzawa and Shi- genobu Kobayashi. Evolutionary design of lens system, In Proceedings of the 3rd International Symposium on Artificial Life and Robotics, pages 81-84, Beppu, Japan, Jan 1998.
- [Shoji et. al., 2001] Kenji Shoji, Kazunori Kato, and Fubito Toyama. 3-D Interpretation of Single Line Drawings Based on Entropy Minimization Principle, In 2001 IEEE Conference on Computer Vision and Pattern Recognition, volume 2, pages 90-95, Kauai, USA, Dec 2001.
References were extracted automatically from the PDF and may contain errors.
Full text extracted automatically from the PDF; figures, tables and equations may differ. The PDF is the version of record.
1 Introduction
Line drawings are more often used in documents which illustrate the functions and shapes of products, buildings, and so on rather than the photo-realistic images of them created by computer graphics, because line drawings are more suitable to convey the shapes of 3-D objects than the photo-realistic images.
Single line drawings have many possibilities in 3-D interpretation, that is, there are infinite 3-D shapes which produce a same line drawing. Human vision selects one or two of them based on some internal criteria. Previously, Shoji et. al. [2001] proposed a principle to minimize the entropy of angle distribution (MEAD) between line segments in a 3-D wire frame as a concrete definition of the law of pragnanz in Gestalt Psychology. The MEAD principle seems to be appropriate, but the results of their simulation are not sufficient to support the principle.
In this work, we focus attention on the MEAD principle and other perceptual tendencies. And we propose a 3-D interpretation model based on the MEAD principle and the perceptual preference of planarity to the loops of wire frames. In the implementation of the model for simulation we use a genetic algorithm (GA) based on the minimal generation gap (MGG) model as a generation alternation model and the unimodal normal distribution crossover (UNDX) as a crossover [Ono et. al., 1998].
2 Definition of Problem
Line drawings as the input of a simulation program are represented by the x and y coordinates of vertices and the pairs of vertex numbers which are corresponding to the both ends of line segments. For example, the line drawing in figura 1 (a) is represented by the list of x-y coordinates of vertices #0 to #3 and the list of pairs of vertex numbers such as (#0, #1), (#1, #2), (#2, #0), (#0, #3), and so on. We suppose the type of projection to be approximately orthographic. Then, the task of the simulation program is to estimate the z coordinate of each vertex. Estimated z coordinates and given x and y coordinates produce a 3-D wire frame object. Figura 1 (b) shows the x-y-z coordinate system, an input line drawing, and an estimated 3-D object (a wire frame).
z
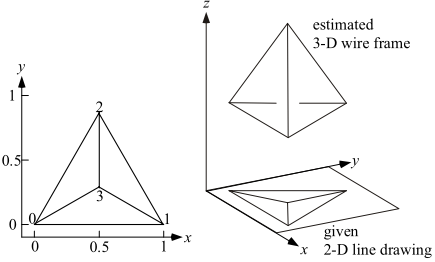
- (a) An example of line drawing. 0 to 3 are vertex numbers.
(b) Relationship between a given
2-D line drawing and an esti-
mated 3-D wire frame.
Figure 1: A given 2-D line drawing and an estimated 3-D wire frame.
3 Model and its implementation
A proposed model for 3-D interpretation is to search an optimal solution that maximizes the weighted sum F of evaluation values Fe and Fp based on the MEAD principle and the perceptual preference of planarity to the loops of wire frames, respectively. That is,
where wp is a weight and its value was 0.5 in simulation.
3.1 MEAD principle
The evaluation value Fe based on the MEAD principle is, H F e / 1 =
where H is the entropy of angle distribution as follows:
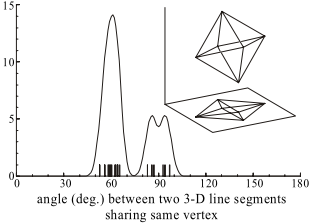
where p(θ) is a probability density function of angle between two 3-D line segments sharing an end point which is a vertex of a 3-D wire frame. Figure 2 shows an example of angle distribution.
3.2 Planarity to loops
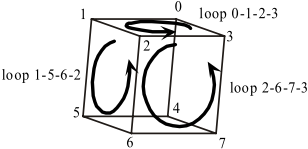
Loop is a cycle of graph of vertices connected by line segments of a wire frame as shown in figure 3. Perception tends to interpret such loops as flat faces of polyhedron. The evaluation value Fp represents this perceptual preference as
where L is the set of the indices of loops having 4 or more vertices. λi is the minimal eigen value of the covariance matrix of x, y, and z coordinates of the set of vertices on the i-th loop. Si is the area of i-th loop on xy plane.
3.3 GA with MGG and UNDX
For the optimization the set of real numbers, a real-coded GA is often used. We also use it with MMG and UNDX [Ono et. al., 1998]. The chromosome consists of the sequence of z coordinates. We set a population size to be 200, the number of crossovers to be 200, the number of generations to be 4,000. That is, we randomly pick up two sequences from the 200 sequences of z coordinates (the population), and generate 400 sequences based on the UNDX referring the two sequences and a sequence randomly selected from the rest of the population. The 400 plus two sequences are evaluated and sorted by F value, and the best and a sequence selected by roulette based on its rank are return to the population. The above procedure is repeated 4,000 times and the best in the last population is the simulation result.
4 Simulation
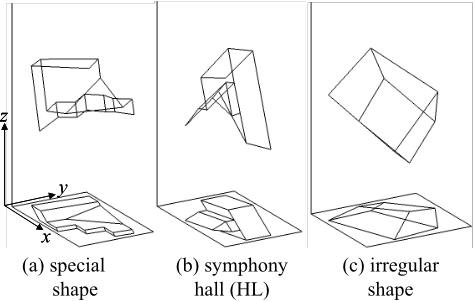
We used the data of 18 line drawings for simulation that were used by Shoji et. al. [2001]. The data can be obtained from the URL http://www.ccs.neu.edu/home/feneric/msdsm.html. All of these line drawings are regular. So, we also prepare irregular ones. From all of the regular 18 line drawing the proposed model makes 3-D wire frames coincident with perception, while Shoji's model using only the MEAD fails in 3 of the 18 line drawings. On the irregular line drawings which are made from a quadrangular pyramid truncated two non-parallel planes, the proposed model also succeeds. Only the characteristic results are shown in figure 4.
5 Conclusions
We implemented the proposed model based on the MEAD principle and the perceptual preference of planarity to the loops of wire frames using a genetic algorithm. Simulation results show the good coincidence with human perception. As a future work, we plan to use the proposed model for the evaluation engine of the e-learning system for illustrators. That is, a learner draws a line drawing observing an actual wire frame object, and then the system evaluates the drawing comparing the 3-D wire frame made from it with the 3-D data of the original one.
@inproceedings{ijcai2005p337,
  title     = {3-D Interpretation of Single Line Drawings},
  author    = {Shoji, Kenji and Toyama, Fubito and Miyamichi, Juichi},
  booktitle = {Proceedings of the Nineteenth International Joint Conference on
               Artificial Intelligence, {IJCAI-05}},
  publisher = {International Joint Conferences on Artificial Intelligence},
  editor    = {Leslie Pack Kaelbling and Alessandro Saffiotti},
  pages     = {1738--1738},
  year      = {2005},
  url       = {https://ijcai.org/proceedings/2005/337},
}
TY - CPAPER TI - 3-D Interpretation of Single Line Drawings AU - Shoji, Kenji AU - Toyama, Fubito AU - Miyamichi, Juichi T2 - Proceedings of the Nineteenth International Joint Conference on Artificial Intelligence, IJCAI-05 PB - International Joint Conferences on Artificial Intelligence PY - 2005 SP - 1738 EP - 1738 UR - https://ijcai.org/proceedings/2005/337 ER -Copied
Machine-readable versions of this paper, for tools and AI agents:





