
Automatic Text-to-Scene Conversion in the Traffic Accident Domain
Proceedings of the Nineteenth International Joint Conference on Artificial Intelligence. Pages 1073-1077.
© 2005 International Joint Conferences on Artificial Intelligence
Abstract
In this paper, we describe a system that automatically converts narratives into 3D scenes. The texts, written in Swedish, describe road accidents. One of the program’s key features is that it animates the generated scene using temporal relations between the events. We believe that this system is the first text-to-scene converter that is not restricted to invented narratives. The system consists of three modules: natural language interpretation based on information extraction (IE) methods, a planning module that produces a geometric description of the accident, and finally a visualization module that renders the geometric description as animated graphics. An evaluation of the system was carried out in two steps: First, we used standard IE scoring methods to evaluate the language interpretation. The results are on the same level as for similar systems tested previously. Secondly, we performed a small user study to evaluate the quality of the visualization. The results validate our choice of methods, and since this is the first evaluation of a text-to-scene conversion system, they also provide a baseline for further studies.
- x -ẋi ) -, where xij is the score assigned by annotator on text i, ẋi the average score on text i, and ni the number of annotators on text i.
- [Adorni et al., 1984] Giovanni Adorni, Mauro Di Manzo, and Fausto Giunchiglia. Natural language driven image generation. In Proceedings of COLING 84, pages 495- 500, Stanford, California, 1984.
- [Arens et al., 2002] Michael Arens, Artur Ottlik, and Hans- Hellmut Nagel. Natural language texts for a cognitive vi- sion system. In Frank van Harmelen, editor, ECAI2002, Proceedings of the 15th European Conference on Artificial Intelligence, Lyon, July 21-26 2002.
- [Carlberger and Kann, 1999] Johan Carlberger and Viggo Kann. Implementing an efficient part-of-speech tagger. Software Practice and Experience, 29:815-832, 1999.
- [Coyne and Sproat, 2001] Bob Coyne and Richard Sproat. WordsEye: An automatic text-to-scene conversion system. In Proceedings of the Siggraph Conference, Los Angeles, 2001.
- [Danielsson, 2005] Magnus Danielsson. Maskininlärn- ingsbaserad koreferensbestämning för nominalfraser ap- plicerat på svenska texter. Master's thesis, Lunds Univer- sitet, 2005.
- [Dupuy et al., 2001] Sylvain Dupuy, Arjan Egges, Vincent Legendre, and Pierre Nugues. Generating a 3D simula- tion of a car accident from a written description in natural language: The Carsim system. In ACL2001: Workshop on Temporal and Spatial Information Processing, pages 1-8, Toulouse, July 7 2001.
- [Gildea and Jurafsky, 2002] Daniel Gildea and Daniel Juraf- sky. Automatic labeling of semantic roles. Computational Linguistics, 28(3):245-288, 2002.
- [Johansson et al., 2004] Richard Johansson, David Williams, Anders Berglund, and Pierre Nugues. Carsim: A System to Visualize Written Road Accident Reports as Animated 3D Scenes. In ACL2004: Second Workshop on Text Meaning and Interpretation, pages 57-64, Barcelona, July 25-26 2004.
- [Pustejovsky et al., 2002] James Pustejovsky, Roser Saurí, Andrea Setzer, Rob Gaizauskas, and Bob Ingria. TimeML Annotation Guidelines. Technical report, 2002.
- [Quinlan, 1993] John Ross Quinlan. C4.5: Programs for Machine Learning. Morgan Kauffman, 1993.
- [Soon et al., 2001] Wee Meng Soon, Hwee Tou Ng, and Daniel Chung Yong Lim. A machine learning approach to coreference resolution of noun phrases. Computational Linguistics, 27(4):521-544, 2001.
- [Sproat, 2001] Richard Sproat. Inferring the environment in a text-to-scene conversion system. In Proceedings of the K-CAP'01, October 22-23 2001.
- [Surdeanu et al., 2003] Mihai Surdeanu, Sanda Harabagiu, John Williams, and Paul Aarseth. Using predicate- argument structures for information extraction. In Pro- ceedings of the ACL, Sapporo, Japan, 2003.
References were extracted automatically from the PDF and may contain errors.
Full text extracted automatically from the PDF; figures, tables and equations may differ. The PDF is the version of record.
1 Introduction
For a machine, text-to-scene conversion consists in synthesizing a 2D or 3D geometric description from a text and in displaying it. Ideally, a text-to-scene converter would recreate mental images we formwhen we read a text. This represents a demanding task involving semantic and cognitive capabilities and to many people seems both a far off and surreal fantasy. However, there have been a small number of systems that provided insights into the feasibility of it while at the same time showing significant limitations [Adorni et al., 1984; Coyne and Sproat, 2001; Arens et al., 2002]. First, all the systems are restricted to very simple narratives, typically invented by the authors themselves. Furthermore, none of the authors report details on the text corpus they used or any precise description of the results. Another significant point is that these systems all focus on spatial relations, while ignoring the temporal dimension completely. Most of them are limited to recreating static scenes.
In this paper, we describe a new version of the Carsim system [Johansson et al., 2004; Dupuy et al., 2001], which is a text-to-scene converter that handles real texts and that we evaluated using quantitative methods. The program generates 3D graphics from traffic accident reports generally collected from web sites of Swedish newspapers. One of its key features is that it takes time and temporal relations between events into account to animate the synthesized scene.
The structure of this article is as follows: Section 2 describes the Carsim system and the application domain. Section 3 details the implementation of the natural language interpretation module. Then, in Section 4, we turn to the spatial and temporal reasoning that is needed to construct the visualization. The evaluation is described in Section 5. Finally, we discuss the results and their implications in Section 6.
2 The Carsim System
Narratives of a car accidents often make use of space descriptions, movements, and directions that are sometimes difficult to grasp for readers. We believe that forming consistent mental images is necessary to understand them properly. However, some people have difficulties in imagining situations and may need visual aids pre-designed by professional analysts.
Carsim is a computer program 1 that addresses this need. It is intended to be a helpful tool that can enable people to imagine a traffic situation and understand the course of events properly. The program analyzes texts describing car accidents and visualizes them in a 3D environment.
To generate a 3D scene, Carsim combines natural language processing components and a visualizer. The language processing module adopts an information extraction strategy and includes machine learning methods to solve coreference, classify predicate/argument structures, and order events temporally. However, as real texts suffer from underspecification and rarely contain a detailed geometric description of the actions, information extraction alone is insufficient to convert narratives into images automatically. To handle this, Carsim infers implicit information about the environment and the involved entities from key phrases in the text, knowledge about typical traffic situations, and properties of the involved entities. The program uses a visualization planner that applies spatial and temporal reasoning to "imagine" the entities and actions described in the text, and that tries to find the simplest configuration that fits the description.
1 An online demonstration of the system is available at http://www.lucas.lth.se/lt.
2.1 ACorpus of Traffic Accident Descriptions
Carsim has been developed using authentic texts. As a development set, we collected approximately 200 reports of road accidents from various Swedish newspapers. The task of analyzing the news reports is made more complex by their variability in style and length. The size of the texts ranges from a couple of sentences to more than a page. The amount of details is overwhelming in some reports, while in others, most of the information is implicit. The complexity of the accidents described ranges from simple crashes with only one car to multiple collisions with several participating vehicles and complex movements. Although our work has concentrated on the press clippings, we also have access to accident reports from the STRADA database (Swedish TRaffic Accident Data Acquisition) of Vägverket, the Swedish traffic authority.
The next text is an excerpt fromour test corpus. This report is an example of a press wire describing an accident.
En bussolycka i södra Afghanistan krävde på torsdagen 20 dödsoffer. Ytterligare 39 personer skadades i olyckan som inträffade tidigt på torsdagsmorgonen två mil norr om staden Kandahar. Bussen var på väg från Kandahar mot huvudstaden Kabul när den under en omkörning körde av vägbanan och voltade, meddelade general Salim Khan, biträdande polischef i Kandahar. Läget för några av de skadade uppgavs som kritiskt.
TT-AFP & Dagens Nyheter, July 8, 2004
A bus accident in southern Afghanistan last Thursday claimed 20 victims. Additionally, 39 people were injured in the accident, which occurred early Thursday morning twenty kilometers north of the city Kandahar. The bus was on its way from Kandahar towards the capital Kabul when it left the road while overtaking and overturned, said general SalimKhan, assistant head of police in Kandahar. The state of some of the injured was said to be critical.
The text above, our translation.
2.2 Architecture of the Carsim System
We use a division into modules where each one addresses one step of the conversion process (see Figure 1).
- A natural language processing module that interprets the text to produce an intermediate symbolic representation.
- A spatio-temporal planning and inference module that produces a full geometric description given the symbolic representation.
- A graphical module that renders the geometric description as graphics.
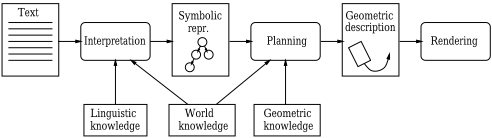
We use the intermediate representation as a bridge between texts and geometry. This is made necessary because the information expressed by most reports has usually little affinity with a geometric description. Exact and explicit accounts of the world and its physical properties are rarely present. In addition, our vocabulary is finite and discrete, while the set of geometric descriptions is infinite and continuous.
Once the NLP module has interpreted and converted a text, the planner maps the resulting symbolic representation of the world, the entities, and behaviors, onto a complete and unambiguous geometric description in a Euclidean space.
Certain facts are never explicitly stated, but are assumed by the author to be known to the reader. This includes linguistic knowledge, world knowledge (such as traffic regulations and typical behaviors), and geometric knowledge (such as typical sizes of vehicles). The language processing and planning modules take this knowledge into account in order to produce a credible geometric description that can be visualized by the renderer.
2.3 The Symbolic Representation
The symbolic representation has to manage the following trade-off. In order to be able to describe a scene, it must contain enough information to make it feasible to produce a consistent geometric description, acceptable to the user. On the other hand, the representation has to be close to ways human beings describe things to capture information in the texts.
We used four concept categories that we ordered in an inheritance hierarchy. The representation is implemented using Minsky-style ("object-oriented") frames, which means that the objects in the representation consist of a number of predefined attribute/values slots. This ontology was designed with assistance of traffic safety experts. It consists of:
- Objects. These are typically the physical entities that are mentioned in the text, but we might also need to present abstract or oneiric entities as symbols in the scene. Each object has a type that is selected from a predefined, finite set. Car and Truck are examples of object types.
- Events. They correspond intuitively to an activity that goes on during a period in time and here to the possible object behaviors. We represent events as entities with a type from a predefined set. Overturn and Impact are examples.
- Relations and Quantities. The objects and the events need to be described and related to each other. The most obvious examples of such information are spatial information about objects and temporal information about events. We should be able to express not only exact
- quantities, but also qualitative information (by which we mean that only certain fundamental distinctions are made). Behind, FromLeft, and During are examples of spatial and temporal relations.
- Environment. The environment of the accident is important for the visualization to be understandable. Significant environmental parameters include light, weather, road conditions, and type of environment (such as rural or urban). Another important parameter is topography, but we have set it aside since we have no convenient way to express this qualitatively.
3 Natural Language Interpretation
We use information extraction techniques to interpret the text. This is justified by the symbolic representation, which is restricted to a limited set of types and the fact that only a part of the meaning of the text needs to be presented visually. The IE module consists of a sequence of components (Figure 2). The first components carry out a shallow parse: POS tagging, NP chunking, complex word recognition, and clause segmentation. This is followed by a cascade of semantic markup components: named entity recognition, temporal expression detection, object markup and coreference, and predicate argument detection. Finally, the marked-up structures are interpreted to yield the resulting symbolic representation of the accident. The development of the IE module has been made more complex by the fact that few tools or annotated corpora are available for Swedish. The only significant external tool we have used is the Granska POS tagger [Carlberger and Kann, 1999].
3.1 Entity Detection and Coreference
A correct detection of the involved entities is crucial for the graphical presentation to be understandable. We first search the likely participants among the noun phrases in the text by checking them against a dictionary. We then apply a coreference solver to link the groups that refer to identical entities. This results in a set of equivalence classes referring to entities that are likely to be participants in the accident.
The coreference solver uses a hand-written filter in conjunction with a statistical system based on decision trees [Danielsson, 2005]. The filter first tests each antecedentanaphor pair using 12 grammatical and semantic features to prevent unlikely coreference. The statistical system then uses 20 features to classify pairs of noun groups as coreferring or not. These features are lexical, grammatical, and semantic. The trees were induced from a set of hand-annotated examples using the ID3 algorithm and a method inspired by Soon et al. [2001]. We implemented a novel feature transfer mechanism that propagates and continuously changes the values of semantic features in the coreference chains during clustering. This means that the coreferring markables inherit semantic properties from each other. Feature transfer, as well as domain-specific semantic features, proved to have a significant impact on the performance.
3.2 Domain Events
In order to produce a symbolic representation of the accident, we need to recreate the course of events. We find the events using a two-step procedure. First, we identify and mark up text fragments that describe events, and locate and classify their arguments. Secondly, we interpret the fragments in order to produce event objects as well as the involved participants, spatial and temporal relations, and information about the environment. This two-step procedure is similar to other work that uses predicate-argument structures for IE, for example [Surdeanu et al., 2003].
We classify the arguments of each predicate (assign them a semantic role) using a statistical system, which was trained on about 900 hand-annotated examples. Following Gildea and Jurafsky [2002], there has been a relative consensus on the features that the classifier should use. We use a slightly different set; since we have no full parser, there are no features that refer to the parse tree. Also, since the system is domain-specific, we have introduced a semantic type feature that takes the following values: dynamic object, static object, human, place, time, cause, or speed.
Similarly to the method described by Gildea and Jurafsky [2002], the classifier chooses the role that maximizes the estimated probability of a role given the values of the target, head, and semantic type attributes:
If a particular combination of target, head, and semantic type is not found in the training set, the classifier uses a back-off strategy, taking the other attributes into account. In addition, we tried other classification methods (ID3 with gain ratio, SVMs) without any significant improvement.
When the system has located the references to domain events in the text, it can interpret them; that is, we map the text fragments onto entities in the symbolic representation. This stage makes significant use of world knowledge, for example to handle relationships such as metonymy and ownership.
Since it is common that events are mentioned more than once in the text, we need to remove the duplicates in order not to introduce unnecessary animations. Event coreference is a task that can be treated using similar methods as those we used for object coreference. However, event coreference is a simpler problem since the range of candidates is narrowed by the involved participants and the event type. To get a minimal description of the course of events, we have found that it is sufficient to unify as many events as possible, taking event types and participants into account.
Finally, we fill in the information that is lacking due to mistakes or underspecification using default and heuristic rules. Thus, we have a complete description of the events and the participants.
3.3 Temporal Ordering of Events
Since we produce an animation rather than just a static image, we take time into account and we find the temporal relations between the events. Although the planner alone can infer a probable course of events given the positions of the participants, and some orderings are deducible by means of simple ad-hoc rules that place effects after causes (such as a fire after a collision), we have opted for a general approach.

We developed a component based on the generic TimeML framework [Pustejovsky et al., 2002]. We first create an ordering of all events in the text (where all verbs, and a small set of nouns, are considered to refer to events) by generating temporal links (orderings) between the words that denote the events. The links are generated by a hybrid system that consists of a statistical system based on decision trees and a small set of hand-written heuristics.
The statistical system considers events that are close to each other in the text, and that are not separated by explicit temporal expressions. It was trained on a set of handannotated examples, which consists of 476 events and 1,162 temporal relations. The decision trees were produced using the C4.5 tool [Quinlan, 1993] and make use of the following information:
- Tense, aspect, and grammatical construct of the verb groups that denote the events.
- Temporal signals between the words. This is a TimeML term for temporal connectives and prepositions such as "when", "after", and "during".
- Distance between the words, measured in tokens, sentences, and in punctuation signs.
The range of possible output values is the following subset of Allen's relations: simultaneous, after, before, is_included, includes, and none.
After the decision trees have been applied, we remove conflicting temporal links using probability estimates derived fromC4.5. Finally, we extract the temporal relations between the events that are relevant to Carsim.
3.4 Inferring the Environment
The environment is important for the graphical presentation to be credible. We use traditional IE techniques, such as domain-relevant patterns, to find explicit descriptions of the environment.
As noted by the WordsEye team [Sproat, 2001], the environment of a scene may often be obvious to a reader even though it is not described in the text. In order to capture this information, we try to infer it using prepositional phrases that occur in the description of the events. We then use a Naïve Bayesian classifier to guess the environment.
4 Planning the Animation
We use a planning system to create the animation out of the extracted information. It first determines a set of constraints that the animation needs to fulfill. Then, it goes on to find the initial directions and positions. Finally, it uses a search algorithm to find the trajectory layout. Since we use no backtracking, this separation into steps introduces a risk of bad choices. However, it reduces the computation load and proved sufficient for the texts we considered, enabling an interactive generation of 3D scenes and a better user experience.
4.1 Finding the Constraints
The constraints on the animation are created using the detected events and the spatial and temporal relations combined with the implicit knowledge about the world. The events are expressed as conjunctions of primitive predicates about the objects and their behavior in time. For example, if we state that there is an Overtake event where O1 overtakes O2, this is translated into the following proposition:
In addition, other constraints are implied by the events and our knowledge of the world. For example, if O1 overtakes O2, we add the constraints that O1 is initially positioned behind O2, and that O1 has the same initial direction as O2. Other constraints are added due to the non-presence of events,
if there is no mentioned collision between O1 and O2.
4.2 Finding Initial Directions and Positions
We use constraint propagation techniques to infer initial directions and positions for all the involved objects. We first set those directions and positions that are stated explicitly. Each time a direction is uniquely determined, it is set and this change propagates to the sets of available choices of directions for other objects, whose directions have been stated in relation to the first one. When the direction can't be determined uniquely for any object, we pick one object and set its direction. This goes on until the initial directions have been inferred for all objects.
4.3 Finding the Trajectories
After the constraints have been found, we use the IDA* search method to find a trajectory layout that is as simple as possible while violating no constraints. As heuristic function, we use the number of violated constraints multiplied by a constant in order to keep the heuristic admissible.
The most complicated accident in our development contains 8 events, which results in 15 constraints during search, and needs 6 modifications of the trajectories to arrive at a trajectory layout that violates no constraints. This solution is found in a few seconds. Most accidents can be described using only a few constraints.
At times, no solution is found within reasonable time. Typically, this happens when the IE module has produced incorrect results. In this case, the planner backs off. First, it relaxes some of the temporal constraints (for example: Simultaneous constraints are replaced by NearTime). Next, all temporal constraints are removed.
5 Evaluation
We evaluated the components of the system, first by measuring the quality of the extracted information using standard IE evaluation methods, then by performing a user study to determine the overall perception of the complete system. For both evaluations, we used 50 previously unseen texts, which had been collected from newspaper sources on the web. The size of the texts ranged from 36 to 541 tokens.
5.1 Evaluation of the Information Extraction Module
For the IE module, three aspects were evaluated: object detection, event detection, and temporal ordering of the events. Table 1 shows the precision and recall figures.
| P | R | Fβ=1 | |
|---|---|---|---|
| Objects | 0.96 | 0.86 | 0.91 |
| Events | 0.86 | 0.85 | 0.85 |
| Temporal relations (correct events) | 0.73 | 0.55 | 0.62 |
| Temporal relations (all events) | 0.61 | 0.51 | 0.55 |
The evaluations of object and event detection were rather straightforward. A road object was considered to be correctly detected if a corresponding object was either mentioned in or implicit from the text, and the type of the object was correct. The same criteria applied to the detection of events, but here we also added the criterion that the actor (and victim, where it applies) must be correct.
Evaluating the quality of the temporal orderings proved to be less straightforward. First, to make it feasible to compare the graph of orderings to the correct graph, it must be converted to some normal form. For this, we used the transitive closure (that is, we made all implicit links explicit). The transitive closure has some drawbacks - for example, one small mistake may cause a large impact on the precision and recall measures if many events are involved. However, we found no other obvious method for normalizing the temporal graphs.
A second problem to resolve was that of how to evaluate temporal orderings when the events are not all correctly detected. This difficulty arises when the event coreference resolution fails and multiple instances of the same event are reported. Because of this complication, we measured the link precision and recall for two cases: first, only those links that connect properly detected events; secondly, all links. We then compared the results.
The results of the event detection is comparable to those reported in previously published work. [Surdeanu et al., 2003] reports an F-measure of 0.83 in the Market Change domain for a system that uses similar IE methods. 2 Although our system has a different domain, a different language, and different resources (their system is based on PropBank), the figures are roughly similar. The somewhat easier task of detecting the objects results in higher figures, demonstrating that the method chosen works satisfactorily for the task at hand.
We believe that the figures for the temporal relations will prove competitive. We are not aware of any previous result in automatic detection of temporal relations in IE. The figures also show that the difference between the methods of evaluation is relatively small, suggesting that both methods are useful when evaluating temporal orderings.
5.2 User Study to Evaluate the Visualization
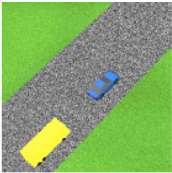
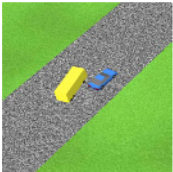
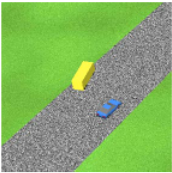
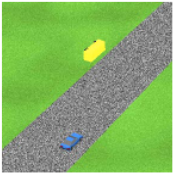
Four users were shown the animations of subsets of the 50 test texts. Figure 3 shows an example corresponding to the text from Subsection 2.1. The users graded the quality of animations using the following scores: 0 for wrong, 1 for "more or less" correct, and 2 for perfect. The average score was 0.91. The number of texts that had an average score of 2 was 14 (28 percent), and the number of texts with an average score of at least 1 was 28 (56 percent). These figures demonstrate that the chosen strategy is viable, especially in a restricted context like the traffic accident domain. However, interpretation of the figures is difficult since there are no previously published results. In any case, they provide a baseline for further studies, possibly in another domain.
To determine whether the small size of our test group introduced a risk of invalid results, we calculated the standard deviation of annotations 3 , and we obtained the value of 0.45. Replacing all annotations with random values from the same probability distribution resulted in a standard deviation of 0.83 on average. In addition, the pairwise correlation of the annotations is 0.75. This suggests that the agreement among annotators is enough for the figures to be relevant.
During discussions with users, we had a number of unexpected opinions about the visualizations. One important example of this is the quantity of implicit information they infer from reading the texts. For example, given a short description of a crash in an urban environment, one user imagined a collision of two moving vehicles at an intersection, while another user interpreted it as a collision between a moving and a parked car.
This user response shows that the task of imagining a situation is difficult for humans as well as for machines. Furthermore, while some users have suggested that we improve the realism (for example, the physical behavior of the objects), discussions generally made it clear that the semi-realistic graphics that we use (see Figure 3) may suggest to the user that the system knows more than it actually does. Since the system visualizes symbolic information, it may actually be more appropriate to present the graphics in a more "abstract" manner that reflects this better, for example via symbolic signs in the scene.
2 We have assumed that the Templettes that they use roughly can be identified with events.
3 We calculated this using the formula √∑ (xij˙xi)2 ∑ (ni-1) , where xij is the score assigned by annotator j on text i, ˙xi the average score on text i, and ni the number of annotators on text i.
6 Conclusion and Perspectives
We have presented an architecture and a strategy based on information extraction and symbolic visualization that enables to convert real texts into 3D scenes. As far as we know, Carsim is the only text-to-scene conversion system that has been developed and tested using non-invented narratives. It is also unique in the sense that it produces animated graphics by taking takes temporal relations between events into account.
We have provided the first quantitative evaluation of a textto-scene conversion system, which shows promising results that validate our choice of methods and set a baseline for future improvements.
In the future, we would like to extend the prototype system to deeper levels of semantic information. While the current prototype uses no external knowledge, we would like to investigate whether it is possible to integrate additional knowledge sources in order to make the visualization more realistic and understandable. Two important examples of this are geographical and meteorological information, which could be helpful in improving the realism and in creating a more accurate reconstruction of the circumstances and the environment. Another topic that has been prominent in our discussions with traffic safety experts is how to reconcile different narratives that describe the same accident.
Acknowledgements
The first author wishes to thank Margaret Newman-Nowicka for her numerous suggestions for improvement of this paper.
This work is partly supported by grant number 2002-02380 from the Språkteknologi program of Vinnova, the Swedish Agency of Innovation Systems.
@inproceedings{ijcai2005p24,
  title     = {Automatic Text-to-Scene Conversion in the Traffic Accident Domain},
  author    = {Johansson, Richard and Berglund, Anders and Danielsson, Magnus and Nugues, Pierre},
  booktitle = {Proceedings of the Nineteenth International Joint Conference on
               Artificial Intelligence, {IJCAI-05}},
  publisher = {International Joint Conferences on Artificial Intelligence},
  editor    = {Leslie Pack Kaelbling and Alessandro Saffiotti},
  pages     = {1073--1077},
  year      = {2005},
  url       = {https://ijcai.org/proceedings/2005/24},
}
TY - CPAPER TI - Automatic Text-to-Scene Conversion in the Traffic Accident Domain AU - Johansson, Richard AU - Berglund, Anders AU - Danielsson, Magnus AU - Nugues, Pierre T2 - Proceedings of the Nineteenth International Joint Conference on Artificial Intelligence, IJCAI-05 PB - International Joint Conferences on Artificial Intelligence PY - 2005 SP - 1073 EP - 1077 UR - https://ijcai.org/proceedings/2005/24 ER -Copied
Machine-readable versions of this paper, for tools and AI agents:





