
AUC: a Statistically Consistent and more Discriminating Measure than Accuracy
Proceedings of the Eighteenth International Joint Conference on Artificial Intelligence. Pages 519-525.
© 2003 International Joint Conferences on Artificial Intelligence
Abstract
Predictive accuracy has been used as the main and often only evaluation criterion for the predictive performance of classification learning algorithms. In recent years, the area under the ROC (Receiver Operating Characteristics) curve, or simply AUC, has been proposed as an alternative single-number measure for evaluating learning algorithms. In this paper, we prove that AUC is a better measure than accuracy. More specifically, we present rigourous definitions on consistency and discriminancy in comparing two evaluation measures for learning algorithms. We then present empirical evaluations and a formal proof to establish that AUC is indeed statistically consistent and more discriminating than accuracy. Our result is quite significant since we formally prove that, for the first time, AUC is a better measure than accuracy in the evaluation of learning algorithms.
- [Bradley, 1997] A. P. Bradley. The use of the area under the ROC curve in the evaluation of machine learning algo- rithms. Pattern Recognition, 30: 1145-1159, 1997.
- [Cohen et al., 1999] W. W. Cohen, R. E. Schapire, and Y. Singer. Learning to order things. Journal of Artificial Intelligence Research, 10:243-270, 1999.
- [Domingos and Pazzani, 1996] P. Domingos and M. Pazzani. Beyond independence: conditions for the optimality of the simple Bayesian classifier. In Proceedings of the Thirteenth International Conference on Machine Learn- ing, pages 105-112, 1996.
- [Ferri et al., 2002] C. Ferri, P. A. Flach, and J. Hernandez- Oralio. Learning decision trees using the area under the ROC curve. In Proceedings of the Nineteenth Inter- national Conference on Machine Learning (ICML 2002), pages 139-146,2002.
- [Hand and Till, 2001] D. 1. Hand and R. 1. Till. A simple gen- eralisation of the area under the ROC curve for multiple class classification problems. Machine Learning, 45: 171- 186,2001.
- [Kononenko, 1990] I. Kononenko . Comparison of induc- tive and naive Bayesian learning approaches to automatic knowledge acquisition. In B . Wielinga, editor, Current Trends in Knowledge Acquisition. lOS Press, 1990.
- [Langley et al., 1992] P. Langley, W. lba, and K. Thomas. An analysis of Bayesian classifiers. In Proceedings of the Tenth National Conference of Artificial Intelligence, pages 223-228. AAAI Press, 1992.
- [Ling and Zhang, 2002] C. X. Ling and H. Zhang. Toward Bayesian classifiers with accurate probabilities. In Pro- ceedings of the Sixth Pacific-Asia Conference on KDD. Springer, 2002.
- [Ling et al., 2003] C. X. Ling, J. Huang, and H. Zhang. AUC:A better measure than accuracy in comparing learn- ing algorithms. In Proceedings of 16th Canadian Confer- ence on Artificial Intelligence. Springer, 2003. To appear.
- [Provost and Fawcett, 1997] F. Provost and T. Fawcett. Analysis and visualization of classifier performance: comparison under imprecise class and cost distribution . In Proceedings of the Third International Conference on Knowledge Discovery and Data Mining, pages 43-48. AAAI Press, 1997.
- [Provost et al., 1998] F. Provost, T. Fawcett, and R. Kohavi. The case against accuracy estimation for comparing induc- tion algorithms. In Proceedings of the Fifteenth Interna- tional Conference on Machine Learning, pages 445-453.
- Morgan Kaufmann, 1998.
References were extracted automatically from the PDF and may contain errors.
Full text extracted automatically from the PDF; figures, tables and equations may differ. The PDF is the version of record.
1 Introduction
The predictive ability of the classification algorithm is typi cally measured by its predictive accuracy (or error rate, which is 1 minus the accuracy) on the testing examples. However, most classifiers (including C4.5 and Naive Bayes) can also produce probability estimations or "confidence" of the class prediction. Unfortunately, this information is completely ig nored in accuracy. This is often taken for granted since the true probability is unknown for the testing examples anyway.
In many applications, however, accuracy is not enough. For example, in direct marketing, we often need to promote the top X% of customers during gradual roll-out, or we often de ploy different promotion strategies to customers with differ ent likelihood of buying some products. To accomplish these tasks, we need more than a mere classification of buyers and non-buyers. We need (at least) a ranking of customers in terms of their likelihoods of buying. If we want to achieve a more accurate ranking from a classifier, one might naturally expect that we must need the true ranking in the training examples [Cohen et al., 1999]. In most scenarios, however, that is not possible. Instead, what we are given is a dataset of examples with class labels only. Thus, given only classification labels
Harry Zhang
Faculty of Computer Science University of New Brunswick Fredericton, NB, Canada E3B 5A3 hzhang@unb.ca
in training and testing sets, are there better methods than ac curacy to evaluate classifiers that also produce rankings?
The ROC (Receiver Operating Characteristics) curve has been recently introduced to evaluate machine learning algo rithms [Provost and Fawcett, 1997; Provost et al., 1998]. It compares the classifiers' performance across the entire range of class distributions and error costs. However, often there is no clear dominating relation between two ROC curves in the entire range; in those situations, the area under the ROC curve, or simply AUC, provides a single-number "summary" for the performance of the learning algorithms. Bradley [Bradley, 1997] has compared popular machine learning algorithms us ing AUC, and found that AUC exhibits several desirable prop erties compared to accuracy. For example, AUC has increased sensitivity in Analysis of Variance (ANOVA) tests, is inde pendent to the decision threshold, and is invariant to a pri ori class probability distributions [Bradley, 1997]. However, no formal arguments or criteria have been established. How can we compare two evaluation measures for learning algo rithms? How can we establish that one measure is better than another? In this paper, we give formal definitions on the con sistency and discriminancy for comparing two measures. We show, empirically and formally, that AUC is indeed a statisti cally consistent and more discriminating measure than accu racy.
One might ask why we need to care about anything more than accuracy, since by definition, classifiers only classify ex amples (and do not care about ranking and probability). We answer this question from two aspects. First, as we discussed earlier, even with labelled training and testing examples, most classifiers do produce probability estimations that can rank training/testing examples. Ranking is very important in most real-world applications. As we establish that AUC is a better measure than accuracy, we can choose classifiers with better AUC, thus producing better ranking. Second, and more im portantly, if we build classifiers that optimize AUC (instead of accuracy), it has been shown [Ling and Zhang, 2002] that such classifiers produce not only better AUC (a natural con sequence), but also better accuracy (a surprising result), com pared to classifiers that optimize the accuracy. To make an analogy, when we train workers on a more complex task, they will do better on a simple task than workers who are trained only on the simple task.
Our work is quite significant for several reasons. First, we establish rigourously, for the first time, that even given only labelled examples, AUC is a better measure (defined in Section 2.2) than accuracy. Second, our result suggests that AUC should replace accuracy in comparing learning algo rithms in the future. Third, our results prompt and allow us to re-evaluate well-established results in machine learning. For example, extensive experiments have been conducted and published on comparing, in terms of accuracy, decision tree classifiers to Naive Bayes classifiers. A well-established and accepted conclusion in the machine learning community is that those learning algorithms are very similar as measured by accuracy [Kononenko, 1990; Langley et al., 1992; Domin gos and Pazzani, 1996]. Since we have established that AUC is a better measure, are those learning algorithms still very similar as measured by AUC? We have shown [Ling et al., 2003] that, surprisingly, this is not true: Naive Bayes is sig nificantly better than decision tree in terms of AUC. These kinds of new conclusions are very useful to the machine learn ing community, as well as to machine learning applications (e.g., data mining). Fourth, as a new measure (such as AUC) is discovered and proved to be better than a previous mea sure (such as accuracy), we can re-design most learning al gorithms to optimize the new measure [Ferri et al., 2002; Ling and Zhang, 2002]. This would produce classifiers that not only perform well in the new measure, but also in the pre vious measure, compared to the classifiers that optimize the previous measure, as shown in [Ling and Zhang, 2002]. This would further improve the performance of our learning algo rithms.
2 Criteria for Comparing Evaluation Measures for Classifiers
We start with some intuitions in comparing AUC and accu racy, and then we present formal definitions in comparing evaluation measures for learning algorithms.
2.1 AUC vs Accuracy
Hand and Till [Hand and Till, 2001] present a simple ap proach to calculating the AUC of a classifier G below.
where no and n 1 are the numbers of positive and negative ex amples respectively, and So = I: r;, where r; is the rank of ith positive example in the ranked list. Table 1 shows an example of how to calculate AUC from a ranked list with 5 positive examples and 5 negative examples. The AUC of the rankedlistinTable 1 is (5+ 7 +8+~t~o)-SxB/ 2 , whichis24/25. It is clear that AUC obtained by Equation 1 is a measure for the quality of ranking, as the more positive examples are ranked higher (to the right of the list), the larger the term I: r;. AUC is shown to be equivalent to the Wilcoxon statistic rank test [Bradley, 19971
Intuitively, we can see why AUC is a better measure than accuracy from the following example. Let us consider two classifiers, Classifier 1 and Classifier 2, both producing prob ability estimates for a set of 10 testing examples. Assume that both classifiers classify 5 of the 10 examples as positive, and the other 5 as negative. If we rank the testing examples ac cording to increasing probability of being+ (positive), we get the two ranked lists as in Table 2.
| + + + + + |
| 2 3 4 5 |
| 5 7 8 9 10 |
| Classifier 1 | - - - - + - + + ++ |
| Classifier2 | +---- + + + +- |
Clearly, both classifiers produce an error rate of 20% (one false positive and one false negative), and thus the two classi fiers are equivalent in terms of error rate. However, intuition tells us that Classifier 1 is better than Classifier 2, since overall positive examples are ranked higher in Classifier 1 than 2. If we calculate AUC according to Equation 1, we obtain that the AUC of Classifier 1 is ;: (as seen in Table 1), and the AUC of Classifier 2 is ~~. Clearly, AUC does tell us that Classifier 1 is indeed better than Classifier 2.
Unfortunately, "counter examples" do exist, as shown in Table 3 on two other classifiers: Classifier 3 and Classifier 4. It is easy to obtain that the AUC of Classifier 3 is ;; , and the AUC of Classifier 4 is ~~. However, the error rate of Classi fier 3 is 40%, while the error rate of Classifier 4 is only 20% (again we assume that the threshold for accuracy is set at the middle so that 5 examples are predicted as positive and 5 as negative). Therefore, a larger AUC does not always imply a lower error rate.
| Classifier 3 | -- -+ +-- +++ |
| Classifier 4 | +- --- ++++- |
Another intuitive argument for why AUC is better than ac curacy is that AUC is more discriminating than accuracy since it has more possible values. More specifically, given a dataset with n examples, there is a total of only n + 1 different clas sification accuracies (0/n, 1/n, ... , n/n). On the other hand, assuming there are n0 positive examples and n 1 negative ex amples (no+ n 1 = n), there are non1 + 1 different AUC val ues (O/non1, 1/nonl, ... , nondnonl), generally more than n + 1. However, counter examples also exist in this regard. Table 4 illustrates that classifiers with the same AUC can have different accuracies. Here, we see that Classifier 5 and Clas sifier 6 have the same AUC(~) but different accuracies (60% and 40% respectively). In general, a measure with more val ues is not necessarily more discriminating. For example, the weight of a person (having infinitely many possible values) has nothing to do with the number of siblings (having only a small number of integer values) he or she has.
| Classifier 5 | - -++- ++- |
| Classifier 6 | -+ -- + ++-- + -+ |
How do we compare different evaluation measures for learning algorithms? Some general criteria must be estab lished.
2.2 (Strict) Consistency and Discriminancy of Two Measures
Intuitively speaking, when we discuss two different measures f and g on evaluating two learning algorithms A and B, we want at least that f and g be consistent with each other. That is, when f stipulates that algorithm A is (strictly) better than B, then g will not say B is better than A. Further, iff is more discriminating than g, we would expect to see cases where f can tell the difference between algorithms A and B but g can not.
This intuitive meaning of consistency and discriminancy can be made precise as the following definitions.
Definition 1 (Consistency) For two measures f, g on do main \lf, f , g are (strictly) consistent if there exist no a, b E W, such that f(a) > f(b) and g(a) < g(b).
Definition 2 (Discriminancy) For two measures f , g on do main \lf, f is (strictly) more discriminating than g if there exist a, bE \lf such that f(a) > f(b) and g(a) = g(b) , and there exist no a, b E \lf such that g( a) > g( b) and f( a) = f( b).
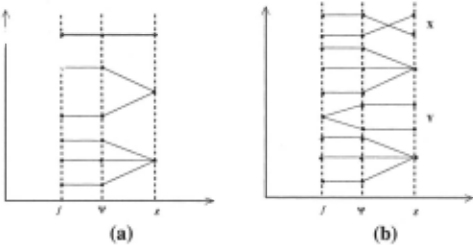
As an example, let us think about numerical marks and let ter marks that evaluate university students. A numerical mark gives 100, 99, 98, ... , 1, or 0 to students, while a letter mark gives A, B, C, D, or F to students. Obviously, we regard A > B > C > D > F. Clearly, numerical marks are consistent with letter marks (and vice versa). In addition, numerical marks are more discriminating than letter marks, since two students who receive 91 and 93 respectively receive different numer ical marks but the same letter mark, but it is not possible to have students with different letter marks (such as A and B) but with the same numerical marks. This ideal example of a mea sure f (numerical marks) being strictly consistent and more discriminating than another g (letter marks) can be shown in the figure 1 (a).
2.3 Statistical Consistency and Discriminancy of Two Measures
As we have already seen in Section 2.1, counter examples on consistency and discriminancy do exist for AUC and accu racy. Therefore, it is impossible to prove the consistency and discriminancy on AUC and accuracy based on Definitions 1 and 2. Figure 1(b) illustrates a situation where one measure f is not completely consistent with g, and is not strictly more discriminating than g. In this case, we must consider the prob ability of being consistent and degree of being more discrimi nating. What we will define and prove is the probabilistic ver sion of the two definitions on strict consistency and discrim inancy. That is, we extend the previous definitions to degree of consistency and degree of discriminancy, as follows :
Definition 3 (Degree of consistency) For two measures f and g on domain \lf, let R = {(a , b)la , b E W, f(a) > f(b),g(a) > g(b)}, S = {(a , b)la , b E W, f(a) > f(b), g(a) < g(b)}. The degree of consistency 1 off and g is C (0 :S C :S 1), where C = IRII~ 1 1 s 1·
Definition 4 (Degree of discriminancy) For two measures f and g on domain \lf, let P = {(a, b)la, b E W, f(a) > f(b) , g(a) = g(b)}, Q = {(a, b)la, b E W, g(a) > g(b) , f(a) = f(b)}. The degree ofdiscriminancyfor f over gisD = ~-
There are clear and important implications of these defini tions of measures f and g in evaluating two machine learning algorithms, say A and B. Iff and g are consistent to degree C, then when f stipulates that A is better than B, there is a prob ability C that g will agree (stipulating A is better than B). If f is D times more discriminating than g, then it is D times more likely that f can tell the difference between A and B but g cannot than that g can tell the difference between A and B but f cannot. Clearly, we require that C > 0.5 and D > 1 if we want to conclude a measure f is "better" than a measure g. This leads to the following definition:
Definition 5 The measure f is statistically consistent and more discriminating than g if and only if C > 0. 5 and D > 1. In this case, we say, intuitively, that f is a better measure than g.
The statistical consistency and discriminancy is a special case of the strict consistency and more discriminancy. For the example of numerical and letter marks in the student evalua tion discussed in Section 2.2, we can obtain that C = 1. 0 and D = oo, as the former is strictly consistent and more discrim inating than the latter.
1 It is easy to prove that this definition is symmetric; that is, the degree of consistency off and g is same as the degree of consistency of g and f .
To prove AUC is statistically consistent and more discrim inating than accuracy, we substitute f by AUC and g by accu racy in the definition above. To simplify our notation, we will use A UC to represent AUC values, and ace for accuracy. The domain Ill is the ranked lists of testing examples (with n0 pos itive and n1 negative examples). Since we require C > 0.5 and D > 1 we will essentially need to prove:
Theorem 1 Given a domain Ill, let R = {(a, b)/AUC(a) > AUC(b), ace( a) > acc(b), a, b E Ill}, S {(a, b)/AUC(a) < AUC(b), ace( a) > acc(b) , a, b E Ill}. Then iR\~\si > 0.5 or /R/ > /S/.
Theorem 2 Given a domain Ill, let P = {(a, b)/AUC(a) > AUC(b), ace( a)= acc(b), a, bE Ill}, Q ={(a, b)jacc(a) > ace( b) , AUG( a)= AUC(b), a, bE Ill}. Then /PI> /Q/ .
3 Empirical Verification on AUC and Accuracy
Before we present a formal proof that AUC is statistically con sistent and more discriminating than accuracy, we first present an empirical verification. To simplify our notation, we will use AU C to represent AUC values, and ace for accuracy.
We conduct experiments with (artificial) testing sets to verify the statistical consistency and discriminancy between AUC and accuracy. The datasets are balanced with equal numbers of positive and negative examples. We test datasets with 4, 6, 8, 10, 12, 14, and 16 testing examples. For each number of examples, we enumerate all possible ranked lists of positive and negative examples. For the dataset with 2n ex amples, there are (;.") such ranked lists.
We exhaustively compare all pairs of ranked lists to see how they satisfy the consistency and discriminating propositions probabilistically. To obtain degree of consistency, we count the number of pairs which satisfy "AUC(a) > AUC(b) and ace( a) > ace( b)", and the number of pairs which sat isfy "AUG( a) > AUC(b) and ace( a) < acc(b)". We then calculate the percentage of those cases; that is, the degree of consistency. To obtain degree of discriminancy, we count the number of pairs which satisfy "AUC(a) > AUC(b) and ace( a) = ace( b)", and the number of pairs which satisfy "AUG( a)= AUG( b) and ace( a)> acc(b)".
Tables 5 and 6 show the experiment results for the balanced dataset. For consistency, we can see (Table 5) that for vari ous numbers of balanced testing examples, given AUG( a) > AUC(b), the number (and percentage) of cases that satisfy ace( a) > ace( b) is much greater than those that satisfy ace( a) < ace( b) . When n increases, the degree of consis tency (C) seems to approach 0.94, much larger than there quired 0.5. For discriminancy, we can see clearly from Table 6 thatthe number of cases that satisfy AUG( a) > AUG( b) and ace( a) =ace( b) is much more (from 15.5 to 18.9 times more) than the number of cases that satisfy ace( a) > ace( b) and AUG( a) = AUG( b). When n increases, the degree of dis criminancy (D) seems to approach 19, much larger than the required threshold 1.
These empirical experiments verify empirically that AUC is indeed a statistically consistent and more discriminating measure than accuracy for the balanced datasets, as a measure for learning algorithms.
| # | AUC(a) > AUC(b) & ace( a)> acc(b) | AUC(a) > AUC(b) & ace( a)< acc(b) | c |
| 4 | 9 | 0 | 1.0 |
| 6 | 113 | 1 | 0.991 |
| 8 | 1459 | 34 | 0.977 |
| 10 | 19742 | 766 | 0.963 |
| 12 | 273600 | 13997 | 0.951 |
| 14 | 3864673 | 237303 | 0.942 |
| 16 | 55370122 | 3868959 | 0.935 |
| # | AUC(a) > AUC(b) & ace( a)= acc(b) | ace( a) > ace( b) & AUG( a)= AUC(b) | D |
| 4 | 5 | 0 | 00 |
| 6 | 62 | 4 | 15.5 |
| 8 | 762 | 52 | 14.7 |
| 10 | 9416 | 618 | 15.2 |
| 12 | 120374 | 7369 | 16.3 |
| 14 | 1578566 | 89828 | 17.6 |
| 16 | 21161143 | 1121120 | 18.9 |
4 Formal Proof
In our following discussion, we assume that the domain 'I! is the set of all the ranked lists with n0 positive and n1 nega tive examples. In this paper, we only study the cases where a ranked list contains an equal number of positive and nega tive examples, and we assume that the cutoff for classification is at the exact middle of the ranked list (each classifier classi fies exactly half examples into the positive class and the other half into the negative class). That is, no = n1, and we use n instead of no and n 1·
Lemma 1 gives the maximum and minimum AUC values for a ranked list with a fixed accuracy rate.
Lemma 1 For a given accuracy rate a, let AUCmax(a) = max{AUC(r)jacc(r) = a , r E Ill}, AUCmin(a) min{AUC(r)jacc(r) = a, r E Ill}. Then AUCmin(a) = a 2 , AUCmax(a) = 1- (1- a) 2 .
Proof: Assume that there are np positive examples correctly classified. Then there are n-np positive examples in negative section. According to Equation 1, AUC value is determined by So, which is the sum of indexes of all positive examples. So when all n-np positive examples are put on the highest po sitions in negative section (their indexes are n, n-1, · · ·, np+ 1), and np positive examples are put on the highest positions in positive section (their indexes are 2n, 2n-1, · · ·, 2n-np+1), AUC reaches the maximum value. So
Similarly when all positiveexamples~t on the lowest po sitions in both positive and negative sections, AUC reaches the minimum value. Thus
Since a = ; , from above two formula, we can obtain AUCmin(a) = a 2 , AUCmax(a) = 1- (1- a) 2 . D
Lemma 2 For given accuracy rates a > /3 and a domain W, AUCmax(a) > AUCmax(/3), AUCmin(a) > AUCmin(/3).
Proof: It is straightforward to prove it from Lemma 1. D
Lemma 3 Let f(a) = {AUC(r)iacc(r) = a, r E "Ill}, R1 = {riacc(r) = a, AUC(r) = /3, r E "Ill}, R2 = {riacc(r) = a, AUC(r) = AUCmax(a) + AUCmin(a) /3, r E "Ill}. Then (a)ir(a)i = 2nnp- 2n/ + 1. (b)IR11 = IR21·
Proof: (a) It is straightforward to prove it from Lemma 1. (b) For any ranked list r E R1 we can convert it to another unique ranked list r' E R2 by exchanging the positions of examples. In the negative section, for any positive example whose position is r;, we exchange it with the example in the position of n + 1- r;. In the positive section, for any posi tive example in position r;, we exchange it with the example in the position of n- ( r; - n) + 1 + n. It's easy to obtain that AUC(r') = AUCmax+AUCm;n-/3. Sor' E R2. Thus, we havethatiRd::::; IR2I- Similarly,wecanprove!R2I::::; IR1I· Therefore IR1I = IR2I- D
Theorem 1 Given a domain "Ill, let R = {(a, b)IAUC(a) > AUC(b), ace( a) > ace( b), a, b E "Ill}, S {(a, b)IAUC(a) < AUC(b), ace( a) > acc(b), a, b E "Ill}. Then iR\~\si > 0.5 or IRI > lSI.
Proof: To prove IRI > lSI, first we prove for given accu racy rates a > /3, there are more ranked list pairs (a,b) to satisfy AUC(a) > AUC(b) than that to satisfy AUC(a) < AUC(b), where ace( a) = a, acc(b) = (3. Let Ra/3 = {(a, b)IAUC(a) > AUC(b), ace( a)= a, acc(b) = /3, a, bE w} and Sa/3 = {(a, b)IAUC(a) < AUC(b), ace( a) = a, acc(b) = (3, a, b E "Ill}. Then we should prove IRa/31 > ISa/3 1·
1) If AUCmin(a) > AUCmax(/3), then it is obvious IRa/31 > 0, ISa/31 = 0. So IRa/31 > ISa/3 1·
2) Otherwise, IRa/3 1 can be computed by adding two parts together. IRa/3 1 = IP1I + IP2I, where P1 ={(a, b)iacc(a) = a, acc(b) = /3, AUG( a) > AUCmax(/3), a, b E "Ill}, and P2 = {(a , b)iacc(a) = a,acc(b) = /3,AUCmax(f3) > AUG( a)> AUC(b), a, bE "Ill}.
For Sa/3· we have Sa/3 {(a, b)iacc(a) a, acc(b) = /3, AUCmax(/3) 2: AUG( b) > AUG( a) > AUCmin(a), a, bE "Ill} .
It can be proved that IRa/3 1 > ISa/3 1· We omit the details due to the space limitation.
Since R = Ua,/3 Ra/3· s = Ua,/3 Sa/3· and Ra,j3, n Ra2 f32 = ¢1, Sa,f3 1 n Sa2 f32 = ¢1, for a1 # a2 or fJ1 # fJ2, where a> /3. So IRI = L a, 13 1Raf3 l, lSI= L a, 13 1Saf3 1· For any given accuracies a> /3, we have proved IRa/3 1 > ISaf3 l, therefore, IRI > lSI. D
Now let us explore the discriminancy of AUC and accuracy. Lemma 4 to Lemma 5 are proposed as a basis to prove Theo rem 2. In the following lemmas, lrl stands for the number of examples in ranked list r, and lrl+ stands for the number of positive examples in r.
Lemma 4 Assume that R 1 and R2 are two sets of ranked lists on a given domain W, and that R1 = {rllrl = n, lrl+ = m,O < m < ~,AUC(r) = C,r E "Ill}, R2 = {rllrl = n, lrl+ = n- m,O < m < ~,AUC(r) = C,r E "Ill}. Then IR11 = IR21·
Proof: For any ranked list r E R1, we switch the examples on position i and n - i, to obtain another unique ranked list s. Next we replace all positive examples ins by negative ex amples and all negative examples ins by positive examples to obtain ranked lists'. It is obvious that AUC(s') = AUC(r). Since Is' I+ = n- m, s' E R2. Thus, IR1I ::::; IR2I - Similarly we can prove IR2I::::; IR1I- Therefore IR1I = IR2I- D
Lemma 5 Given a domain W, let a and /3 be accuracy rates a < /3 ::::; ~- Consider a series of ranked list sets R; = {riacc(r) = a, AUC(r) = ~2 , r E "Ill}, where i = 0, · · ·, n 2 ; Sj = {siacc(s) = /3, AUC(s) = f,-, r E "Ill}, where j = 0, · · ·, n 2 ; Let a; = IR;I, b; = IS;!, c; =a;+ b;. Then
Proof: We omit the proof due to the limitation of space. D Theorem 2 Given a domain W, let P = {(a , b)IAUC(a) > AUC(b),acc(a) = acc(b),a,b E "Ill}, Q = {(a,b)iacc(a) > acc(b), AUG( a)= AUC(b), a, bE w}. Then IPI > IQI.
Proof: Since w is the set of all the ranked lists with equal number of positive and negative examples, w can be parti tioned into ranked list sets P;j by different accuracy rates and AUC values. P;j = {riacc(r) = ~, AUC(r) = ~' 0::::; i::::; n 2 , 0 ::::; j ::::; n}. It is obvious w = U P;j . Let t;j = I P;j 1. Then by Lemma 5 for any i -:f j we have
After we sum all i and j, we have
Also for all i -:f j and k -:f 1, it's easy to obtain
Therefore, from inequality 2 and equation 3, we will get
On the other hand,
So
The above equation can also be written as
According to formula 4, we have
Then by equation 5 and inequality 6, we have
Let
and
Then
Therefore, according to inequality 7, we have IRI > lSI. D
5 Conclusions
In this paper, we give formal definitions of discriminancy and consistency in comparing evaluation measures for learning al gorithms. We prove that AUC is statistically consistent and more discriminating than accuracy. Our result is quite signif icant since we have established rigourously, for the first time,
that AUC is a better measure than accuracy in evaluating and comparing classification learning algorithms. This conclusion has many important implications in evaluating, comparing, and designing learning algorithms. In our future research, we will extend the results in this paper to cases with unbalanced class distribution and multiple classes.
@inproceedings{ijcai2003p77,
  title     = {AUC: a Statistically Consistent and more Discriminating Measure than Accuracy},
  author    = {Ling, Charles X. and Huang, Jin and Zhang, Harry},
  booktitle = {Proceedings of the Eighteenth International Joint Conference on
               Artificial Intelligence, {IJCAI-03}},
  publisher = {International Joint Conferences on Artificial Intelligence},
  editor    = {Georg Gottlob and Toby Walsh},
  pages     = {519--525},
  year      = {2003},
  url       = {https://ijcai.org/proceedings/2003/77},
}
TY - CPAPER TI - AUC: a Statistically Consistent and more Discriminating Measure than Accuracy AU - Ling, Charles X. AU - Huang, Jin AU - Zhang, Harry T2 - Proceedings of the Eighteenth International Joint Conference on Artificial Intelligence, IJCAI-03 PB - International Joint Conferences on Artificial Intelligence PY - 2003 SP - 519 EP - 525 UR - https://ijcai.org/proceedings/2003/77 ER -Copied
Machine-readable versions of this paper, for tools and AI agents:





