
Learning Consumer Photo Categories for Semantic Retrieval
Proceedings of the Eighteenth International Joint Conference on Artificial Intelligence. Pages 1413-1413.
© 2003 International Joint Conferences on Artificial Intelligence
Abstract
In this paper, we develop a computational learning framework to build a hierarchy of 11 cons um er photo categories for semantic retrieval. Two levels of visual semantics are learned for image content and image category statist ic ally. We evaluate the average precisions at top retrieved photos on 2400 heterogeneous consumer photos with very good result.
- [Bradshaw , 2000] B. Bradshaw. Semantic based image retrieval: a probabilistic approach. In Proc. of A CM Multimedia, pp. 167-176, 2000.
- [Vailaya et al., 2001] A. Vailaya et al. Bayesian frame- work for hierarchical semantic classification of va- cation images. IEEE Trans. on Image Processing, 10(1): 117-130, 2001.
References were extracted automatically from the PDF and may contain errors.
Full text extracted automatically from the PDF; figures, tables and equations may differ. The PDF is the version of record.
1 Introduction
Research on image categorization has received more at tention lately. In particular, the efforts to classify photos based on contents have been devoted to: indoor ver sus outdoor [Bradshaw, 2000], natural versus man-made [Bradshaw, 2000; Vailaya et a!., 2001], and categories of natural scenes [Vailaya eta!., 2001]. In general, the clas sifications were made based on low-level features such as color , edge directions etc and [Vailaya et a!., 2001] pre sented the most comprehensive coverage of the problem with a hierarchy of 8 categories.
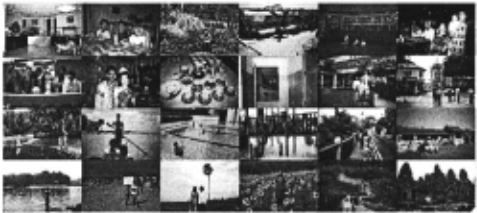
In this paper, we deal with a more comprehensive hier archy of 11 categories (Fig. 1) for 2400 consumer photos. These photos (Fig. 2), including photos of bad quality, present a real spectrum of complexities when compared to the photos used in previous works [Bradshaw, 2000; Vailaya et a!., 2001], which are mainly professional pho tos from the Corel stock photo library. Furthermore, only 20% of our test collection is used for training and we evaluate our approach in terms of average precisions (over 10 runs) of semantic retrieval at top retrieved pho tos which is important for practical usage. Our approach is unique that we compute uniform semantic features at both image content and image category levels using a computational learning framework instead of low-level features crafted for different categories.
At the image content level, salient image regions that exhibit semantic meanings are adopted as training exam ples to construct semantic support regions (SSR) that span a new indexing space. Local image regions of a photo is projected into this space as linear combinations of the SSR and further aggregated spatially to form im age content signature for similarity matching. At the
Jesse S. Jin
University of New South Wales Sydney 2052, Australia jesse@cse. unsw.edu.au
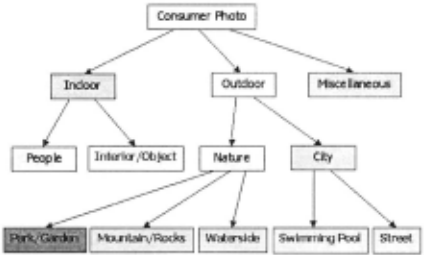
image category level, we learn image category models with small number of labeled photos to compute the rel evance measure of photos in a winner-take-all approach.
1.1 Learning Semantic Support Regions
SSR are salient image patches that exhibit semantic meanings to us . A cropped face region, a typical grass patch, and a patch of swimming pool water etc can all be treated as their instances. To compute the SSR from training instances, we adopt support vector machines. We extract suitable features such as color and textures for a local image patch and denote this feature vector as x. A support vector classifier S; devoted to a class i of SSR is treated as a function on x, S;(x). Then the posterior probability of class i can be computed as
For the experiments described in this paper, since we are dealing with heterogeneous consumer photos, we adopt color (means and standard deviations of each color chan nel) and texture features (means and standard devia tions of Gabor coefficients) to characterize SSR.
To detect SSR with translation and scale invariance in an image, the image is scanned with windows of different scales. To reconcile the detection maps across different resolutions onto a common basis, we adopt the following principle: If the probability of the most probable class of a region j at resolution k is less than that of a larger region (at resolution k + 1) that subsumes region j, then the classification probabilities of region j should be re placed by those of the larger region at resolution k + 1. To aggregate the classification probabilities of the recon ciled detection map for a spatial area X that comprises of x small equal regions with feature vectors x1 , x 2 , · · · , Xn, we compute the expected value of P(SiiX) over x1 as * 2.:: 1 P(SilxJ) since P(x1) are equal for all small regions j. The similarity between two corresponding blocks X 1 in image X and }j in image Y is computed as cosine between the probability vectors P(SiiX1) and P(SiiY1) . The overall similarity between X and Y is the average of the cosine values over all blocks.
1.2 Learning Semantic Image Categories
A photo category Mi is also learned using support vector machines. The input patterns to Mi are the indexes of the images (Z = P(SiiXJ)). The support vector learning computes the support images for the categories from a set of labeled photos. Given an unlabeled photo of index Z, the output of a category Mi is S(Mi, Z). With the winner-take-all approach, we compute the winner k as k = argmaxiS(Mi, Z). Then the relevance measure of Z to category M; is defined as
2 Empirical Evaluation
From the 2400 photos, we define ground truth lists for the 11 categories. Their sizes are listed in Table 1 as breadth-first order of Fig. 1 and examples are shown in Fig. 2. We designed 26 classes of SSR: people (face, fig ure, crowd, skin), sky (clear, cloudy, blue), ground (floor, sand, grass), water (pool, pond, river), foliage (green, flo ral, branch), mountain (far, rocky), building (old, city, far), interior (wall, wooden, china, fabric, light). We cropped 554 image regions from 138 images and used 375 of them as training data for support vector machines to compute the SSR and the remaining 179 as test data to gauge gen eralization performance. Among all the kernels tried, a polynomial kernel with degree 2 and constant 1 gave the best result on precision and recall.
We used 20% of the 2400 photos for training. We gen erated 10 different sets of positive training samples from the ground truth list for each category based on uniform random distribution. The negative training samples of a given category are positive training samples from other categories that do not overlap with the category. The evaluation of retrieval precision is carried out hierarchi cally with respect to the category tree in Fig. 1. The test data for the category of a child node of a run is the ground truth list of its parent node minus the training samples used for learning the category of the child node in the run. For example, to evaluate the retrieval perfor mance of nature (natr) photos, the ground truth list of outdoor less the training sample for building the nature category is taken as the test data. The learning and re trieval of each category were performed 10 times and the average precisions (over 10 runs) of top retrieved images are given in Table 1.
| I A vg.Prec. | I Size I | Top 20 | I Top 30 | I Top 50 |
|---|---|---|---|---|
| indr | 994 | 0.94 | 0.96 | 0.96 |
| outd | 1218 | 1.00 | 1.00 | 1.00 |
| inpp | 860 | 0.99 | 0.99 | 0.99 |
| inob | 134 | 0.84 | 0.75 | 0.56 |
| natr | 521 | 0.96 | 0.96 | 0.95 |
| city | 697 | 0.95 | 0.94 | 0.93 |
| park | 304 | 1.00 | 0.99 | 0.98 |
| mtrk | 67 | 0.41 | 0.27 | 0.16 |
| wtsd | 150 | 0.92 | 0.89 | 0.66 |
| pool | 52 | 0.47 | 0.32 | 0.21 |
| strt | 645 | 0.99 | 0.99 | 0.99 |
From Table 1, we observe that up to first 50 images, a user (on average) gets almost all relevant photos of the respective categories except less so for categories inte rior/object (inob) and waterside (wtsd), and even less so for categories mountain/rocks (mtrk) and swimming pool (pool). The reasons for poorer performance are 2-fold. First these categories have much fewer positive train ing samples (i.e. 27, 30, 13, 10). Next, they comprise images of varied contents ( c.f.Fig. 2: objects plus inte rior, mountain and rocks, lakeside plus beach, pool with and without water as focus). We believe that with more training samples, their performance would be raised.
@inproceedings{ijcai2003p219,
  title     = {Learning Consumer Photo Categories for Semantic Retrieval},
  author    = {Lim, Joo-Hwee and Jin, Jesse S.},
  booktitle = {Proceedings of the Eighteenth International Joint Conference on
               Artificial Intelligence, {IJCAI-03}},
  publisher = {International Joint Conferences on Artificial Intelligence},
  editor    = {Georg Gottlob and Toby Walsh},
  pages     = {1413--1413},
  year      = {2003},
  url       = {https://ijcai.org/proceedings/2003/219},
}
TY - CPAPER TI - Learning Consumer Photo Categories for Semantic Retrieval AU - Lim, Joo-Hwee AU - Jin, Jesse S. T2 - Proceedings of the Eighteenth International Joint Conference on Artificial Intelligence, IJCAI-03 PB - International Joint Conferences on Artificial Intelligence PY - 2003 SP - 1413 EP - 1413 UR - https://ijcai.org/proceedings/2003/219 ER -Copied
Machine-readable versions of this paper, for tools and AI agents:





