
Shading-Based Two-View Matching
Proceedings of the Twelfth International Joint Conference on Artificial Intelligence. Vision. Pages 1286-1290.
© 1991 International Joint Conferences on Artificial Intelligence
Abstract
This paper presents a region-based stereo matching algorithm, in which the regions are computed from the Gaussian (I<) and mean (H) curvature information of the image intensity surface. A region is defined as a connected area of constant KIH sign combination, and thus constitutes the footprint of a local section of the intensity surface, whose shape is a peak, a pit, a positive or a negative saddle. Region adjacency information is explicited by means of a Voronoi graph representation of the region map. Matching between nodes of identical shape types in the two region maps is established by comparing the topological configuration of their immediate neighborhoods. The disparity map is established through a coarseto-fine strategy.
- N. Ayache & B. Faverjon, Fast stereo match- ing of edge segments using prediction and verifi- cation of hypotheses, Proc. CVPR, San Francisco, Ca., 1985.
- H.H. Baker & T.O. Binford, Depth from edges and intensity based stereo, Proc. /JCAI, Vancouver, B.C., 1981.
- P.J . Besl & R.C . Jain, Invariant surface charac- teristics for 3D object recognition in range images, CVGIP 33, 1986.
- R .M. Bolle & D.B. Cooper, Bayesian recog- nition of local 3-D shape by approximating image intensity functions with quadric polynomials, IEEE Trans . PAM!, Vol. 6, 1984.
- L. Cohen, L. Vinet, P.T. Sander, & A. Gaga- lowicz, Hierarchical region based stereo matching, Proc. CVPR, Washington, D.C ., 1989.
- C.S. Fuh & P. Maragos, Region-based optical flow estimation, Proc. CVPR, Washington, D.C., 1989.
- F. Glazer, G. Reynolds, and P. Anandan , Scene matching by hierarchical correlation, Proc. CVPR, 1983.
- W .E.L. Grimson, Computational experiments with a feature based stereo algorithm, IEEE Trans. PAM/, vol. 7, 1985.
- A.D. Jepson, M.R.M. Jenkin , The fast com- putation of disparity from phase differences, Proc. CVPR, San Diego, Ca., 1989.
- B. Julesz, Binocular depth perception of computer-generated patterns, Bell Syst. Tech. J., Vol. 39, 1960.
- B.S. Lim & T.O. Binford, Stereo correspon- dence: a hierarchical approach, Proc. Image Un- ders . Workshop, Los Angeles, Ca., 1987.
- D. Marr & T . Poggio, A computational theory of human stereo vision, Proc. Roy. Soc. London, B, Vol. 204, 1979.
- J .E.W Mayhew & J .P. Frisby, Psychophysical and computational studies towards a theory of hu- man stereopsis, Artif Intel/., Vol. 17, 1981.
- P. Meer, D. Mintz & A. Rosenfeld, Robust Recovery of Piecewise Polynomial Image Structure, Proc. Workshop on Robust Computer Vision, 1990.
- H.K. Nishihara, Practical real-time imaging stereo matcher, Optic. Enginr., Vol. 23, 1984.
- Y. Ohta & T. Kanade, Stereo by Intra- and Inter-Scanline Search Using Dynamic Program- ming, IEEE Trans. PAM/, vol. 7, 1985.
- F .P. Preparata & M.I. Shamos, Computational Geometry, an Introduction, Springer-Verlag, 1988.
- J. Shen & S. Castan, An optimvallinear oper- ator for edge detection, Proc. CVPR, 1986.
- S.S. Sinha & B.G. Schunck, Discontinuity pre- serving surface reconstruction, Proc. CVPR, 1989.
- S.S. Sinha & B.G . Schunck, A robust method for surface reconstruction, Proc. Workshop on Ro- bust Computer Vision, 1990.
- F.I. Toriwaki & S. Yokoi, Voronoi and re- lated neighbors on digitized two-dimensional space with applications to texture analysis, Computa- tional Morphology, North-Holland, 1988.
- J . Weng,N. Ahuja, and T. Huang,Two-view matching, Proc. /CCV, Tampa, Fl, 1988.
- G. Xu, H. Kondo, & S. Tsuji, A region-based stereo algorithm, Proc. /JCAI, 1989. IJCAI
References were extracted automatically from the PDF and may contain errors.
Full text extracted automatically from the PDF; figures, tables and equations may differ. The PDF is the version of record.
1 Introduction
Computing 3-D structure from two stereoscopic or con secutive images requires the establishing of one-to-one correspondences between images primitives originating from the same elements of the scene. It is therefore es sential to select, as primitives to be matched, image char acteristics which strongly correlate with significant scene descriptors. Experiments with random stereograms, first introduced by Julesz [Jule60], have demonstrated that binocular matching does not necessitate a preliminary stage of high-level monocular recognition and can be based on local image primitives only. They have also shown that human stereopsis can tolerate substantial dif ferences in intensity values and micropatterns between the two images. It is thus widely accepted that the cor respondence problem cannot be efficiently solved by di rectly matching intensity values.
Techniques for solving the correspondence problem fall into two broad categories, namely the point-based and the region-based approaches. In the point-based category, Marr & Poggio [MaPo79] proposed a theory of stereoscopic matching, using as primitives the zero crossings of the image convolved with a Laplacian of Gaussian operator at different spatial resolutions. False matchings are minimized by means of a coarse-to-fine matching strategy, in which the disparity range is pro gressively reduced while the resolution is progressively increased. Mayhew & Frisby [MaFr81] later showed that zero-crossings alone cannot explain the perception of stereograms corresponding to saw-tooth intensity grat ings and suggested using peaks of the intensity profile as additional matching primitives. Many other point-based matching al_gorithms were proposed. Some of them use correlation lGlRe83], some use edges [BaBi81; Grim85; OhKa85], others use segments [AyFa85], combinations of features [Weng89] or phase [JeJe89].
Region-based approaches involve extracting from the two images, areas which are uniform with respect to some image characteristics. Regions have been defined as areas of consistent grey-level intensity bounded by edges [LiBi87; CVSG89], of constant sign of the "il 2 G*J band pass operator, of morphologically detected local peaks and valleys [FuMa89], or of black and white intensity produced by the projection of a filtered random dot pat tern onto the scene [XuKT89] .
Regional features possess certains advantages over points and lines. First, regions are more robust than edges because noise tends to perturb less a measurement taken over a region than one taken over its boundaries. This advantage was first noted by Nishihara [Nish83] who proposed a matching algorithm based on the re gions delimited by the zero-crossings contours of "V 2 G* I . Second, the matching ambiguity problem should be less severe with regions because they give rise to a richer va riety of features than points and segments. Third, occlu sions have a more radical effect on points and lines than on two-dimensional primitives and should thus be less detrimental to the matching performance of a region based matching algorithm. Finally, image descriptions in terms of regions implicitly contain region-adjacency information, which can be captured in a graph represen tation and constitute a powerful means of matching and disambiguation.
This paper presents a region-based matching algo rithm, in which the regions are computed from the Gaus sian (I<) and mean (H) curvature information of the im age intensity surface. A region is defined as a connected area of constant K I H sign combination, and thus con stitutes the footprint of a local section of the intensity surface, whose shape is a peak, a pit, a positive or a negative saddle, depending on the particular K I H sign combination [BeJa86]. Region adjacency information is explicited by means of a Voronoi neighborhood graph representation of the re~ion map (or equivalently, the Delaunay triangulation) [PrSh88]. Each node is labelled with a feature vector which contains the shape type, the size and the mean intensity of the corresponding re gion, while the arc joining two adjacent nodes is labelled with the relative position of the corresponding regions. Matching, between nodes of identical shape types and similar average intensity, is established by comparing the topological configurations of their immediate neigh borhoods. The disparity map is established through a coarse-to-fine strategy: regions are first extracted and matched at a coarser resolution in order to compute a rough estimate of the disparity map, which is then used to drive the matching procedure and the disparity com putation at a finer level.
The use of Gaussian and mean curvature information to define the region primitives can be justified in several ways. First, since regions are areas of constant K/ H sign combinations, their boundaries partially consist of the zero-crossings that would be used by an edge-based matching algorithm. However region boundaries are not limited to zero-crossings, and thus constitute a denser set of image elements. Second, the fact that K/ H re gions implicitly contain information about peaks of the intensity surfaces fits well with the argument that peaks of the intensity signal are useful primitives for stereopsis [MaFr81]. Third, since Gaussian and mean curvatures constitute surface characteristics which remain invariant under a change of viewpoint, they should provide a sta ble description of the image intensity surface, in areas of quasi-Lambertian behavior.
Section 2 of this paper gives a brief outline of the com plete matching algorithm, while sections 3 and 4 describe in more details the computation of the region map and the matching strategy respectively. Section 5 presents and discusses results obtained with real image pairs.
2 Algorithm Outline
The matching algorithm uses a coarse-to-fine strategy, which progressively increases the resolution and refines the disparity map estimation, using the local disparity obtained at a coarser level to drive the correspondence search at the next finer level. Each of the resolution stages consists of three different steps: (1) a region map extraction step, (2) a region matching step, and (3) a disparity map computation step .
The region map extraction step consists of all the pro cessing operations required to select the proper level of resolution (Gaussian filtering), to compute the signs of the Gaussian and mean curvature of the intensity surface at each pixel location, to establish the modified Voronoi diagram of the curvature regions, and to label the nodes and the arcs of the diagram with the necessary intra regional (shape type, size, mean intensity) and inter regional (relative position) parameters respectively. The modified Voronoi diagram, together with the node and arc labels, constitute the region map.
The region matching procedure is applied to regions of the two images which are of the same shape type and of similar average intensities. It starts with an initial, possi bly ambiguous, matching of regions based on a similarity measure of their neighborhood topology. In accordance with other multi-resolution strategies, the search for a match is conducted in a window, whose size is propor tional to the current Gaussian parameter, centered at the local disparity value inherited from the coarser resolution level (a zero disparity value is assumed at the coarsest level). This first attempt may produce three types of re sults: a one-to-one match, an ambiguous (one-to-several) match, or a no-match result . For a one-to-one match, a disparity vector (.6.x, .6.y) is computed. Ambiguous (one to-several) matches are further treated by a recursive disambiguation procedure, which consists of choosing, among all the matching alternatives for a node, the one whose disparity best agrees with those of the currently validated (i.e. one-to-one) matches within the Voronoi neighborhood. An attempt is then made to reduce the amount of unmatched nodes, using a relaxed procedure (i.e. reduced search window and more tolerant dissim ilarity test) which tries to find, for each such node, a one-to-one match around a disparity value in agreement with those of its Voronoi neighbors.
The disparity computation step consists of establish ing, through interpolation, a dense disparity map at the current resolution stage. In order to prevent undesirable blurring across discontinuities, the interpolation proce dure uses both the node disparity map established at the preceding step and an edge map obtained by means of a recursive edge detection operator [ShCa86] .
The next two sections give details concerning the map extraction and the region matching steps.
3 Region Map Extraction
3.1 Computation of Gaussian and Mean Curvatures
Scale selection is accomplished by Gaussian filtering of the intensity values, i.e. by convolving the image inten sity with the gaussian kernel:
The Gaussian (K) and the mean (H) curvatures are computed from the values of the first and second deriva tives of the filtered intensity surface, according to the expressiOns:
Computation of the derivatives requires a continuously differentiable intensity function. This can be accom plished by least-squares fitting a quadratic surface over a 5 x 5 neighborhood centered at each location. The derivatives needed to calculate K and H are then given by the coefficients of the basis functions obtained in per forming the fit [BoCo84].
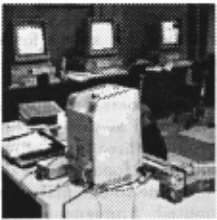
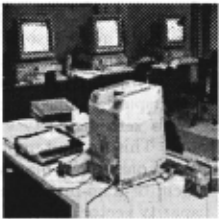
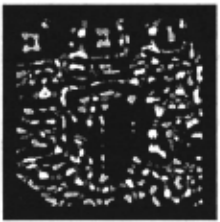
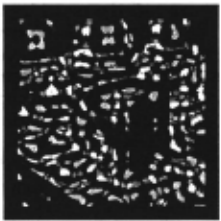
image2
Figure 1: Region map extraction: (a) Original monocu lar pair; (b) Regions obtained at coarse resolution level (u = 8). The four shape types are represented by four different grey-levels.
3.2 Definition of Curvature Regions
Regions of constant Kf H signs are then extracted by thresholding. Each region is the footprint of one among four possible shape primitives: a peak (K > 0, H < 0), a pit (K > O,H > 0), a negative saddle (K < 0, H < 0), and a positive saddle (K < 0, H > 0). In fact, H and J( values must be thresholded in order to confer to the region map some immunity to insignificant changes in curvature sign, caused by viewpoint changes in nearly flat areas of the intensity surface. In general, regions corresponding to positive or negative saddle shapes tend to be more elongated than those corresponding to peaks or pits. Since the later step of region matching will result in the association of a disparity value to a central loca tion of each region (its centroid or maximum curvature location), it is desirable to keep all regions reasonably compact. Consequently, the thresholds on J( f H must be selected so as to generate saddle regions whose com pactness remains comparable to that of peaks and pits. Once properly detected, all the curvature regions Rn of each image are indexed by means of a component la belling routine. Figure 1 (a), (b) shows a temporal pair of images and the corresponding regions extracted at the coarsest level of resolution.
3.3 Definition of Regional Features
Four intra-regional features are associated with each re gion Rn: its shape type Tn, its average intensity ln, its area Sn and the position (xn, Yn) of its extremum of Gaussian curvature (called region principal point in the rest of the text). This last feature is not used dur ing the matching procedure, but serves as anchor point of the region, in the computation of the local disparity. The location of curvature extremum is a better anchor point . than the region centroid, because it tends to be less affected by changes of the region shape, induced by variations of the curvature threshold. A fifth regional feature, called the Neighborhood Matrix N Mn is de fined in order to summarize information about the re gion immediate neighborhood. Its computation requires the transformation of the set of regions into a graph in which region adjacency is explicited. A natural choice for this graph is the modified Voronoi diagram [ToYo88; PrSh88] of the curvature regions. Each node of the graph corresponds to a particular curvature region Rn and c~ incides with the location (xn, Yn) of its principal point. It is labelled with the set of the four regional features Tn,ln,Sn,NMn.
The aspects of the neighborhood information which are conveyed by the Neighborhood Matrix N Mn are the locations of Voronoi neighbors, as well as their own in traregional characteristics, namely their shape type, area and average intensity. This choice of characteristics is justified by the consistency of the relative position and orientation of each neighbor under changing viewpoint, as noticeable in the example of Figure 1. The area around the region under consideration is divided into 16 sectors and the neighbors are sorted according to the sector in which they fall . The matrix N Mn consists of 16 rows: the kth row enumerates the four characteristics of the closest neighbor whose principal point falls in the kth sector, namely
N Mn(k, 1): an integer (between 1 and 4) indi cating the shape type of the neighbor,
N Mn(k, 2): its area,
N Mn(k,3): its distance from the central region Rn,
N Mn(k,4): its average intensity.
If no Voronoi neighbor falls into a sector, its corre sponding row is empty.
4 Region Matching and Disparity Computation
4.1 Matching Criterion
The matching strategy consists of associating regions Rn and Rn· of the two images (i.e. nodes of the two region maps) which are of the same shape type and have highly similar neighborhoods:
(4) where E:nn' is a measure of the dissimilarity between the two neighborhood matrices N Mn and N Mn', and Inn' represents the absolute difference in average intensity be tween the two regions . Comparing the two neighborhood matrices could consist of comparing each row of the first matrix to the corresponding row in the second one, which would amount to comparing Voronoi neighbors which fall in identical sectors in the left and right images .. Such a comparison would be too strict however, since it would not allow any variation in neighborhood orientation un der viewpoint change. In order to confer some flexibility to the comparison, the dissimilarity measure is defined as:
where
Cis a normalizing constant and EB designates modulo-16 addition operator. The min operator in expression (6) is used to allow a relative rotation of one sector in either direction, when comparing neighbors in the two region maps. e:nn'(k) is a penalty measure which takes into ac count differences in shape type, size, relative distance and mean intensity between the two neighbors under comparison. It uses threshold-type compatibility func tions defined as follows:
· Type Compatibility Function TH'
Type compatibility is thus assumed if and only if the shape types of the two neighbors under consid eration are identical.
· Size Compatibility Function uu'
where tarea is a relative area threshold (typically 30 %) which limits the acceptable size discrepancy between compatible neighbors.
- Distance Compatibility Function 6w
where tdi·t is an absolute threshold (typically 5 pix els) which limits the tolerable discrepancy of dis tance to the two central regions.
· Intensity Compatibility Function /H'
where tint is an absolute threshold (typically 8 grey levels, out of 256) which limits the tolerable dis crepancy between average intensity of compatible neighbors.
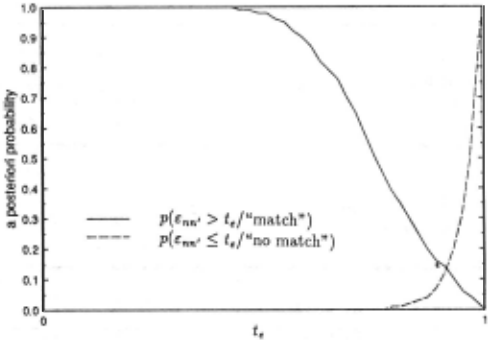
The ability of the dissimilarity measure e:nn' to cor rectly match regions of the two images is illustrated in Figure 2, which represents the statistical distributions of e:nn' for matching and unmatching regions. A dis criminating threshold can be easily defined to minimize the probability of misclassification. The inclusion in the matching criterion ( 4) of a test on the average intensities of the central regions Rn and Rn,, aims at increasing the robustness to occlusion errors, which would otherwise oc cur if type and neighborhood alone were used.
4.2 Matching Procedure
As mentioned in section 2, a first step of the matching procedure consists of selecting, for each region (node) of the first image, all potential matching nodes in the second image within a search window whose size de creases with increasing resolution. Potential matches are selected on the basis of the dissimilarity measure e:nn', using a decision threshold established by analysis of the distributions of Figure 2 (typically set to 0.80). At coarse resolution, a large search window (128-pixel wide for a 512x512 image) is used, since no a priori disparity infor mation is available at this level. A square window is used in the case of temporal image pairs, while in the stereo case the epipolar constraint allows a reduction of the window height. Since matching is done between regions and not point features, the window cannot be reduced to one line segment but necessitates a· height of a few pixels (typically 12), in order to allow for fluctuations in the position of the region principal points.
An efficient search strategy is an important consid eration when matching discrete primitives. A bucket ing technique is used to sort each region node according to the location of its principal point. The image plane is first divided into tiles, each of 4 x 4 pixels. A re gion whose principal point falls within a tile has its label stored in a memory location corresponding to this tile. The search window is centered at the tile which coincides with either the position of the region to be matched (at coarse resolution), or with this position offset by the current disparity estimate (at higher resolutions) .
| tare a: tlnt=7.5 tdlst=5.0 | 0.15 | 0 .20 | 0 .25 | 0.30 | 0.35 | 0.40 |
|---|---|---|---|---|---|---|
| tdlst bnt=7.5 tarea=0.30 | ||||||
| tint tdlst=5.0 tarea=0.30 |
In order to disambiguate between multiple potential matches, a disparity continuity constraint is applied, us ing neighboring information within an iterative proce dure. For each region, a disparity estimate is established using the median of the disparity values of the currentJy validated neighboring matches. Taking the median of x- and y-components of the disparity values rather than their mean provides some immunity to outliers. Compar ing then the disparity estimate with all corresponding potential matches allows us to select the match whose actual disparity is the closest to the estimate. This dis ambiguation step is allowed to iterate until there is no change in the number of validated matches.
The disparity continuity constraint is also used to force additional matches at the same resolution. For each un matched region, a disparity estimate is established by taking a weighted average of the disparity values of the validated neighbors. Each weight is inversely propor tional the distance (N Mn(k, 3)) and is normalized so that all weights sum to 1. The search window is centered on the tile corresponding to the principal point position offset by this new estimate, the window size radius is reduced, and the dissimilarity threshold is increased.
5 Results and Discussion
Table 1 illustrates the performance of the matching pro cedure, in the case of the temporal image pair of Figure 1, under variations of the dissimilarity measure parameters, and shows that the choice of such parameters does not critically affect the performance of the algorithm.
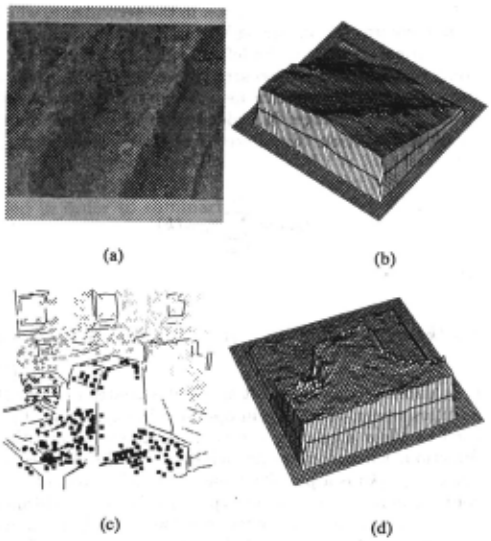
Figure 3 illustrates the kind of results obtained with a stereo pair and with the temporal pair of Figure 1, at a finer resolution level (u = 4). The left original stereo image is featured in (a), and its corresponding disparity map is plotted in (b). To demonstrate the density of the results extracted at this scale, a sparse density map for the temporal pair is shown in Figure 3 (c), where inten sity is inversely proportional to the disparityvalue and thus proportional to range. The edge map used to in hibit interpolation is also shown in Figure 3 (c) . Finally, Figure 3 (d) features a plot of the dense disparity map, for the temporal pair. The disparity values extracted for every region at the coarsest resolution are used to drive the matching at the finer one.
The interpolation scheme used here is based on Sinha & Schunck's method [SiSc89; SiSc90], which uses a least-median-squares approximation stage followed by a weighted bicubic spline interpolation stage. The approx imation performs a fit at each point defined on a regular grid, using nearby (irregularly spaced) sparse disparity data. This fitting provides regularly spaced disparity values, which are necessary for a spline-based surface in terpolation.
We modify the approximation stage as follows: we dis count any disparity value defined at a point which lies across a discontinuity from the point where we are per forming the fit. The motivation for this modification to the approximation scheme is that least-median-squares fitting provides noise immunity by ignoring outliers in the disparity data, but near discontinuities the number of outliers approaches the number of disparity values over which it is desirable to perform the fit. The fitting step yields a value consistent with the majority of neighbor ing points, and this would produce an incorrect disparity estimate if this value were dictated by undesirable points (e.g.: points lying outside of the boundary of an object over which we are fitting), if they were not eliminated.
6 Conclusion
This paper has described a region-based stereo matching algorithm, in which the regions are defined as areas of the intensity surface having constant-sign Gaussian (K) and mean (H) curvatures. Region adjacency information is explicited by means of a Voronoi graph representation of the region map. Matching between nodes of identi cal shape type in the two region maps is established by comparing the topological configuration of their imme diate neighborhoods. The disparity map is established through a coarse-to-fine strategy. All operations con cerning region map extraction and regional feature cal culation involve simple local computations, and make the algorithm suitable for efficient parallel implementation. Results presented indicate that the algorithm is reliable and produces dense disparity maps . Further experiments are under way in order to assess the performance in a wide range of situations.
7 Acknowledgement
This work has been supported by the Institute for Robotics and Intelligent Systems (IRIS) under the Cana dian program of Networks of Centres of Excellence. The help of Nguyen Hong Hai, computer analyst in our group, concerning various aspects of the algorithm im plementation is gratefully acknowledged.
@inproceedings{ijcai1991p189,
  title     = {Shading-Based Two-View Matching},
  author    = {Audette, Michel A. and Cohen, Paul R. and Weng, Juyang},
  booktitle = {Proceedings of the Twelfth International Joint Conference on
               Artificial Intelligence, {IJCAI-91}},
  publisher = {International Joint Conferences on Artificial Intelligence},
  editor    = {John Mylopoulos and Ray Reiter},
  pages     = {1286--1290},
  year      = {1991},
  month     = {8},
  note      = {Vision},
  url       = {https://ijcai.org/proceedings/1991/189},
}
TY - CPAPER TI - Shading-Based Two-View Matching AU - Audette, Michel A. AU - Cohen, Paul R. AU - Weng, Juyang T2 - Proceedings of the Twelfth International Joint Conference on Artificial Intelligence, IJCAI-91 PB - International Joint Conferences on Artificial Intelligence PY - 1991 SP - 1286 EP - 1290 UR - https://ijcai.org/proceedings/1991/189 ER -Copied
Machine-readable versions of this paper, for tools and AI agents:





