
A New Metaphor for the Graphical Explanation of Forward-Chaining Rule Execution
Proceedings of the Eleventh International Joint Conference on Artificial Intelligence. Tools. Pages 129-133.
© 1989 International Joint Conferences on Artificial Intelligence
Abstract
This paper describes a novel method for displaying and examining the execution space of a rule interpreter. This method provides both coarse-grained and fine-grained views. The coarsegrained view, based on temporal rather than logical dependencies, provides an abstraction of the execution history not available from text or tree based traces. The fine grained views allow the user to examine sections of the execution history in detail. A detailed scenario with screen snapshots is presented.
- du Boulay, B., O'Shea, T. & Monk, J. The Black Box Inside the Glass Box: Presenting Computing Concepts to Novices. International Journal of Man-Machine Studies. Vol. 14, pp. 237-249, 1981.
- Eisenstadt, M. & Brayshaw, M. The Transparent Prolog Machine (TPM): an execution model and graphical debugger for logic programming. Journal of Logic Programming, Vol. 5, No. 4, 1988, pp. 1-66.
- Fickas, S. Supporting the Programmer of a Rule Based Language. Expert Systems, Vol. 4, No. 2 pp. 74-87. May 1987.
- Forgy, C. L. Rete: A Fast Algorithm for the Many Pattern/ Many Object pattern Matching Problem. Artificial Intelligence , 19:17-37, 1982.
- Forgy, C. L. OPS5 User's Manual, July 1981.
- Hasemer, T., & Domingue, J. Common Lisp Programming for Artificial Intelligence. London: Addison-Wesley, 1989.
- Lewis J. W. An Effective Graphics User Interface for Rules and Inference Mechanisms. Proceedings of Computer and Human Interaction. December 1983 pp. 139-143.
- Kahney, H. (Ed.) Knowledge Engineering. (Open University study pack PD624, Learning materials service office, the Open University), Open University Press, 1989.
- KEE,. and Knowledge Engineering Environment (v 3.1)-are registered trademarks of IntelliCorp Inc.
- Mott, P. & Brooke, S. A Graphical Inference Mechanism. Expert Systems, May 1987. vol. 4. No. 2 pp. 106-117
- Motta, E., Eisenstadt, M., Pitman, K. & West, M. KEATS: Support for Knowledge Acquisition in The Knowledge Engineer's Assistant (KEATS). Expert Systems 5 (1), 1988, pp. 6-28
- Motta, E., Rajan, T, & Eisenstadt, M. Knowledge acquisition as a process of model refmement. International Journal of Man-Machine Studies, in press.
- NEXPERTTM is a registered trademark of Neuron Data Inc.
- Poltreck, S.E., Steiner, D. D., & Tarlton, P. N. Graphic Interfaces for Knowledge-Based System Development Proceedings ACM Conference on Computer Human Interaction, 1986.
- Rajan, T.M. APT: A Principled Design for an Animated View of Program Execution for Novice Programmers. Technical Report 19. Human Cognition Research Laboratory. Milton Keynes, MK7 6AA. December 1986.
- Richer, M. & Clancey, W. Guidon-Watch: A Graphic Interface for Viewing a Knowledge-Based System. IEEE CompuJer Graphics and Applications. 5, 11, 1985.
- SymbolicsTM is a registered trademark of Symbolics, Inc.
- VideoWorksTM is a registered trademark of MacroMind, Inc. (1985).
References were extracted automatically from the PDF and may contain errors.
Full text extracted automatically from the PDF; figures, tables and equations may differ. The PDF is the version of record.
1. INTRODUCTION
This paper presents the Transparent Rule Interpreter (TRI), a system that provides a graphical explanation of rule execution. TRI is one part of KEATS-II (Motta et. al., 1988; in press), a project with the overall aim of providing methodological and software support for all the stages of building very large Knowledge Based Systems. Such support includes the provision of a suite of tools for maintaining knowledge bases, collectively known as Knowledge Base Maintenance Tools (KBMTs). In a host of different applications (e.g. Eisenstadt & Brayshaw, 1988; Rajan, 1986; du Boulay, O'Shea & Monk, 1981), the provision of a clear execution model has proved to be an essential tool for understanding a computational process; TRI adheres to this approach by presenting a clear graphical execution model to the user.
TRI, implemented in Symbolics™ Common Lisp, has been built on top of the KEATS-II forward and backward chaining production system interpreter. The forward chaining part uses a Rete network (Forgy, 1982), and the backward chaining part has a Prolog-like inference mechanism. TRI relies on exhaustive (but low-overhead) recordings of the history of execution to facilitate a precise 'replay' in an intuitively meaningful way.
The rest of this paper is structured as follows. Section 2 discusses the motivation for TRI, in particular the problems found when programming with rules, previous attempts at solving the problems and our own approach. Section 3 gives a brief 'tour' of the system using an example, section 4 reviews the principles behind TRI and its extendability, and section 5 contains the conclusions.
2 TRACING RULE EXECUTION
2.1 Problems
There are two main types of problems in rule based programming. The first emerges from the inherent nature of rule based programming, i.e. the basic program coding unit is the rule. Unlike other forms of programming, forward chaining rules do not facilitate any functional or procedural abstraction.
The highest level of abstraction is a single rule. We will call these rule-unit problems. This abstraction issue results in serious problems with control. For example, taking rules from the existing rule set can have apparently no effect on how the program runs, and frequently it is not easy to predict which rule will fire next. This is because rules are an unordered, declarative way of expressing knowledge, and by their very nature are inherently non-procedural. The rule-unit problems listed above can lead to buggy programs. An antidote to these problems is to provide a transparent execution model. However, this is just where the other class of problems arise.
The second class of problems arise from the typical manner in which rule execution is presented to the user, which we call problems with execution transparency. There are two ways one might wish to view a program in order to debug it. In a coarse grained (high-level) view, one requires some idea of the overall pattern of execution of the rules in the program. From a fine grained (low-level) point of view, one requires detailed information about unification, instantiation and the state of working memory. Both of these views are required and if either is absent, one of two difficulties may occur. First, without a coarse-grained view of execution it is very difficult to pinpoint the part of the execution space in which a bug has occurred. Second, without a fme-grained view of execution, it is impossible to answer detailed questions about why a certain rule did not fire in a certain cycle.
2.2 Previous Attempts to Address Problems
Two main approaches have been used in the past to present the execution space of rule systems: text based traces (e.g. OPS5, Forgy, 1981) and tree based traces (Fickas, 1987; Lewis, 1983; Mott & Brooke, 1987; Poltreck et. al., 1986; Richer & Clancey, 1985; KEE™, and NEXPERT™).
Both tree and text based traces provide a medium-level view of forward chaining. Generally they do not display fine-grained information such as which conflict resolution strategy ruled out a particular rule instantiation, or why a particular rule failed to fire in a particular cycle, yet both types of traces are too detailed to be considered coarse-grained (a plain scale-factor 'zoom out' is not the same as a coarse-grained view).
Text based traces are difficult to read, because the different types of information displayed are not immediately distinguishable (e.g. information on which rules fired, the state of working memory and the state of the conflict resolution set). The display provides little (via indenting) or no information on the overall shape of the execution space (coarse-grained information). Typically the user, who has a specific query, is given a large amount of information at once, most of which will not be appropriate to the query.
Although tree-based traces are suitable for backward chaining, we believe that they are not appropriate for displaying the execution of forward chaining because the dependencies among forward chaining rules are frequently temporal as well as (or indeed instead of) logical. For example, ruleA may fire and add many things to working memory, one of which causes ruleB to fire immediately, but it can be very awkward to consider ruleA a logical 'precursor' or 'subgoal' of ruleB (and therefore display it with a special link from ruleA to ruleB), precisely because of the 'spreading' effects of all of the other rules which ruleA may have triggered. It is in the realm of this 'spreading' effect that the limitations of graphical forward-chaining rule tracers such as TM TM the ones used by KEE and NEXPERT become apparent. We therefore opt for a metaphor which is not tree-oriented, as described next.
2.3 The TRI Approach
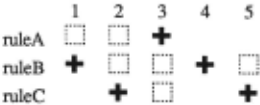
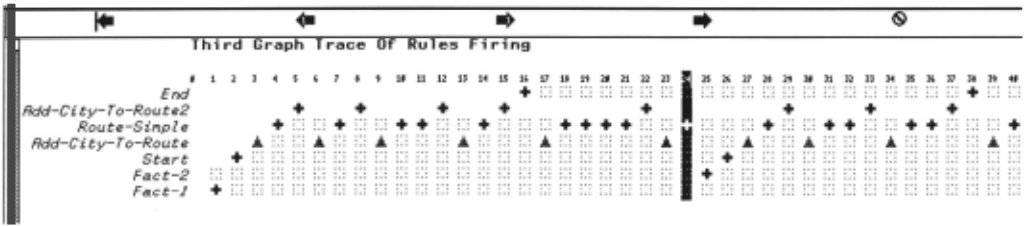
Our solution to representing the coarse-grained behaviour of a forward-chaining rule interpreter is to have an explicit representation of the time dimension, based on a 'musical score' metaphor (cf. VideoWorks™, 1985). Each rule is analogous to a particular musical instrument, and the the individual execution cycles of the rule interpreter correspond to 'beats' or 'measures'. A simple example is shown in figure 1.
Given the style of display shown in figure 1, we can then provide facilities for the user to 'replay' execution, or to focus on particular moments of time and then to examine the [me grained view to answer particular questions.
The issue of what to display at a fine-grained level is much simpler (e.g. variable bindings, working memory contents), and in many ways has been addressed already by generations of textual-based tracers for production systems such as OPS5. However, TRI provides two novel extensions to earlier (textual based) fine-grained displays:
- high selectivity: the user can select elements for fme-grained viewing in a range of ways, depending upon the time, the rule, the working memory pattern, or any combination;
- synchronization with coarse-grained view: both views can be presented simultaneously, so that as the coarse-grained view is manipulated (e.g. 'played forward'), the fine grained view changes appropriately.
3 SCENARIO
3.1 The Rulebase and Desktop
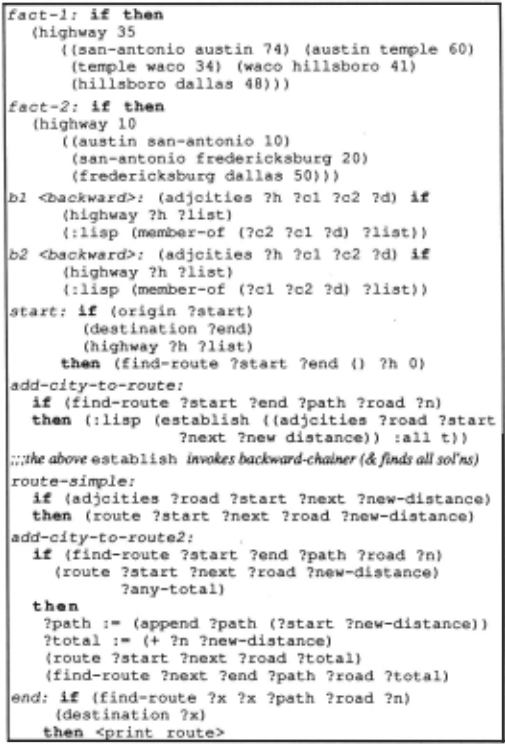
Suppose that a TRI user has loaded a rule base based on Poltreck et. al. (1986), which finds all the routes between two cities. The rules, shown in figure 2, are forward-chaining, with the exception of bland b2, which are backward-chaining.
The rules were run with initial working memory' ((origin austin) (destination dallas)) producing the output: Highway 35: Austin -> 60 -> Temple -> 34 -> Waco -> 41 - > Hillsboro -> 48 -> Dallas {Mileage: 183} Highway 10: Austin -> 10 -> San-Antonio -> 20 -> Fredricksburg -> 50 -> Dallas {Mileage: 80}
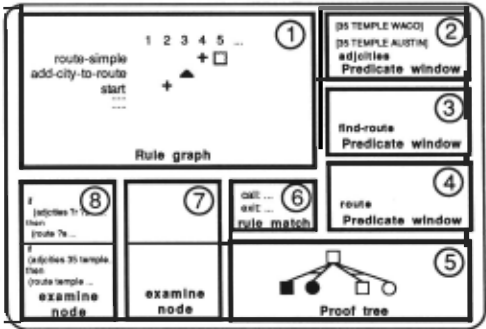
The user then examines the execution history and after a few operations, the TRI 'desktop' is in the state shown in figure 3. For clarity of exposition, figure 3 is only a schematic showing in outline form the contents of 8 separate windows. Only window 1 is displayed initially, with the rest being generated on demand to satisfy specific user requests. Details of specific windows are described in tum below.
..
3.3 Fine Grained Views of the Execution
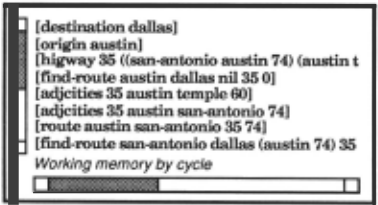
TRI allows the user to view slices of the execution in detail. The full contents of working memory at any particular cycle can be shown in a separate window. For example, the state of working memory at cycle 24 in the current example is shown in figure 5 (not part of the user's desktop in figure 3). This view window can be tailored to show the rules, predicates, or fuing instantiation for a chosen execution cycle. Indeed, any number of tailored variants of the window can be displayed at once.
A more specialized slice of working memory is chosen by selecting some predicates from a menu and then selecting the current cycle by clicking on one of the numbers in the rule graph. The predicate of a working memory pattern is the first part of the pattern, so foo is the predicate of the working memory pattern [foo x y z]. Windows 2, 3, and 4 (called predicate windows) at the right of figure 3 show three slices of working memory for the three predicates adjcities,find-route and route. Each predicate window shows all the working ~emory patterns present at the current cycle, for the predicate. F1gure 6 shows the actual appearance of window 2 in detail.
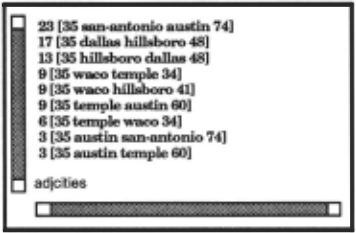
The predicate has been omitted from each of the displayed working memory patterns as it is redundant (it is displayed as the title of the predicate window). The number before each of the patterns is the cycle during which the pattern was deposited in working memory. Each pattern is mouse sensitive, enabling either the relevant node in the rule graph to be highlighted, or a more detailed description of the pattern to be displayed.
3.2 Providing a Coarse-Grained View of the Execution
The coarse-grained view is provided by window 1 (the rule graph frame) in the top left of figure 3. As well as an abstract view the rule graph frame provides two other facilities:
- the ability to focus on various a slices of the execution space in detail,
- the ability to replay the execution.
The actual appearance of window 1 is shown in figure 4.
The largest pane in the rule graph frame shows a graph of the execution history, which we call the rule graph. The rule graph enables the user to view around fifty rules for fifty cycles at a glance (this could trivially be increased to one hundred cycles by decreasing the inter-cycle gap). Horizontal and vertical scrolling extend the practical limits to hundreds of rules and hundreds of cycles. TRI allows the user to collapse any set of rules into a single row, allowing robust forward chaining rules to be 'black boxed' away. Each row represents the execution space of one or more rules with each of the symbols indicating a particular type of event happening to one instantiation. Each set of rules contains a corresponding set of instantiations (the set of instantiations created from working memory and the set of rules). The symbols denote the following:
A -one of the instantiations in the set fired and backward chaining occurred,
+ - one of the instantiations in the set fired, and
L .. ! - at least one instantiation entered the conflict resolution set and none of the instantiations in the set fired,
Where there is no symbol, all of the rules in the set failed to match against working memory and no instantiations were created.
The rule graph presents a picture of the overall 'shape' of the execution; we can see clumps consisting of a A followed by two + s on the line immediately above and we can also see two diagonal lines consisting of+ A++. A regular user of TRI would recognise these patterns as cliches in the program and would be able to notice missing 'friendly' cliches and spot unwanted 'unfriendly' cliches. The rule route-simple fires immediately after the rule add-city-to-route, sometimes firing once and sometimes firing several times in succession. The rule add-city-to-route2 always fires immediately after the rule route simple has fired one or more times. The rule fact-I which deposits facts about highway 35, fires fust, the rulefact-2 which deposits facts about highway 10 does not fue until after the rule end, which prints a route, has fired. The rule start fues only twice, each time immediately after one of the fact rules have fued. We see that the rule graph provides answers to coarse grained questions such as "When is a rule is likely to fire?", "Which rules fire together?". This sort of information is not
readily available from text or tree based traces.
A slice of the conflict resolution set is chosen by clicking on one of the nodes in the rule graph. Windows 7 and 8 at the bottom left of the figure show two slices of the conflict resolution set. Figure 7 shows the actual appearance of window 8.
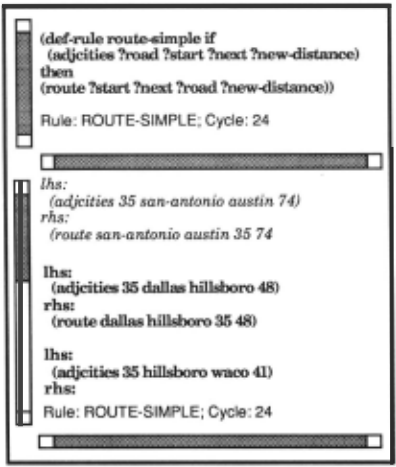
Each frame (called a node examination frame) has two components. The top part of the frame contains the definition of the rule; the bottom part shows all the instantiations the rule had in the conflict set. This allows easy comparison of the instantiated rule with the source code. The bottom left frame
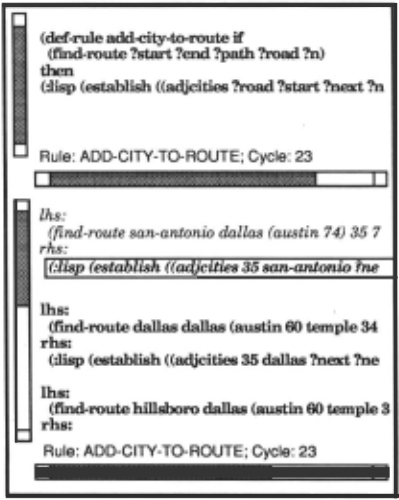
was created by clicking on the + node in cycle 24 in the rule graph; it contains all the instantiations in the conflict resolution set at cycle 24 for the rule route-simple. The top instantiation is in italics indicating that this instantiation fired in cycle 24. Each instantiation is mouse sensitive, allowing operations such as displaying or editing the deleting conflict resolution strategy. The second node examination frame (window 7), shown in detail in figure 8, was created by clicking on the triangle under the number 23 in the rule graph.
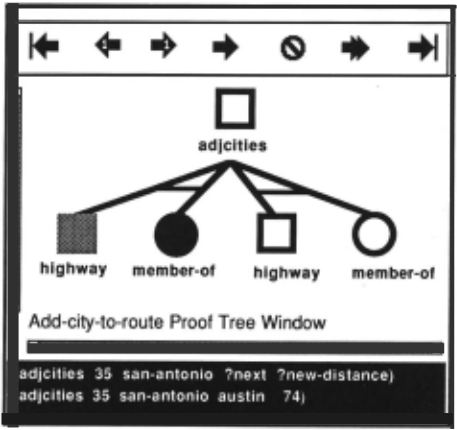
We can see that the top (firing) instantiation is in italics. We can also see that the first (and only) clause in the consequent of the instantiation is in bold. The holding indicates that, when the rule fired, backward chaining occurred. Clicking on this clause displays the proof tree, shown by the bottom right frame in figure 3, and in detail in figure 9.
The tree represents the execution history of backward chaining rules. Each node in the tree corresponds to a goal, which may or may not have been successful, within the execution. The display of proof trees is based on the Transparent Prolog Machine (Eisenstadt & Brayshaw, 1988): a white node indicates a success; a black node indicates a failure; grey indicates 'succeeded earlier but failed on backtracking'; circles indicate calls to primitives or Lisp functions. It is possible to abstract the tree both by zooming out (it is possible to zoom in again, as has been done in figure 9) and by collapsing a predicate. When a predicate is collapsed the subtree of the predicate is not shown, allowing robust backward chaining rules to be 'black boxed' away, facilitating the display of thousands of nodes in a large proof tree.
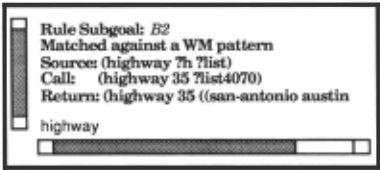
Each node in the tree is mouse sensitive. Clicking on a node displays more detailed information (as can be seen in window 6 above the proof tree in figure 3) including: the rule the goal was called from; the source code version of the call; and the actual call, in which variables are likely to have been renamed. A screen snapshot of window 6 is reproduced below as figure 10.
3.4 Replaying the Execution
The execution can be replayed using the replay panel (the menu containing the symbol 1.- in figure 4). Using the replay panel the user can choose to single step forwards or backwards, or to replay the history. As the execution is replayed, each cycle column in the rule graph is highlighted in turn (like a player piano roll) and all the currently displayed fine-grained views are updated. Each of the fine-grained views acts as a measuring device, providing very detailed information on a specific part of the execution.
4 Assessing TRI
4.1 Temporal dependencies vs. logical dependencies
The key insight underlying TRI has been the emphasis on temporal dependencies during forward chaining, providing in essence a 'musical score' metaphor for the coarse-grained view. This contrasts directly with an emphasis on logical dependencies, the display of which relies typically on a tree/net;1ink metaphor. It would be foolish for TRI to ignore logical dependencies, especially in those cases where they are highly meaningful to an individual user, or simply more appropriate in a particular context. Therefore, TRI facilitates the display of logical dependencies in three ways: (a) the dependency between any working memory element (as shown in a specific 'predicate window', for instance) and the rule which was responsible for depositing that element can be highlighted by the user with a single mouse-click on the chosen working memory element, resulting in a 'blink' of the'+' symbol at the appropriate 'culprit' spot in the rule graph display; (b) a dependency tree for any working memory element, including ones deposited during forward chaining, can be displayed upon request-- the appearance is that of an AND/OR tree much like the one we use for backward chaining; (c) the backward chaining proof tree itself is of course a tree of logical dependencies, made easy for TRI because of the restriction that backward chaining rules be expressed (like Prolog) as pure Horn clauses.
Logical dependencies have been de-emphasised in this paper, because AND/OR trees are not new. Clearly, the individual user needs to have the freedom to choose the right abstraction for the right purpose, and that is precisely the mixture that TRI was designed to provide.
4.2 Scaling up to large programs
The acid test of a tracing/monitoring environment is its performance on real programs. TRI is used daily on the KEATS-II project, and its very conception and design is meant to facilitate the handling of very large programs. Some recent runs of TRI in KEATS-II (which mostly uses frames rather than rules) yielded the following statistics:
Number of rules: 100
Number of working memory elements: 93
Number of competing rule instantiations on a given cycle: 108
Number of forward-chaining cycles: 150
Number of backward-chaining 'history' steps: 4388
Number of nodes in backward-chaining proof tree: 199
The large number of backward-chaining 'history' steps is due to the detailed record of backtracking which is kept by TRI, where a 'step' corresponds to a 'call', 'exit', 'fail' or 'redo' operation analogous to those of Prolog.
The following features enable TRI to scale up to large problems:
- Clear conceptual distinction between coarse-grained and fine-grained views: the abstractions provided are genuinely different, not just those obtainable via physical 'scale factor' zooming.
- Chunking of rules into sets: entire rule sets may be 'expanded' and 'collapsed' in the left-hand column of the rule graph display, analogous to the operations of a hierarchical file directory browser. Chunking can be provided automatically, according to rules which co-exist in separate 'rule contexts', or manually, at the user's discretion. This allows the aggregate behaviour of many hundreds of rules to be seen at a glance.
- Collapsing of details into one node: in the backward chaining proof trees, entire sub-trees which are either un interesting or too space-consuming can be collapsed into a single node, which itself may be expanded and explored in a separate window. This enables trees with thousands of nodes and tens of thousands of execution steps to explored in a meaningful way.
- Global view: The coarse-grained view of proof trees can itself be physically scaled (zoomed) in a separate window which provides a broader navigational perspective-- this is the 'zoom' typical of existing environments, and is therefore not new to TRI, but is provided for convenience and completeness.
Peformance overheads ofTRI's monitoring facilities are low (approximately 5% increase in execution time), which seems like a reasonable price to pay for being able to obtain a thorough view of execution for complex rule sets. The monitoring facilities can be disabled at the user's discretion. We are looking forward to future tests of TRI's power on very large rule bases.
5 CONCLUSIONS AND FUTURE WORK
In this paper we have described TRI, a ~ystem that provides a graphical explanation of both forward and backward chaining. Our main aim in designing TRI was to overcome the difficulty of providing an abstract view of the execution with easy access to low level views. Our hope is that providing the rule based programmer with these two views will greatly decrease the time taken to discover the cause of bugs. We have witnessed this informally in our lab, and are planning a series of empirical studies to demonstrate the effect in a robust fashion. A further spinoff, consistent with other ongoing work in our lab (e.g. Hasemer & Domingue, 1989), is the provision of a transparent view of the inner workings of a machine ideally suited for helping to teach rule-based programming to novices. Toward this end, we have incorporated the rule graph notation into an Open University course on Knowledge Engineering (Kahney, 1989).
We are currently extending TRI to provide information on the performance as well as the behaviour of rule based programs in a unified display. In particular, iconic metering tools are being provided for both forward and backward chaining. KEATS-II has a truth maintenance system, and TRI is being extended to show dynamically the way in which making an 'in' assertion 'out' (for instance) propagates effects through a network of dependency links. We eagerly await the results of this new research ..
@inproceedings{ijcai1989p21,
  title     = {A New Metaphor for the Graphical Explanation of Forward-Chaining Rule Execution},
  author    = {Domingue, John and Eisenstadt, Marc},
  booktitle = {Proceedings of the Eleventh International Joint Conference on
               Artificial Intelligence, {IJCAI-89}},
  publisher = {International Joint Conferences on Artificial Intelligence},
  editor    = {N. S. Sridharan},
  pages     = {129--133},
  year      = {1989},
  month     = {8},
  note      = {Tools},
  url       = {https://ijcai.org/proceedings/1989/21},
}
TY - CPAPER TI - A New Metaphor for the Graphical Explanation of Forward-Chaining Rule Execution AU - Domingue, John AU - Eisenstadt, Marc T2 - Proceedings of the Eleventh International Joint Conference on Artificial Intelligence, IJCAI-89 PB - International Joint Conferences on Artificial Intelligence PY - 1989 SP - 129 EP - 133 UR - https://ijcai.org/proceedings/1989/21 ER -Copied
Machine-readable versions of this paper, for tools and AI agents:





