
Automotive Stereo Vision Using Deconvolution Technique
Proceedings of the Sixth International Joint Conference on Artificial Intelligence. .
© 1979 International Joint Conferences on Artificial Intelligence
Abstract
A nr ~ w :~Lert·" vi:~iw1 ~;ys t .•' m us"ir'/' d••co nv o:Juti.on ted~r~ iqu e i s pr oposed . 'l' hi s :;y:;l.e m L; com J>< >S<'d of U1 e upfH:r· a nd U1< · ] owe r camerA. . By deconvolutin1' the ~ upper i mage wi t il the• "lc.1Wf'r o ne , t.lw :;y:;i.r~rn <'on:;L ru cts a h or-Lzo nt aJ sec: Lion ·im A.p:e . Af'Ler the a ut o mob il es llrt' sepa r ate d f'rom thr· ol.hf'r thin": ; ·in Lhi:> horizontal :;cc· Lion imagP. , the di . stances and r elat.iv~· v elnrit. y are mc-•as ur P d. 'l'h ·i:; :>e"mc,nl.at.ion i :; rPall:;.Pd by t h e thrcsholclinp: rroced ure wh ich utili zes tht• relaLion hl'I. Wt ·'<' n l.lic distarwc and l.hl' breadth of' the auto mobile. 'J'he expe rim e nt al result s are presented . II. i:; also :;ho wn t.h at Uw <leeonvoJul.lon l.echnlquP is able to co n st ru ct a fin e r a nd hit,her r esol ut ·iona :l horizo nt al :;"d.ion ·i ma p;e co mpared w ith a correlation technique . Alth ou gh the SN rati o o f the hori zo ntal ser:L.ion image i s inco n sjstent wi th range r eso luti o n, the possibility o f the adjust me nt between t he SN r atio and the res olution i s prese nted.
Full text extracted automatically from the PDF; figures, tables and equations may differ. The PDF is the version of record.
Automotive Ster eo Vision usin~ Deconvolut ion Te chnique
Tomomasa Sato
Automatic Control Division El ectrotechnica] Laboratory 'J'okyo, .T A. pan
A nr ~w :~Lert·" vi:~iw1 ~;ys t.·'m us"ir'/' d··convo:Juti.on ted~r~ ique i s pr oposed . 'l'hi s :;y:;l.em L; comJ>< >S<'d of U1e upfH:r· a nd U1< · ] ower camerA. . By deconvolutin1' the~ upper i mage wi t il the· "lc.1Wf'r one , t.lw :;y:;i.r~rn <'on:;Lructs a hor-Lzont aJ sec: Lion ·imA.p:e . Af'Ler the automobiles llrt' sepa rated f'rom thr· ol.hf'r thin":; ·in Lhi:> horizontal :;cc·Lion imagP. , the di.stances and relat.iv~· velnrit.y are mc-·asurPd. 'l'h·i:; :>e"mc,nl.at.ion i :; rPall:;.Pd by t he thrcsholclinp: rrocedure wh ich utili zes tht· relaLion hl'I.Wt·'<'n l.lic distarwc and l.hl' breadth of' the automobile. 'J'he experimental result s are presented . II. i:; also :;hown t.hat Uw <leeonvoJul.lon l.echnlquP is able to const ruct a fine r and hit,her r esol ut ·iona:l horizontal :;"d.ion ·imap;e compared with a correlation technique . Although the SN rati o of the hori zontal ser:L.ion image i s inconsjstent wi th range r esolution, the possibility o f the adjustment between t he SN r atio and the resolution i s presented.
l . Introduction
Tn order to avoi d the motor car acridents , it wou]d he~ Uw f'J'fectivc method tha t the driver is a:;:;isl.ecl wi Lh the warnings by a compuLer system f'or :;af'et.y. 'T'hi ~; :;y:;IJ-·m needs thP sensor s wh ich d01.PcL t r afl'ie ·~on;iitions . Men.suring the diGtanees and relative ve locity between the driver nnd the automob·i Jes a r ound him is the rno:>t basi e f'unr: Lion of' Lhese sensors . Because of' the· d Lfr.icu ILl es l.o id entify trre automobiles 1'rom oLhc· r t hin"s , tlli :-; pr·obl em has not l'nrnp I i Lc, ·ly so I v· ·d yPL. ·r t1 ·~ most. ·i mporL:l!lt kye to :-;oiV·' thi~; [H'01Jll'ffi i:; a fast. JH'Or:cesG illl-' of t.h r· hn ri ~.urd.a l :; ·,cLioll ima1~"s ar'OIIIld U1< · driver . 'l'hi:; horizontal :>ee·t.i "n imap:e c ~an bt· obt.ni n<·d by a :;l.··r·co v i ~don ( l. rj :tli/~U rntion sys Le'm ) vi a mr·a:;u rinr: UiC' value of' l.hP s hift between two ima1~es . J n orch·r Lo measure the value of thj s shift. , ma ny l.cl'lmique:; hA.VP been utiJ i.zPd ( i . P. tht· C'Orrelut"ion tPehniqw ~ l) , the Lcc:hnique wh i ··II uti 1 i:;,e'G the rha:~e s hj ft of the narrt;JW bamlwi d t.h of Llw L:tr'p:f·L Fouri e r s p<'cl.rum ;·J, ete . ) . '[!hi.B papc~r d.-·:;c: ribes !in alLc~ rnaLive l.ec:hn .i qu·· usi n1c decmlv·,·lution.
;·-1 OIJI.a i ni nr; I. h e \lor i ~.ontR l Sec:t ion Tmar;e
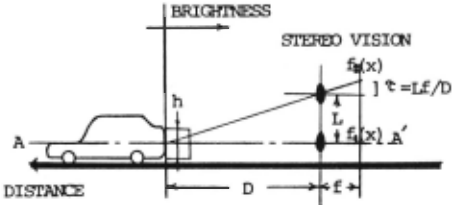
Wi U1 the stereo visi on s ystem shown by Fig . l , i L i :; possibl e to approximate the upper image t'z (x) i s Lhe shifted image of the lower one j' I (X)' J
In other word, it can be s a id that f 2 (x) is a convoluted image of f 1 (x) and 6 (x-~ ) . By measuring the value of the shift ~ ,we can obtain the distance between the target ahead and t he s ystem. Therefore , one l ine of the horizontal section image can be obtained by plotting with light and shade the corn·lati on curve, which is obtained bv CHl cnl Rt.i P"' t.h, degree of mat ching bet ween t wo images when the uppe r image is shifted r elative to the lower one . Sci nee the l owe r camrora of thi s sys t e rn always gives the front vi ew o f the targets on Ure roar! as a refe r ence imar:e , this came r a arranf':cment is suitPrl for dr-·l. ect ing the traf'f'i<· o iJ :;L :u·lf~:; .
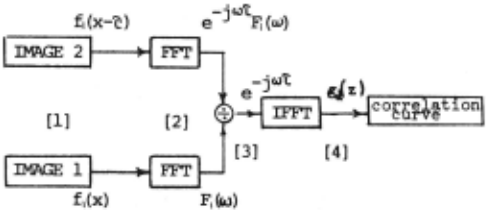
The al~orithm to obta in horizontal spct ion image is as follows. I see l<'ig. 2 ] [l] 'J'wo windowed i mages ar0 ob tained by the uppe· r and thr> lowe r cameras . rF'ig.l<(b )and(e)l [ ;>J The Fourier transformat.ions of the nbtni.ned imar;es are carried out by VJ<''l'.
wher e X refers to the length of the image. [3] By deconvoluting the upper image with the lower one , we calculate the correlation curve in the frequency domain ; G(W}.
where "a" [=30 for the following examples ] is a constant.
[4] By the inverse Fourier transformation of G(w), the ~orrelation curve g~(z) is obtained.
[ l"ig.1(n) ]
where "'\J,( (1) 2 ) is the lowest (highest ) angular-frequency of the target Fourier spectrum.
Repeating these procedures ([1]-[4]) along the horizontal right/left direction, the horizontal section image is obtained. [Fig.4(d)]
2- ? Automobiles Identi fication and Velocity Measurement
Once the horizontal section image is constructed , t he automobiles are separated from the other things by thresholding procedure which utilizes the relation between the distance and the breadth of the automobile. The result of this segmentation is presented by Fig.4(f). Finally, relative velocity is measured by processing two sequential horizontal sect i on images.
3. Deconvolution and Correlation Technique
The horizontal section image can also be constructed using correlation technique. Assuming that the brightness distribution of the vehit·lt· irnagP has n f1quare shape as shown on ~'ig. I, Lht· <:nmparizon or lhese methods are dL· r· i V<'d.
3-1 Quality of Horizontal Section Image
(a) Deconvolution Technique : Substituting Eqs.(l),(;:>) into Eq.(4) , the correlation curve gd(z) is given by Eq.(5).
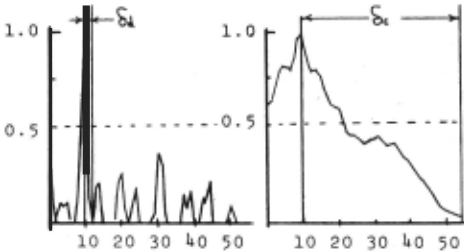
The range resolution bd[=2l~ =h /2a; Fig.3(a)] is generally small and adjustable by varying the value of "a".
(b) Correlation Technique : The corr elation curve g,( z) i s derived as follows .
The range re~olution 6c[=h ; Fig.3 and
Fig.4(d),( e) ] is generally lar~e. Comparing these techniques, the correlation curve using deconvolution has a constant shape of SINC function, and its shape depends only upon the target Fourier spectrum. On the other hand the correlation curve using correlation depends upon the target Fourier spectrum itself. Therefore, a finer (easy to process) horizontal section image is obtainable using deconvolution technique.
3-2 Effects of White Noise
When the white noise ( its power spectrum is No) is added t o the square Shaped image, the SN ratio [ the ratio of peak (matchin~ point) power to the mean noise power ] or t he horizontal section image is analized as follows 3) .
(a) Deconvolution
(b) Correlation
The ordinate represents the degree of matching. The abscissa represents the length of shift between two images. The two images are matched when the length of shift is equal to 10.
Fig.3 The shape of correlation curves.
- (a) Deconvolution Technique: SN~=3h/n:N.a (7)
- (b) Correlation Technique: SN~=2h/N0 (8) Considering OA and Eq. (7), the deconvolution technique enable us to adjust the range resolution and the SN ratio by varying "a". It is also possible to prove that the additive white noise causes no peak position error of correlation curve by any these two techniques. In the analysis stated above, the input data is assumed to be continuous. Scince real data is not continuous, the discrete calculation ( FFT ) brings the data a cyclic property. However, this effect can be reduced by windowing and filling zeroes around the input data.
4. Conclusions
- 1] A stereo vision using deconvolution technique is proposed.
- 2 ] This vision system is able to construct a finer and higher resolutional horizontal section image compared with a system using correlation technique.
- 3] It is also shown that the adjustment between
range resolution and the SN ratio of the horizontal section image is easily realized by this technique.
4] The identification of the automobiles from the other things and the measurement of the distances and relative velocity between the driver and the automobiles ahead of him are presented by processing these horizontal section image sequentially.
@inproceedings{ijcai1979p167,
  title     = {Automotive Stereo Vision Using Deconvolution Technique},
  author    = {Sato, Tomomasa},
  booktitle = {Proceedings of the Sixth International Joint Conference on
               Artificial Intelligence, {IJCAI-79}},
  publisher = {International Joint Conferences on Artificial Intelligence},
  editor    = {Bruce G. Buchanan},
  year      = {1979},
  month     = {8},
  url       = {https://ijcai.org/proceedings/1979/167},
}
TY - CPAPER TI - Automotive Stereo Vision Using Deconvolution Technique AU - Sato, Tomomasa T2 - Proceedings of the Sixth International Joint Conference on Artificial Intelligence, IJCAI-79 PB - International Joint Conferences on Artificial Intelligence PY - 1979 UR - https://ijcai.org/proceedings/1979/167 ER -Copied
Machine-readable versions of this paper, for tools and AI agents:
 Welcome
 Future Conferences
 AI Journal Division
 IJCAI Proceedings
 About IJCAI
 IJCAI Awards