Image Segmentation Technique for Locating Automotive Parts on Belt Conveyors
Proceedings of the Fifth International Joint Conference on Artificial Intelligence. Vision. Pages 694-694.
© 1977 International Joint Conferences on Artificial Intelligence
Abstract
A simple, model free computer vision program to determine the locations of non-overlapping parts on belt conveyors is described. This program illustrates a simple and effective procedure for segmenting objects from background in instances where simple thresholding of a gray-level image does not suffice. The procedure consists of a unique sequence of standard image enhancement processes. The resultant image exhibits silhouettes of the objects, which contain sufficient information for locating those parts whose orientation can be determined without observation of internal features. The technique has been implemented on a large research computer, as well as a mini-computer coupled to a prototype belt conveyor-robot arm part transfer system. The technique has been validated for a large variety of parts and belt surfaces. It can meet production rates and has the potential for actual production use.
Full text extracted automatically from the PDF; figures, tables and equations may differ. The PDF is the version of record.
1. Introduction
The problem is to sense, rapidly and reliably, the location of a variety of non-overlapping parts for automated transfer and/or assembly. These parts are often located on dirty surfaces such as conveyor belts. In the program described below, objects are extracted from the background (silhouetted) through a unique sequence of rather straightforward and standard local and global enhancement operations. The motivation for developing such a procedure follows from the realization that simple thresholding of a gray level image will not suffice for segmenting objects from their background in many industrial environments. (Others have achieved success with straight thresholding of input images where very bright flat parts appear on black belts [Rosen, 1973]). For example, Figure 1 is a 244 X 256 digitized image with 64 gray-levels, of several automotive parts lying on an old conveyor belt. Figure 2 is the same scene displayed at the optimal fixed threshold. The reader will note that several objects are not connected, and there is significant visual noise in the image. Thresholding at a different level in order to further connect some parts would result in the background merging into the other parts.
2. Technique for Locating Objects.
The segmentation process consists of edge detection, smoothing, automatic thresholding, gap filling, hole filling, and noise removal.
2.1 Edge Detection
The intent is to enhance the image by increasing the values of those pixels along the boundaries (edges) of the objects. Because of the noisy data, some edges may be detected in the background while not all real edges on the object boundaries will be. This enhancement is achieved by a gradient operator. Figure 3 illustrates the result of applying The implementation edge operators to acceptable results. the Sobel operator to Figure 1. allows any one of 12 standard be used, most of which produce
2.2 Smoothing
The objective at this step in the processing is to "remove" isolated edges corresponding to noise in the background, and to "insert" more edges along the object boundaries. This is accomplished by smoothing the data by replacing the value of every pixel with the average of the values in its 3 X 3 neighborhood. Figure 4 illustrates the result of smoothing Figure 3.
2.3. Automatic Threshold Selection
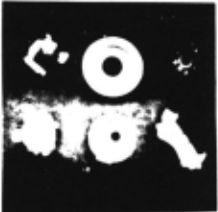
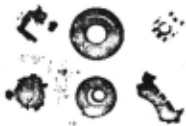
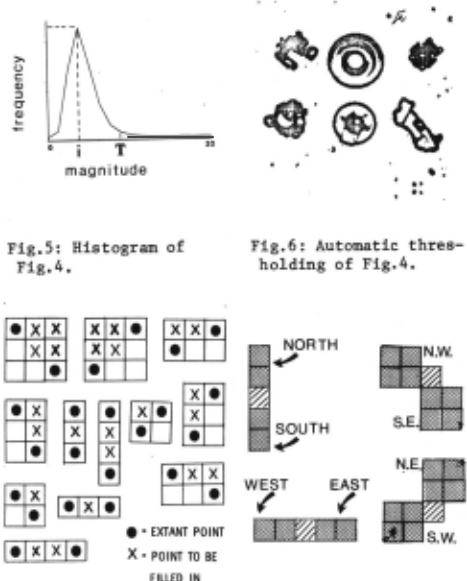
At this point the preprocessed image is made binary by thresholding. That is, pixels greater or equal to a threshold Tare set to 1, and all other pixels are set to 0. The threshold T is based on the histogram of the smoothed edge data as shown in Figure 5. Tis computed by by finding the point on the right shoulder of the histogram where the second derivative is maximum. (It was determined experimentally that this method produced consistent and acceptable results.) Figure 6 illustrates the result of automatically thresholding Figure 4. In one implementation, threshold selection is set manually once during setup, since a wide range of threshold values produces acceptable results in the preprocessed image.
2.4. Gap Filling
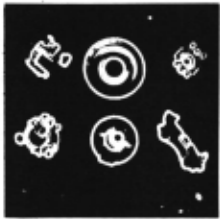
We now wish to assure that the boundaries of all parts are indeed closed in the binary image, so that they may be segmented from the background in the next step. This is done by connecting every two pixels within (a Euclidean distance of) three pixels of each other. Figure 7 shows the spatial configurations of all possible pairs of points (gaps) which we wish to connect, and the manner in which we choose to connect them. This gap filling process is performed by the following procedure: For each pixel not already equal to 1 in the image, examine its neighborhoods as shown in Figure 8. Replace that pixel with a 1 (after examining the entire image) if the condition holds that there exists at least one pixel having value 1 in each of the complementary neighborhoods North-South, or East-West, or N.E.-S.W, or N.W. S.E. Figure 9 illustrates the results of filling gaps in Figure 6.
2.5 Hole Filling through Connectivity Analysis
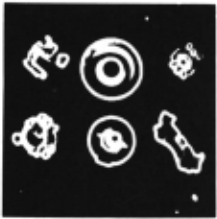
We now wish to complete the silhouettes of the parts in the image by filling in all "holes" inside connected regions. This is accomplished by 4-connectivity analysis of the scene. Regions (of O's) which are not connected to the image boundary are set to 1's. Then, the only remaining O's in the image correspond to the real background. Optionally, at this time, regions touching the image boundary (not completely in the field of view) or of less than a specified size (noise or other regions not corresponding to expected objects) may also be removed (set toO's). Figure 10 illustrates the results of filling holes and removing very small regions in Figure 9. The reader is referred to Kelly [1970] for an algorithm for efficiently labeling 4-connected
regions in an image.
2.6. Characterization of Ob ect Location
For many objects, location position and orientation) information is easily computed from a silhouette. One way to partially characterize location is to compute the center of area and axis of minimum moment of inertia, Figure 10 illustrates this result.
2.7 Detecting Moving Parts
A method for determining when to process an entire image from a moving conveyor belt has been developed which is based on searching for significant edge activity in a portion of the image related to search time and belt velocity.
2,8 Overall System Configuration
The vision technique has been integrated into a prototype part transfer system employing a moving conveyor belt, belt position and velocity detector, and a small robot manipulator.
3. Performance
The vision program has been tested on several hundred scenes. The accuracy with which it segmented regions out of the images depended on the image resolution, objects, backgrounds, and lighting conditions. In cases where the scene violated design constraints (e.g., overlapping parts or parts almost touching) the program produced meaningless silhouettes. However, the system has the optional capability of ignoring such segmentations based on matching them to very simple models of parts expected. The system appears to be sufficiently robust for actual production line use. The speed of the program depends upon the implementation and image resolution. Meeting production cycle time requirements of several seconds, however, appears to pose no problem. The program performed satisfactorily on images of resolution 50 X 50, 100 X 100, 128 X 128, and 244 X 256, as produced by a variety of cameras.
4. References
1. M.D.Kelly, "Visual Identification of People by Computer," PhD Thesis, Stanford University, 1970. 2. C. Rosen et al., . "Exploratory Research in Advanced Automation," 1973-1976. Stanford Research Institute.
5. Acknowledgments
L.Rossol, G.Dodd, D.Hart, and N.Muench provided excellent administrative support for this project. J.Christensen contributed significantly to this effort by translating the program from PL/I (on the research computer) to FORTRAN (on the mini computer). The entire Machine Perception Group assisted in the conceptualization and implementation of the system.
F ILLEO IN
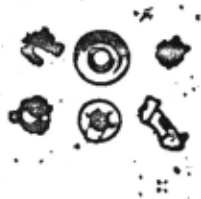
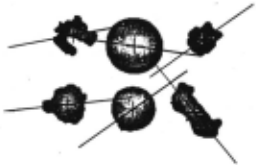
Fig.9: Gap filled Fig.6. Fig.lO: Hole filled Fig,9.
@inproceedings{ijcai1977p163,
  title     = {Image Segmentation Technique for Locating Automotive Parts on Belt Conveyors},
  author    = {Baird, Michael L.},
  booktitle = {Proceedings of the Fifth International Joint Conference on
               Artificial Intelligence, {IJCAI-77}},
  publisher = {International Joint Conferences on Artificial Intelligence},
  editor    = {Raj Reddy},
  pages     = {694--694},
  year      = {1977},
  note      = {Vision},
  url       = {https://ijcai.org/proceedings/1977/163},
}
TY - CPAPER TI - Image Segmentation Technique for Locating Automotive Parts on Belt Conveyors AU - Baird, Michael L. T2 - Proceedings of the Fifth International Joint Conference on Artificial Intelligence, IJCAI-77 PB - International Joint Conferences on Artificial Intelligence PY - 1977 SP - 694 EP - 694 UR - https://ijcai.org/proceedings/1977/163 ER -Copied
Machine-readable versions of this paper, for tools and AI agents: