
The Evolutionay Process of Randomly Growing Mutated Digital Structures as a Model of Evolution of the First Living Organisms
Proceedings of the Second International Joint Conference on Artificial Intelligence. Pages 148-157.
© 1971 International Joint Conferences on Artificial Intelligence
Abstract
The paper presents the results of research concerning the stability of an evolutionary process for randomly growing digital s true tures. The computer model for the mutated genotype case is considered. The genotype (in the model: the set of rules for growth) changes in a random environmentally u.noriented way, whereas the environment assumed as random, finite and repetitive in a cyclic way is disturbed. From the experiments it follows that stability could be achieved in a heuristic way after mutation of the genotype and disturbances in the enviro.o.ment without the built- in information concerning stability. The model, results obtained from the computer end an interpretation of these results are presented.
- K.R. Fialkowski, Cyclic Behavior of Randomly Growing Digital Structures in Finite Random Environment (Proc. of Int. Joint Conf. on Artificial Intelligence, Washington D.C. 1969, pp.347-359) IJCAI
- K.R. Fialkowski, Final Report for the Ford Foundation 3. L.J. Fogel, A.J. Owens, M.J. Walsh, Artificial Intelligence through Simulated Evolution (J.Wiley, 1966)
References were extracted automatically from the PDF and may contain errors.
Full text extracted automatically from the PDF; figures, tables and equations may differ. The PDF is the version of record.
Introduction
For the case without spontaneous mu tations it was shown in a previous pa per (1) that with the assumption of random environment cbaogi.D.g in a cy clic way, the digital structures,which could be a model of very simple organ isms ceo grow, divide and achieve a stabile "shape" (phenotype) in spite of the fact that the built-in informax) These computer e~eriments were sup ported by a grant from the Ford Found tion (genotype) does not determine the phenotype in detail, but o.o..ly gives "frame" i..lltormation about the pheno type. Full information to guarantee the stability is achievable from the cyclic enviro.o.ment.
In real life, however, it is not sufficient to achieve stabilitr.y. Sta bility must be ma.iJltained in the pres ence of the mutations. Under these con ditions the organisms must survive and divide. The cbai.D. of survivals end di visions gives the evolutionary se quence (in each generation only one organism is taken into consideration). This sequence could in each generation be ended by the unsuccessful growth and death of the current element of sequence. That case is called the "de- · generation" of the sequence. Sometimes however the evolutionary sequence and lihe enviroJlJUnt are in eynam.ic balance, and then degeneration does not happen. The balance (if it exists) could be broken by:
- disturbance of the environment (the case discussed in (1))
- mutation, which changes the geoo tr.ype (the case discussed in this pa per).
The second case is important, as the cbangable genotype means develop men t, increase of complex:i. cy, end evo lutionary progress.
M o d e 1
1 · Pheoo t:ype growth and division ·
The phenotype is called in the mo del a Digital Structure: DISTRUC.(1). Definition 1.
A Digital Structure,DISTRUC, is a sequence of positive, integer numbers
The numer I is called the length of DISTRUC.
Definition 2.
The sequence of DISTRUCs created in the recursive growth and division process is called an Evolutionary Sequence: ES.
Each DISTRUC in ES has its genera tion number g, used as an index. The Initial Basic Structure, IBS'J:HUC has g = 0. IBSTRUCs are always the same for all ES (as the result or an as sumption concerning the common origin of lite).
Definition 3.
The growth process is the process of non- decreasing change of c 1 val ues performed in the discrete moments of timet, t:0,1, ··· ,T (measured in discrete time units: DUT), according to the following equation:
for all g, g = 0,1 ,2, ···
where: R is a random number, and F has value 1 or 0 according to the set of rules of growth shown further.
For all g, the growth process starts for t = 0. For t = 0 DISTRUC is called Basic Structure: B.ASTRUC. IB.STRUC is BASTRUC for g = 0. IBS'.rRUC is denoted
as:
c1,o,o= 1
c2,0,0 = 2
c3,0,0 = 4
Generally BASTRUC is denoted as:
C ci) O,g The growth could be finished in a one of two ways:
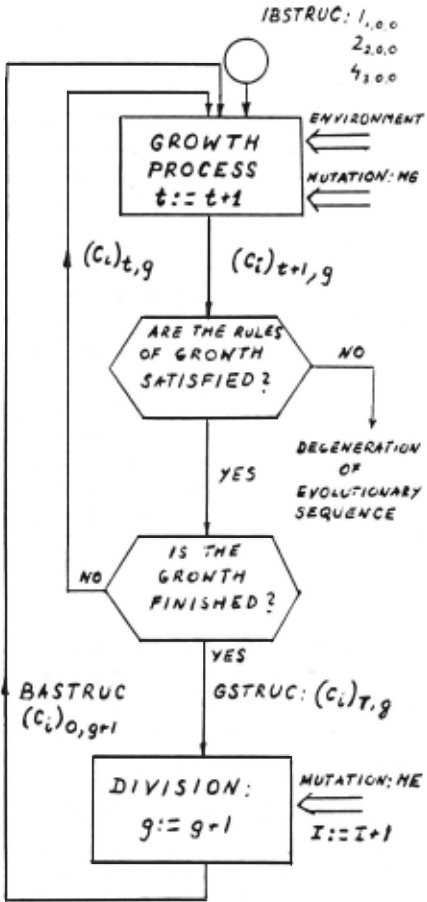
- If the growing DISTRUC satisfies the rules of growth, the growth is successfully finished after T DUTs. Then DISTRUC is called the Grown struc ture: GSTRUC. T is called the life ti..m.e of DISTRUC.
- If the growing DISTRUC does not satisfy the rules of growth, the DIS TRUC "dies" after Td DUT. This is cal led "degeneration" and Td - the degene ration ti..m.e.
In case 1. GSTRUC divides into two BASTRUCs of the next generation (but only one of these two is taken into the further growth process and its his tory recorded). The division is per formed in the following way:
for i = 1 , 2 , 3, ··· , I , where E is the Entier function (for positive numbers, the integral part of the number).
The above given definitions are sum med up on the fig.1.
2. Genotype and the rules of growth
The genotype contains:
the Basic Genotype : BG
the Stability Treshold : ST
the Length of DISTRUC : I
the Interval of Regular Growth: D
Definition 4.
Basic Genotype: BG is a sequence of positive, real (in the ALGOL sense) numbers:
Each BASTRUC of g's generation has BG determined as:
For IBSll\UC ( Gi) O, 0 is assumed to be:
for all experiments.
Definition 5·
Stability ~·reshold: ST is a s~queoce of positive, real (in the ALGOL sense) numbers:
For all experiments presented in this paper (Ai) bas constant values:
The Length of Structure: I was de fined before. For IBSTRUC, I= 3.
The value of D is constant for all experiments presented in this paper, D = 0.5
'fhere are two indicators of the growth process: V and F (see eq. 1 ) · Both of them have value 0 or 1.
The values of indicators are deter mined for each t in the following way:
where :
4
q j = 1 otherwise q =0 for j=.3,4, ··· ,I, E is En~er :f\alc.
for j=4,5, ··· , I, E is Entier :f'wle.
For each t, as long as V =1, the growth process is continued accordi.c.g to eq. 1 Then F is determi.c.ed as follows:
If for certai.c. t value V becomes equal to zero (V =0) the growth process is stopped, and it is the "degeneration" case.
3. Mutatio.c.s
In the presented model there are two ki.c.ds of mutations:
1. BG · s muta tiona: MG, which change the value of (Gi)
2. ~'xpanding mutations: ME, which cha.c.ge the value I.
rloth of them according to the gene ral theory of evolution are neither enviro.c.mentaly, or DISTRUCtly oriented.
MG occurs once for the determi.c.ed period of time i.e. given experiment (e.g. once for 15 000 DUTs). It changes one randomly choosen value of ( Gi) during the growth process, and the process is continued according to the rules following from the new value of BG. This change is performed by adding to one randomly choosen Gi value the random number from the random generator.These random numbers are equally distributed from the range: -1.0, 1.0.
Sometimes the randomly choosen Gi(e.g. G 8 for 1=5) does not exist i.e. the given genotype. Then the mutation does not occur.
ME can occur during each division (see fig.1). It occurs if, and only if:
where:
The value P is called tne Expanding Coefficient: EXC.
If ME occurs, the DISTRUC changes its length and then:
The value of the newly created Ith place is determi.c.ed as follows:
3. Ellviro.c.men t
The basic assumptions concerning the environment were gi ve.c. ill ( 1). I.e. all experiments the environment has been simulated as a sequence of 500 raD dom numbers taken from the random number table used ill the repetitive, cyclic way. The disturbances of the environment were simulated as skips of several ( usualy one) numbers i.e. the sequence.
I.e. the model, for the given experi ment, the disturbance occurs once for the determined period of time, on the
same basis as MGs.
Experiments and Results
The experiments presented here were the continuation of the research,which has been started from so called'~ersion zero" presanted in (1).
In contradistinction to the "version zero" all further versions were written in FORTRAN IV for IBM 360/50.
- "first version" was the modifica tion o:r "version zero" for IBM 360 with the extension of possible length of DISTRUC to I = 23.
- "second version" was the intro duction to "first version" of the timing and the automatic perturbation of the environme.o t.
- "third version" was the introduc tion to the "second version" of the mutations subroutines.
- "fourth version" was the intro duction to the "third version" of limi tations for the expansion of structures (the way of savicg CPU time) and auto matic modification of the stability threshold (not used in experiments pre sented here).
For experiments presented here only the "fourth version" was used. The "fourth version" had two program reali zations: Fourth ~ and Fourth B. Usualy Forth A was used as an experimeJltal group, whereas Fourth B was a control group (in the same way as in the biolo gical experiments). The estimated number of observed generations is 50 000. The average life time for one generation is app. 600 DUTs. The single experiment lasts 0.5 x 10 6 or 10 6 DUTs.
By analogy, if one assumes tlia t 1 DUT is equivalent of 1 second, then the life time of average DISTRUC is 10 minutes, which is a satisfactory approximation for very simple organisms. In this scale the single experiment lasts app. 6 days and all experiments are equivalent .to over one year of constant observation.
The results are presented on the three hierarchical levels:
1. Level one (the lowest)
The level one (presented on fig.2) is an example of direct graphic record of an experiment. The evolutionary se quence presented on fig.2 develops in the stabile environment (without the disturbances) and under the influence of both types of mutations (MG and ME).
The generation number g is on the abscissa (g=O indicates IBSTRUC). The arrows under the abscissa indicate MG mutations. For the experiment the dis tance between two successive MG muta tions is 10 4 DUT. The phenotype is presented as a dotted set of values for given g value. (Always BASTRUC ci,Otg) is presented on the diagrams. For these experiments max I= 9). The smooth line is T(g), (the life time). The phenotype values and the life time values are presented on the same scale. The P(g) (expanding coefficient, the upper part of the diagram) is presented in another scale and the stability treshold(dashed, constant value line) is drawn there. The presented diagram is a part of the ex periment named: 1106 Fourth B (for the detailed data of this experiment see level two).
Starting from IBSTRUC, after the sin
gle expansion (ME s effect) a nonperiodic sequence exists till the 8th gene ration. In the 9th and 10th there are two MEs (the effects are visible in the very next generation and marked "x" on the diagram). The I value becomes equal to 6. The next two MEs occur in 13th and 14th generations and one in 16th · After that I is equal to 9. From the 18th generation the periodic sequence, described in (1) starts, with a period equal to 10 (see periodic changes of '1'(18) to '1'(29)). All the phenotypes are the same, but they have different life times. The MG mutation occurs at the end of life of the 29th generation. ~ccording to the record it changes the G 5 value of BG from 2.00 to 1.?6. It does not influence BASTRUC of the 30th generation (which has been already de termined by GSTRUC nearly completely formed at the time of MG), but influ ences the growth of DISTRUC in 30th generation. As only BASTRUCs are re corded the effect of MG are visible in the BASTRUC of 31st generation. The new, most probable phenot.ype is statisticaly smaller, than the previous one, but is not exactly determined and one can see other values of the phenotype (other "shapes") in 33rd, 43rd and 49th gene rations (the last two are larger than the phenotypes before MGG). The se quence is nonperiodic.
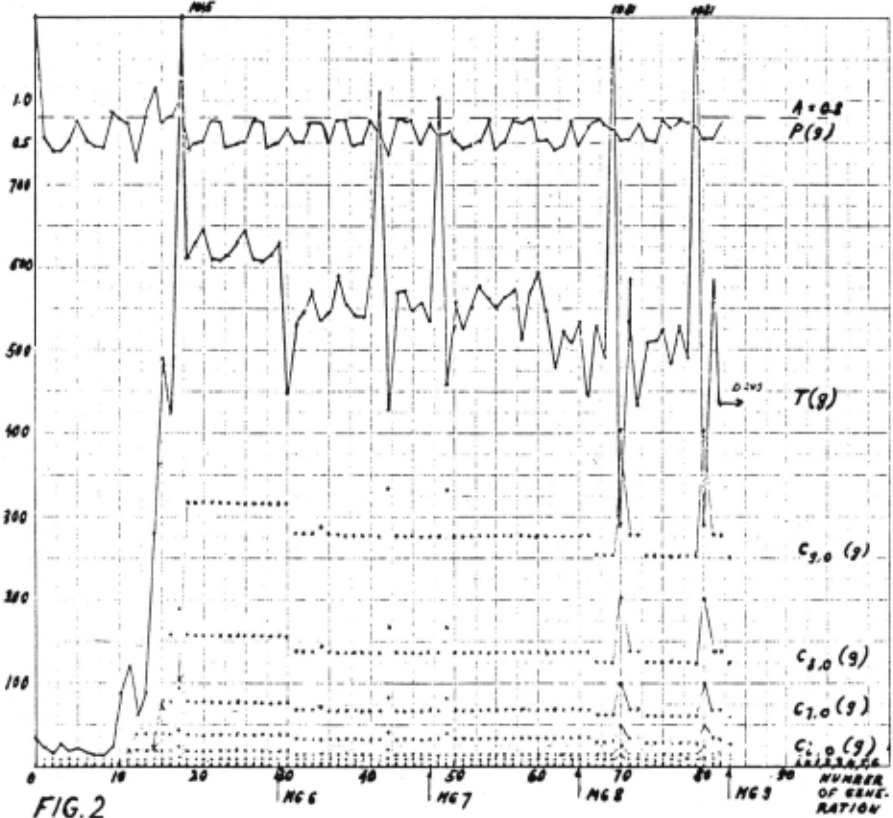
MG7 does not change anything. It changes G 9 value from 2. 00 to 1. 99 and that has no visible influence on the growth process.
MG8 changes (accidentally the same as MGG) the G 5 value from 1.76 to 1.61.
This causes a further statistical decrease of phenotype values, with some exceptions in the 70th, 71st and 72nd generation. From the 69th generation a periodic sequence starts with the period equal to 10. This d;ynamic balance is broken in the 84th generation by MG9. !ccording to the experimental records, it changes the G 7 value from 2.00 to 1.21. The DISTRUC of 84th generation does not finish its growth. The MG9 de generates the sequence.
From the record of the experiment it follows that the DISTRUC of the 84th generation "dies" with the "shape" ( ci) = (2, 4, 9, 19, 31, 63,127 ,255,407) with c 10 = 171 after 299 DUTs.
2 · Level two ·
F1g.3 presents two histograms, which are the ~ecords of the two different experiments:
- !) upper part ( 1006 Fourth B, lasted 0.5x10 6 DUT/42 min. 37 sec. of IBM~ CPU time).
- lower part (1106 Fourth B, lasted 0.5x10 6 DUTs I 37m1n. 46 sec of IBM 360150
CPU time). The part of this experiment was presented as fig.2 for level one.
On fig. 3 the numbers of MG ·s muta tions are on the abscissa. The number of generations observed between two successive mutations are on the ordi nate. The expanding sequence (the ef feet of m;'s mutations), the periodic and the nonperiodic sequences are dis tinguished. In the experiments, imme diately after the degeneration of one sequence a new sequence starts from the IBSTRUC what is marked on the diagrams by "_" · The time between the two sue cas .t.W 's mutations ls 10 4 DUTs (the abscissa 1s scaled with MGs or with the 10 4 DUTs).
The sequence of MG 8 mutations in the both cases (part A and B) is ex actly the same, as well as the other conditions. But in case A the mutation occurs together with the d.isturbance of the environment. In case B the muta tion occurs alone.
The fragment of B record between the MG5 and MG9 was presented in another form on fig.2. One can notice the ex pansions, the periodic and nonperiodic sequences described before on level one.
From (1) it follows that a nonperi odtc sequence, after sufficiently long time, can eather achieve periodic! ty or degenerate. Periodic sequences are not interesting for the experiments,as nothing could happen there till the nearest mutation or disturbance of en vironment. On the other side, under severe conditions a nonperiodic sequence lasts for a very short time. The condi tions for the presented experiments were not too severe (see the long non
periodic sequence at part A, fig. 3) 1
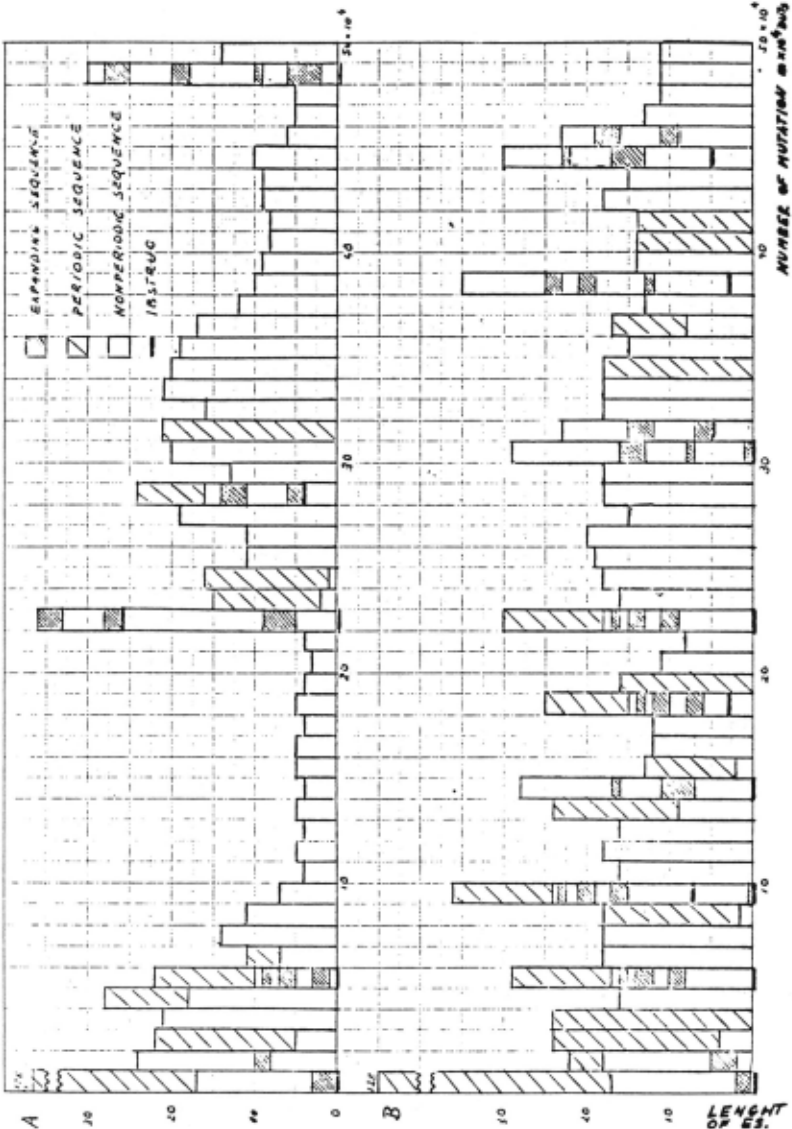
and the freque.nce of IIG 's repetition was chosen high enough !or a periodic sequence .not to be too probable. One ca.n .notice that the degenerations are more frequent 1.n case B. To determine the probability of degeneration, the de generation coefficient d will be i.ntro duced.
For the give.n experiment a.nd the give.n period of time the d value is counted by dividing the .number of .no.n spo.nta.neous degenerations by the .number of IIG 's mutations. For the A a.nd B case the d values are:
d.A = 5/50 :0.1 ' ~ = 10/50 = 0.2 ( i.n each case o.ne spo.n ta.neous degenera tion was observed, for A between IIG48 and 14G49, a.nd for B between 14G9 a.nd 14010).
The experiments presented o.n fig.3 are rather typical. There are other records e.g. 306 Fourth A with the para meters of the process the same as for 1 006 Fourth B , where d = 0. C1l4.
From the computer experiments pre sented here a.nd considered it follows that the probability of degeneration for evolutionary sequences increases whe.n the mutatio.n.s occur w i t h o u t the disturbance of the environment.
3. Level three.
O.n the !1g.4 the degeneration cases for the five different experiments are presented. The experiments .named: X, Y, Z ,P a.nd Q have the followi.ng charactel' istic:
X: 2805 Fourth A , lasted 10 6 DUTs ( 1 hour, 11 mi.n. 45s. of CPU time) Yz 2905 Fourth B', lasted 10 6 DUTs ( 1 hour, 14 m1.n. 58 s. of CPU time)
Z: 2?05 Fourth B, lasted 10 6 DUTs (1 hour, 12 Jlli.n. 58s.of CPU time)
P: 2905 Fourth B, lasted 0.5x10 6 DUTs (40 mi.n. 2?s.of CPU time) Q: 3005 Fourth A, lasted 0.5x10 6 DUTs (38 mi.n. 23s.of CPU time)
!
'
i
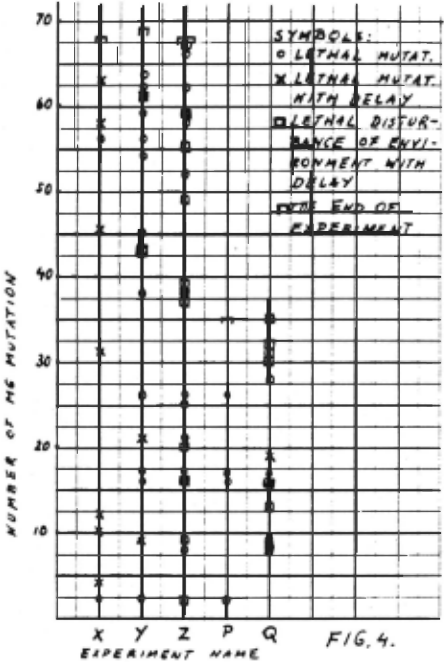
For all these experiments the time period between the two successive MGs mutations, or two successive disturbances of the e.nviro.nme.nt was 1.5 x 10 4 DUTs ·
From the detailed records of the ex periments it follows that:
1. If the mutation is lethal for se quence it is usualy lethal i.n the very next generation (see marks without de lay on fig.4)
2. If the dis turba.ace of the environ ment is lethal for the sequence it is usualy lethal after several generations (see fig.4).
From that it follows that the phase shift between the mutation and the dis turbance of the environment could be an important fact9r, which influences the probability of degeneration.
The phase shift factor is counted as:
where: k is the phase shift factor t(MG(j»,t(EP(j)) are the times when MG 's mutation of number j, or disturbance of the environment of number j occur.
The d coefficient could be counted for all degeneration cases, or for the degenerations caused by MGs only. The second will be denoted as <1.1G · From fig.4 the k factor, d coefficient and dw .. coefficient could be determine for .... '\3 t he all five presented experiments. These values are presented in the table below:
| Experiment ====================================== | k | d | |
|---|---|---|---|
| X | 0 | ? | 0.132 |
| y | 72 | 0.216 | 0.246 |
| z | 180 | 0.189 | 0.343 |
| p | 120 | 0.114 | 0.114 |
| Q | -120 | 0.143 | 0.372 |
| (or 240) |
For X the drt.G value is not determined, as the mutation and the disturbance of the environment occur in the same time and the cause for degeneration is un detectable.
From the above table it follows that the probability of degeneration in creases with the increase of the phase shift. The probability of the degenera tion is highest for the disturbance of the environment being directly preceded by the mutation ( Q experiment). are
The degenerations caused by mutation comparable for each experiment. The probability of degeneration is lowest when MG and a disturbance of the en vironment occur in the same time ( the ~ experiment is considered as nontypical and shown only as an example of the existence of such records).
Interpretation.
The presented computer model is a model of the evolution process. 'J.'he DISTRUCs being the objects of simulated evolution are abstract and are not the image of structure of any living or ganisms. But their behavior simulates the behavior of organisms, i.e., they can grow, divide and mutate. The process of evolution, the real one as well as the simulated, has as a goal: the a chievement of dynamic stability for an evolutionary sequence. In the model . stability is achieved when the periodic sequence starts. A nonperiodic sequence is the phase of searching for stability. For the given genotype and the environ ment there are many possible stabile states (i.e. periodic sequences). The examples of different stabile sequences and the different ways of finding them one can see on fig.3.
Not all of possible stabile se quences are looked up. Only one (if any) is found in the heuristic search. From the experiments follows that:
- The stabile (the same in the dif ferent generations) phenotype could be achieved after mutation of the genotype and disturbances in the environment w 1 t h o u t the built-in informa tion concerning stability. In conclu sion, the relatively simple organisms, which could only g r o w and d i - v i d e _and had no built-in information about the final "shape" could be the first living organisms, able to de velop and to complicate the structures.
- The disturbances of the environ ment were not neccessarily the des tructive factors causing the degenera tion of the evolutionary sequences.~hey could be h e 1 p f u 1 to achieve stability if they have occured in the proper "phase shift" with the muta tion.
The results presented in this paper were obtained from an abstract model of the evolution process simulated on the computer. They may be treated as indications of some problems, but for any extrapolations towards biology they should be tested in biological experi
ments.
@inproceedings{ijcai1971p16,
  title     = {The Evolutionay Process of Randomly Growing Mutated Digital Structures as a Model of Evolution of the First Living Organisms},
  author    = {Fialkowski, Konrad R.},
  booktitle = {Proceedings of the Second International Joint Conference on
               Artificial Intelligence, {IJCAI-71}},
  publisher = {International Joint Conferences on Artificial Intelligence},
  editor    = {D.C. Cooper},
  pages     = {148--157},
  year      = {1971},
  url       = {https://ijcai.org/proceedings/1971/16},
}
TY - CPAPER TI - The Evolutionay Process of Randomly Growing Mutated Digital Structures as a Model of Evolution of the First Living Organisms AU - Fialkowski, Konrad R. T2 - Proceedings of the Second International Joint Conference on Artificial Intelligence, IJCAI-71 PB - International Joint Conferences on Artificial Intelligence PY - 1971 SP - 148 EP - 157 UR - https://ijcai.org/proceedings/1971/16 ER -Copied
Machine-readable versions of this paper, for tools and AI agents:





