
Spatio-Temporal Check-in Time Prediction with Recurrent Neural Network based Survival Analysis
Proceedings of the Twenty-Seventh International Joint Conference on Artificial Intelligence. Main track. Pages 2976-2983.
https://doi.org/10.24963/ijcai.2018/413
Keywords
- Machine Learning: Deep Learning
- Machine Learning Applications: Applications of Supervised Learning
- Machine Learning: New Problems
Abstract
We introduce a novel check-in time prediction problem. The goal is to predict the time a user will check-in to a given location. We formulate check-in prediction as a survival analysis problem and propose a Recurrent-Censored Regression (RCR) model. We address the key challenge of check-in data scarcity, which is due to the uneven distribution of check-ins among users/locations. Our idea is to enrich the check-in data with potential visitors, i.e., users who have not visited the location before but are likely to do so. RCR uses recurrent neural network to learn latent representations from historical check-ins of both actual and potential visitors, which is then incorporated with censored regression to make predictions. Experiments show RCR outperforms state-of-the-art event time prediction techniques on real-world datasets.
- [Agrawal et al., 1993] Rakesh Agrawal, Tomasz Imieliński, and Arun Swami. Mining association rules between sets of items in large databases. In ACM SigMOD record, vol- ume 22, pages 207-216, 1993.
- [Ameri et al., 2016] Sattar Ameri, Mahtab J Fard, Ratna B Chinnam, and Chandan K Reddy. Survival analysis based framework for early prediction of student dropouts. In 25th ACM International on Conference on Information and Knowledge Management, pages 903-912, 2016.
- [Buckley and James, 1979] Jonathan Buckley and Ian James. Linear regression with censored data. Biometrika, pages 429-436, 1979.
- [Cho et al., 2011] Eunjoon Cho, Seth A Myers, and Jure Leskovec. Friendship and mobility: user movement in location-based social networks. In 17th ACM SIGKDD conference on knowledge discovery and data mining, pages 1082-1090, 2011.
- [Cho et al., 2014] Kyunghyun Cho, Bart Van Merriënboer, Caglar Gulcehre, Dzmitry Bahdanau, Fethi Bougares, Holger Schwenk, and Yoshua Bengio. Learning phrase representations using rnn encoder-decoder for statistical machine translation. arXiv preprint arXiv:1406.1078, 2014.
- [Cox, 1992] David R Cox. Regression models and life- tables. In Breakthroughs in statistics, pages 527-541. Springer, 1992.
- [Gao et al., 2012] Huiji Gao, Jiliang Tang, and Huan Liu. Mobile location prediction in spatio-temporal context. In Nokia mobile data challenge workshop, volume 41, page 44, 2012.
- [Harrell et al., 1984] Frank E Harrell, Kerry L Lee, Robert M Califf, David B Pryor, and Robert A Rosati. Regression modelling strategies for improved prognostic prediction. Statistics in medicine, 3(2):143-152, 1984.
- [Lee and Wang, 2003] Elisa T Lee and John Wang. Statisti- cal methods for survival data analysis, volume 476. John Wiley & Sons, 2003.
- [Li et al., 2016a] Huayu Li, Yong Ge, and Hengshu Zhu. Point-of-interest recommendations: Learning potential check-ins from friends. In Proceedings of the 22th ACM SIGKDD conference on Knowledge discovery and data mining, pages 975-984, 2016.
- [Li et al., 2016b] Yan Li, Vineeth Rakesh, and Chandan K Reddy. Project success prediction in crowdfunding envi- ronments. In Ninth ACM International Conference on Web Search and Data Mining, pages 247-256, 2016.
- [Li et al., 2016c] Yan Li, Jie Wang, Jieping Ye, and Chan- dan K Reddy. A multi-task learning formulation for sur- vival analysis. In Proceedings of the 22nd ACM SIGKDD International Conference on Knowledge Discovery and Data Mining, pages 1715-1724. ACM, 2016.
- [Liu et al., 2016] Qiang Liu, Shu Wu, Liang Wang, and Tie- niu Tan. Predicting the next location: A recurrent model with spatial and temporal contexts. In AAAI Conference on Artificial Intelligence, pages 194-200, 2016.
- [Noulas et al., 2012] Anastasios Noulas, Salvatore Scellato, Neal Lathia, and Cecilia Mascolo. Mining user mobil- ity features for next place prediction in location-based ser- vices. In Data mining, IEEE 12th international conference on, pages 1038-1043, 2012.
- [Rakesh et al., 2017] Vineeth Rakesh, Niranjan Jadhav, Alexander Kotov, and Chandan K Reddy. Probabilistic so- cial sequential model for tour recommendation. In Tenth ACM International Conference on Web Search and Data Mining, pages 631-640, 2017.
- [Rumelhart et al., 1988] David E Rumelhart, Geoffrey E Hinton, and Ronald J Williams. Learning representations by back-propagating errors. Cognitive modeling, 5(3):1, 1988.
- [Scellato et al., 2011] Salvatore Scellato, Mirco Musolesi, Cecilia Mascolo, Vito Latora, and Andrew T. Campbell. Nextplace: a spatio-temporal prediction framework for pervasive systems. In International Conference on Per- vasive Computing, pages 152-169. Springer, 2011.
- [Simon et al., 2011] Noah Simon, Jerome Friedman, Trevor Hastie, and Rob Tibshirani. Regularization paths for cox's proportional hazards model via coordinate descent. Jour- nal of statistical software, 39(5):1, 2011.
- [Tibshirani, 1997] Robert Tibshirani. The lasso method for variable selection in the cox model. Statistics in medicine, 16(4):385-395, 1997.
- [Tobin, 1958] James Tobin. Estimation of relationships for limited dependent variables. Econometrica: journal of the Econometric Society, pages 24-36, 1958.
- [Wang et al., 2018] Ping Wang, Yan Li, and Chandan K Reddy. Machine learning for survival analysis: A survey. ACM Computing Surveys, 2018.
- [Wei, 1992] Lee-Jen Wei. The accelerated failure time model: a useful alternative to the cox regression model in survival analysis. Statistics in medicine, 11(14-15):1871- 1879, 1992.
- [Yang et al., 2015] Dingqi Yang, Daqing Zhang, Longbiao Chen, and Bingqing Qu. Nationtelescope: Monitoring and visualizing large-scale collective behavior in lbsns. Jour- nal of Network and Computer Applications, 55:170-180, 2015.
- [Ye et al., 2013] Jihang Ye, Zhe Zhu, and Hong Cheng. What's your next move: User activity prediction in location-based social networks. In SIAM International Conference on Data Mining, pages 171-179. SIAM, 2013.
References were extracted automatically from the PDF and may contain errors.
Full text extracted automatically from the PDF; figures, tables and equations may differ. The PDF is the version of record.
1 Introduction
The prevalence of GPS-enabled devices such as smartphone has led to the democratization of location-based services. Location-Based Social Networks (LBSNs), such as Foursquare and Facebook Places, collect huge amount of location data for millions of individuals, making it possible to study human mobility patterns at unprecedented scales.
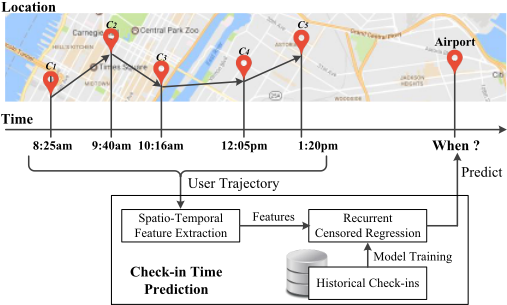
An intriguing use of location data is to predict movement of individuals, which has enormous application potential [Cho et al., 2011]. Towards the goal of thoroughly understanding human mobility patterns, we propose to leverage checkin data collected by LBSNs and aim to predict the time of future check-ins. Given a user u and a location of interest l, we want to predict the exact time when u will check-in to l in the future, regardless of whether the user has visited the location before or not. Figure 1 illustrates check-in time prediction problem with an example. A user has reported five check-ins {c1, c2, c3, c4, c5} from 8:25am to 1:20pm on a single day. Using these check-ins as observation, the goal is to predict when the user will check-in to the airport, using a model learnt from historical user check-ins to the airport.
∗This work is done when the first author was a graduate student with the Computer Science department at Iowa State University.
Movement prediction has been studied extensively in the liturature. Existing works mainly focus on next location prediction [Cho et al., 2011; Noulas et al., 2012; Gao et al., 2012; Scellato et al., 2011; Liu et al., 2016; Ye et al., 2013], where the goal is to predict the next location a user is most likely to visit given his/her current location. However, to the best of our knowledge, predicting the check-in time to a given location remains to be an open issue. Our work complements existing techniques by addressing this particular challenge.
Extending existing research on movement prediction to the time dimension will potentially benefit various time-sensitive applications. For example, identifying people who are most likely/not likely to visit a shop or attraction within the next two hours or the next few days. Such information can be used for more efficient targeted-advertisement or tourism service.
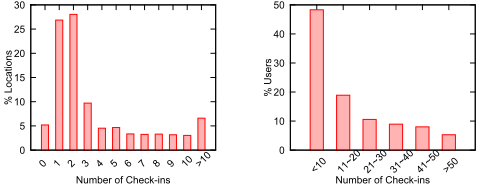
Check-in time prediction can be formulated as a regression problem since time is a continous variable. Nevertheless, modeling the check-in time to a location l is a challenging task due to check-in data scarcity. Although the total amount of check-ins is abundant, they are highly unevenly distributed among users and locations (Figure 2). For example, it is estimated that, on Foursquare, only 10% of locations have more than 10 check-ins, and about 50% of users reported fewer than 10 check-ins [Noulas et al., 2012]. To alleviate data scarcity, we propose to enrich the check-in data using potential visitors to l. That is, the users who did not check-in to l so far, but is likely to do so in the future. Inspired by several human mobility studies [Cho et al., 2011; Noulas et al., 2012], we propose a matrix factorization-based approach to identify potential visitors.
Introducing potential visitors, however, does not automatically solve the data scarcity problem. Standard regression methods cannot directly use information about potential visitors whose actual check-in time to l is not observed. To address this issue, we form check-in time prediction as a survival analysis problem and propose a Recurrent-Censored Regression (RCR) model. In order to capture the spatiotemporal nature of check-in data, we design a gated recurrent units (GRUs) structure [Cho et al., 2014] to learn latent representation of historical check-ins of a user. This representation is then incorporated into censored regression to make predictions. We summarize our contributions as follows:
- We identify an open issue in human mobility research, namely, the check-in time prediction problem. In particular, given a user and a location of interest, we aim to predict the time when the user will check-in to that location.
- We address the key challenge of check-in data scarcity. Our method is to enrich the check-in data with potential visitors. In order to effectively use both actual and potential visitors, we propose a novel recurrent-censored regression model which is able to learn the latent dependencies of check-in time with respect to historical check-ins.
- The proposed model is evaluated on real-world data. The results show that RCR model achieves significant performance improvement compared to state-of-the-art event time prediction techniques.
The rest of the paper is organized as follows: Section 2 summarizes related work. We give a formal definition of the problem in Section 3. We describe the spatio-temporal features we used in Section 4 and present the proposed model in Section 5. Our experimental results are shown in Section 6. Section 7 concludes the paper.
2 RelatedWork
We briefly summarize the research works related to check-in location prediction and time-to-event modeling.
2.1 Check-in Location Prediction
The first large-scale study on human mobility patterns using location data collected by LBSNs is due to Cho et al. [Cho et al., 2011]. They proposed two models, the Periodic Mobility Model and the Periodic Social Mobility Model, which can reproduce a user's movement. This pioneering work has since inspired several lines of research works on check-in location prediction, i.e., predict the next location(s) a user is most likely to visit. Noulas et al. [Noulas et al., 2012] proposed to explore check-in data, instead of plain geographic coordinates, to predict the next location a user will visit. The key difference here is check-in data gives the exact place (e.g., a store, a coffee shop, etc.) a user visits. It allows users to train a model using features such as the type and name of the location. In [Scellato et al., 2011], the authors proposed the NextPlace framework, which is not only capable of predicting the next check-in location of a user, but also the user's arrival time and the interval of time the user spent in that location. In [Gao et al., 2012], the authors proposed an improved model for next location prediction. Their model takes into account not only historical spatial trajectories but also the temporal periodic patterns of a user. Recently, a Spatial Temporal Recurrent Neural Network (ST-RNN) was introduced in [Liu et al., 2016] for check-in location prediction. This technique outperforms several existing models. This result demostrated the potential of deep neural networks in check-in data mining. The most recent work in this field is by [Rakesh et al., 2017] where the authors proposed a novel model to predict a user's preference of a sequence of locations for the purpose of tour recommendation.
2.2 Time-to-Event Prediction
In time-to-event prediction, there is a set of entities, among which some have experienced a particular event. The goal is to model the time when the event will occur for a given entity. This problem arises from various application fields, such as health care [Li et al., 2016c], crowed sourcing [Li et al., 2016b], and education [Ameri et al., 2016]. To our knowledge, such models have never been investigated in the context of spatio-temporal data.
Commonly, the occurrence of an event is not observed for every entity in the dataset. An entity that has not experienced the event is said to be censored since the event time required for training an estimation model is missing. Several models have been developed to make use of such censored instances in the field of survival analysis. These models can be categorized into three types. 1. Cox proportional hazards model [Cox, 1992]. The Cox model is semi-parametric which does not make any assumption about the distribution of event occurrence time and is typically learned by optimizing a partial likelihood function. To efficiently handle highdimensional data, some variations of Cox model have been proposed, including [Tibshirani, 1997; Simon et al., 2011]. 2. Parametric censored regression model [Lee and Wang, 2003; Wei, 1992] assumes event occurrence time follows a particular distribution such as Weibull or log-logistic. 3. Censored linear regression. Due to the existence of censored instances, the least-squares estimator of standard linear regression cannot be directly used. Several techniques have been proposed to solve this problem, e.g., the Tobit model [Tobin, 1958] and the Buckley-James estimator [Buckley and James, 1979]. There is a recent survey [Wang et al., 2018] that discusses machine learning techniques for survival analysis in detail.
3 ProblemFormulation
First, we formally define the notions of check-in and usertrajectory used in this paper.
Definition 1 (Check-in) Let U denote a set of unique user identifiers, L denote a set of locations, and T denote the time domain. A check-in c is a triple (u, l, t) ∈ U × L × T , which indicates the user u has visited l at time t.
Definition 2 (User-trajectory) Let C be a collection of check-ins and u ∈ U a user, then the set Cu := {(u, l, t) ∈ C} is the user-trajectory (or simply trajectory) of u.
Problem Statement : Given a location of interest l ∈ L and a user of interest u ∈ U, the goal of check-in time prediction is to predict the time t when u will check-in to l, using a sequence of historical check-ins {c1, c2, ..., ck} ⊆ Cu reported by u as observations. Besides the historical checkins, a user's profile on the location-based social network (e.g., his/her social connections) usually contains valuable information about the user, hence we also consider different ways to make use of such information extracted from the user profile in check-in time prediction.
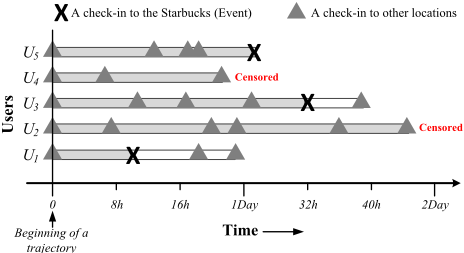
In check-in time prediction, each user is an entity and we are interested in modelling time of the event "A user u visits a location l". To illustrate, the trajectories of five users are shown in Figure 3. Among them, three users check-in to a Starbucks coffee store, and the other two users did not (during the observation window). The Time-axis is relative so it does not require all the trajectories to start at the same time. In this example, we want to model the check-in time for this Starbucks coffee store using these trajectories as training instances, such that given a new user, we are able to predict his check-in time to this location.
If a user ui has reported a check-in to l, we know the exact time of that visit, denoted by Ti. However, if ui is a potential visitor, the check-in time Ti is an unknown variable, and the user is said to be censored 1 . In order to model check-in times using both actual and potential visitors, we formulate the check-in time prediction problem as a survival analysis problem. At the core of survival analysis is a set of techniques termed censored regression, which can take advantage of censored instances.
1 An instance is called right censored if its event time is greater than its last observed time. For check-in data, all censored instances are right censored.
Formally, we denote each user ui as (Xi, ti, δi), where Xi denotes spatio-temporal feature vector extracted from the user's trajectory Cui . δi indicates whether the user has visited l, i.e., δi = 1 if ui reported a check-in to l and δi = 0, otherwise. The observed time ti for a user is defined as follows:
where Ui is the time of the last check-in of ui on the trajectory. For a potential visitor, although Ti is unknown, we do know the check-in time must be no earlier than Ui, which can be seen as a lower bound. The time variable we used here is relative, i.e., Ti does not denote a specific point in the time domain. Instead, it denotes the time elapsed since the beginning of the trajectory of ui.
In survival analysis, censored regression is typically used to model non-recurring events, e.g., the death of a patient. One problem that arises here is about handling a user's multiple check-ins to l in our formulation. Our approach is to partition the user's trajectory into several non-overlapping trajectory segments, each containing one (for visitors) or none (for potential visitors) check-in to l. Each trajectory segment is treated as one instance for the model.
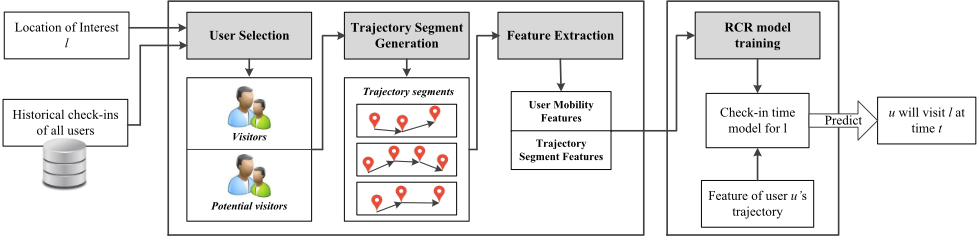
The proposed solution consists of two general steps (Figure 4). The first step is spatio-temporal feature extraction. In this step, we select a set of visitors and potential visitors to the location of interest. We then create trajectory segments of these users' trajectories. Each check-in within a segment is represented by a spatio-temporal feature vector. This is followed by the model training and prediction step. The input to the RCR model is a sequence of feature vectors generated from a trajectory segment. The trained model is then used to make predictions given a new user trajectory as observation.
4 Spatio-Temporal Feature Extraction
4.1 User Selection
Given a location of interest l, user selection is the process of finding a set of users Ut ⊆ U whose trajectories can be used to model the check-in time to l. Ut consists of two types of users, visitors to l, and potential visitors who did not visit l before but are likely to do so in the future. Finding visitors is straightforward, hence we will focus on how to identify potential visitors.
We propose to use Matrix Factorization, a widely-used technique for recommendation systems, to identify potential visitors. In Matrix Factorization, both users and locations are mapped into a k-dimensional latent space. Given n users and m locations, let U ∈ Rk×n denote the latent user feature matrix, where the column vector ui ∈ U is the feature vector of the ith user. Similarly, we define the location feature matrix and location feature vector as L ∈ Rk×m and li, respectively.
Whether the ith user is likely to visit the jth location is predicted by the product of their feature vectors ˆ pij = uTi lj. The latent features are estimated using:
where E(·) is a loss function, e.g., Mean Square Error, Mi is the observed check-in locations of the ith user, and Θ(U,L) the L2 -regularization term:
where λu and λv are hyper-parameters to control the regularization strength. We define u as a potential visitor to l if the following three conditions are all satisfied:
- Geographic Distance: u lives in the same city where l is located. City information can be easily inferred by majorityvoting on cities the user has visited.
- Social Connection: At least one friend of u has visited l before. Social connections of users can be extracted from the user's Location-based Social Network (LBSN). For example, on Foursquare, users have the option to "follow" others, which can be seen as a directed social connection.
- Location Preference: u is predicted to visit l using the matrix factorization method described above.
4.2 Trajectory Segments Generation
Our hypothesis is that consecutive check-ins are likely to be correlated. But if there is a significant time interval between two check-ins, they are not likely to be related. When a user u reports a check-in to l, we are particularly interested in the locations he has visited precedent to l. These precedent check-ins and l together makes a trajectory segment of u. The size of the trajectory segment is constrained by a hyper-parameter termed observation window size, denoted by T . Let C = {u, l, t} be a check-in to l, the trajectory segment containing C consists of C and all the check-ins reported between min(tprev, t - T) and t. Here tprev is the previous time the user visited l before t. Following this hypothesis, we generate one trajectory segment for each check-in to l. The trajectory of a potential visitor, however, does not contain a check-in to l. Thus, its trajectory segment consists of n consecutive check-ins that fall within the observation window from the last known check-in on the trajectory.
4.3 Feature Extraction
We extract two sets of features for a trajectory segment:
User Mobility Features: These features describe the user who generated the trajectory segment.
- (i) Activity Level. The average number of check-ins per day reported by the user.
- (ii) Category Preference. This feature consists of a set of integer values, each corresponding to the total number of checkins reported by the user in a specific location category. The location category information is usually available on LBSNs such as Foursquare.
- (iii) Travel Cost. It is defined as Di,j = dl/dH, where dl is the distance between the user's home and l, and dH is the average distance between his home and the other locations he checks-in to. We use the method discussed in [Cho et al., 2011] to estimate a user's home location.
- (iv) Historical Visits. For historical visits, we compute how many times a user has checked into l on his entire trajectory, the time since last visit, and the average interval between two previous visits to l.
Check-in Features: These features are generated for each check-in present on the trajectory segment.
- (i) Geographic Distance. The Euclidean distance between the check-in location and l.
- (ii) Location Category. The category of the check-in location, e.g., being a shop or restaurant. This information is available on LBS such as Yelp and GoogleMaps.
- (iii) Precedent Location. We say a location lp is a precedent location of l if there exists a check-in to lp precedent to the check-in to l on any trajectory. A check-in to lp serves as an indicator that the user may later visit l. Using association rule mining [Agrawal et al., 1993], we identify precedent locations lp of l with high support (s) and confidence (c):
Here, lp → l means the rule that a user who visits lp first will visit l in the future. n is the total number of trajectory segments, σ(lp) denotes the number of trajectory segments containing lp, and σ(lp ∪ l) the ones containing both lp and l. Together, they measure how likely and frequently this rule can be observed on a real trajectory. This feature is a Boolean value that indicates whether this check-in location is such a precedent location to l or not.
- (iv) Temporal Features, including day of the week and time of the check-in, time since the previous check-in, and the average number of check-ins per hour on this segment.
5 Recurrent-Censored RegressionModel
The goal here is to model a user's check-in time to a given location l. The check-in time T is represented as a continuous random variable. Let S(t) denote the probability that the check-in occurs later than a specific time point t, defined as:
where f(u) is a probability density function and F(t) the cumulative distribution function. In order to predict event times, censored regression attempts to estimate the check-in rate function r(t), which is the instantaneous rate of occurrence of the check-in at time t. It is defined as:
The numerator here is the probability that the check-in will occur in the time interval [t, t + dt), given that it has not occurred before t. In the traditional censored regression setting, each entity is represented by a feature vector which is used to construct r(t). In contrast, our model adapts to the spatiotemporal nature of check-ins. It learns a latent representation of a user's check-ins and then uses it to construct r(t).
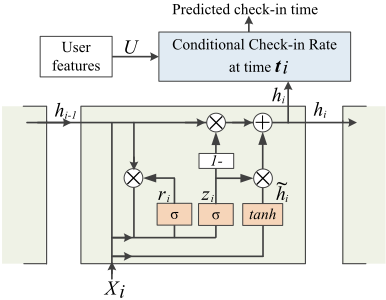
Figure 5 illustrates the proposed RCR model. We are particularly interested in modelling the conditional check-in rate at time t given a sequence of check-ins before time t. Let X = {X1,X2, ...,Xk} denote the feature vectors of the k check-ins, and U the user mobility feature vector. We define the conditional check-in rate in the RCR model as follows:
where r0(t) is the baseline check-in rate function. The key component here is H(t), which is the latent representation of each check-in within X and U .
In RCR, H(t) is learned using a neural network of gated recurrent units. Given X and U as input, the model iterate through X1,X2, ...Xk. Let ti be the timestamp of Xi. At the ith step, the model learns a representation of X1,X2, ...Xi, denoted by h(ti). It then uses h(ti) and U to estimate H(ti), the conditional check-in probability at time ti. At each step, the gated recurrent units update h(ti) using Xi, U, as well as the representation h(ti-1) generated in the previous step. The following equations describe this updating process:
And H(ti) is then computed using h(ti) and U:
In the above equations, [·, ·] denotes the concatenation of two vectors. Wz, Wr, and W are the weight matrices of the recurrent neural network and β0, β1, β2 are model parameters. zt and rt are the forget gate and the reset gate, respectively. Intuitively, zt is used to forget irrelevant information learned from X1,X2, ...,Xi-1, while rt determines the influence of Xi on h(ti).
During the training phase, a collection of {X,U} is given as training instance. We use the Back Propagation Through Time algorithm [Rumelhart et al., 1988] to train the RCR model. The loss function we used is the negative likelihood of observing the training instances, which takes into consideration both visitors and potential visitors.
The baseline function is parametrized as follows:
where Ri is the set of instances whose event times are equal to or greater than ti. In each training iteration, the model updates its parameters according to output of the loss function. It attempts to reach the optimal parameter using stochastic gradient descent until it achieves convergence.
6 Experimental Results
To the best of our knowledge, there is no existing technique designed particularly for check-in time prediction. Hence, we compare the proposed model with standard and censored regression models which can be adapted to our problem.
- Most Popular Hour (Popular): This model simply selects the most popular check-in hour of the given location as the predicted check-in time for every user.
- Standard linear regression model (Linear) applied on the spatio-temporal features to directly predict the check-in time. The feature vectors in X are averaged out into one vector and then concatenated with U.
- A feedforward deep neural network (DNN) with three fully-connected hidden layers. It uses the same hidden layer size and learning rate as our RCR model. It also uses the single feature vector to make prediction.
- The Accelerated Failure Time model (AFT) which is a widely used parametric model for censored regression. We fit a logistic distribution to this model to make predictions.
- The Cox proportional hazards regression model (Cox) is a state-of-the-art semi-parametric censored regression model.
Among the above models, Popular, Linear, and DNN cannot utilize potential visitors. Censored regression-based models, including AFT, Cox, and RCR, can use potential visitors. Recall that Matrix Factorization (MF) is used to identify potential visitors. The size of latent variables used in MF is set to 6, which has been shown to be suitable for location recommendation systems [Li et al., 2016a]. We implemented the RCR model in Python with Tensorflow. The size of hidden layer of RCR is set to 128. During the training process, the learning rate is set to 0.01 with a momentum of 0.9.
| Visitors | With potential visitors | Without potential visitors | Average gain | |||||
|---|---|---|---|---|---|---|---|---|
| Popularity | Low | Medium | High | Low | Medium | High | ||
| Models | Popular | 0.371 | 0.413 | 0.410 | 0.371 | 0.413 | 0.410 | 0 |
| Linear | 0.550 | 0.587 | 0.594 | 0.550 | 0.587 | 0.594 | 0 | |
| DNN | 0.537 | 0.601 | 0.610 | 0.537 | 0.601 | 0.610 | 0 | |
| AFT | 0.592 | 0.659 | 0.663 | 0.552 | 0.591 | 0.520 | 15.09% | |
| Cox | 0.604 | 0.672 | 0.690 | 0.549 | 0.596 | 0.524 | 17.77% | |
| RCR | 0.710 | 0.734 | 0.742 | 0.574 | 0.590 | 0.555 | 27.17% | |
| Visitors | With potential visitors | Without potential visitors | Average gain | |||||
|---|---|---|---|---|---|---|---|---|
| Popularity | Low | Medium | High | Low | Medium | High | ||
| Models | Popular | 0.380 | 0.434 | 0.440 | 0.380 | 0.434 | 0.440 | 0 |
| Linear | 0.557 | 0.575 | 0.590 | 0.557 | 0.575 | 0.590 | 0 | |
| DNN | 0.542 | 0.592 | 0.607 | 0.542 | 0.592 | 0.607 | 0 | |
| AFT | 0.589 | 0.661 | 0.670 | 0.562 | 0.580 | 0.579 | 11.56% | |
| Cox | 0.612 | 0.690 | 0.692 | 0.565 | 0.579 | 0.594 | 14.72% | |
| RCR | 0.705 | 0.743 | 0.749 | 0.557 | 0.583 | 0.599 | 26.34% | |
We evaluate the proposed model on two widely used datasets crawl from location-based social networks: 1) Foursquare New York City (NYC) and Tokyo check-in datasets [Yang et al., 2015] 2 . This dataset was collected from Foursquare.com where information of location categories and the social connection between users are available. NYC and Tokyo and the two most popular cities on the social network. 2) Gowalla global check-in dataset with social connections [Cho et al., 2011] 3 . However, location category is not available in this dataset. And since Gowalla is closed now, we cannot collect such information online. Thus we will ignore location category for our experiments on this dataset.
2 https://sites.google.com/site/yangdingqi/home/foursquaredataset
3 https://snap.stanford.edu/data/loc-gowalla.html
(c) Gowalla dataset.
(d) Gowalla dataset.
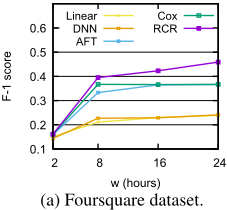
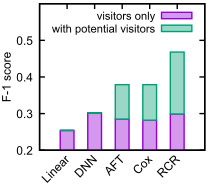
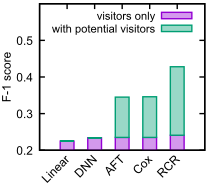
Figure 7: F-1 score for high popularity locations.
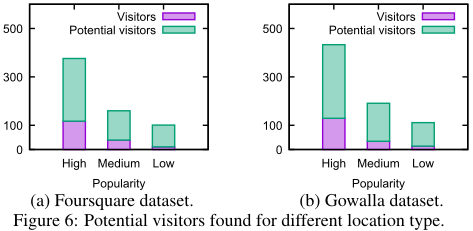
We consider three types of locations, based on their overall popularity: High (>75 check-ins), Medium (>25 and ≤75 check-ins), and Low (≤25 check-ins). For each location type, we randomly select 50 locations from the dataset. Figure 6 illustrates the average number of visitors and potential visitors found for high, medium, and low popularity locations.
Conventional regression metrics such as mean squred error are not suitable for censored regression due to the lack of ground truth (i.e., actual check-in time) for the censored instances [Lee and Wang, 2003]. Therefore, we use two alternative metrics. The first metric is Time-Dependent AUC (TDAUC) which is widely used to evaluate the performance of censored regression models [Harrell et al., 1984]. TD-AUC
is computed as follows:
where N is the total number of comparable pairs, ˆ yi is the estimated check-in time, and I[·] is the indicator function. Here, a comparable pair is the check-in time of any two different visitors (including the potential visitors) to the location of interest. Hence for n visitors there can be ( n2 ) comparable pairs. Intuitively, TD-AUC measures the consistency between the predicted and actual ordering of a set of check-ins.
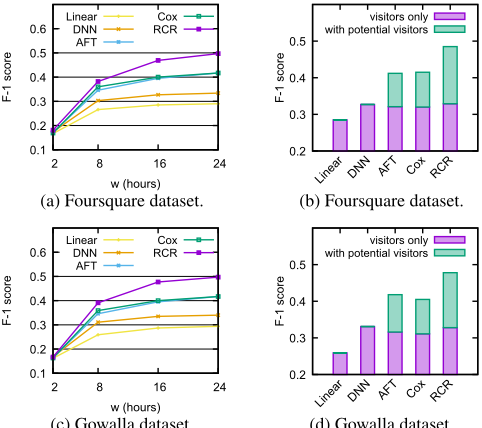
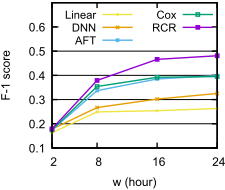
As for the second metric, we use the F-1 score for the task of visitor identification for user-defined time windows. Specifically, given the location l, a set of candidate visitors V , and a parameter w, the task is to identify the users in V who will visit l within the next w hours.
To demonstrate the impact of using potential visitors, we show the performance of different models with and without using potential visitors in the training process (which is not applicable for Popular, Linear, or DNN since the 4 models cannot use information about potential visitors). The TDAUC result is shown in Table 1 (on Foursquare dataset) and Table 2 (on Gowalla dataset). Without enriching the dataset with potential visitors, all models performed poorly: Note that, on each test point even the best performer is only slightly better than random guess. Nevertheless, when potential visitors are allowed, censored regression-based models perform better than standard regression models, in general. We draw two conclusions: 1) The proposed RCR model significantly outperforms all the baselines when potential visitors are allowed. 2) Using potential visitors to enrich check-in data is effective, and the proposed model is the most efficient in using information about potential users.
For each location l used in our experiment, we randomly select a user set containing equal number of visitors, potential visitors, and other users. We want to identify the users who will visit l within w hours. Note that the Popular model
(b) Foursquare dataset.
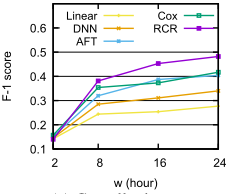
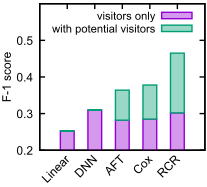
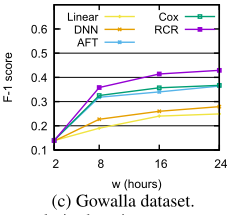
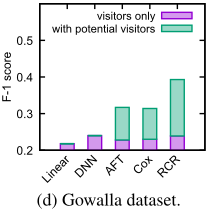
is not suitable for this task since it makes the same prediction for every user. Hence we exclude it from the comparison. Figures 7, 8, and 9 show the average F-1 scores@w for high, medium, and low popularity locations, respectively. We also show separately the performance gain of using potential visitors (averaged on w). It can be seen that censored regression models can all benefit from using potential visitors. The RCR model demonstrates outstanding ability in exploiting potential visitors comparing with state-of-the-art censored regression models. When potential visitors are used, the RCR model is able to achieve 86% performance gain on average than AFT and Cox. This advantage comes from the unique recurrent structure of the RCR model designed particularly for handling spatio-temporal data.
7 Conclusion
Check-in time prediction is an intriguing problem but has not been studied in the literature. The key challenge here is the scarcity of check-in data. This is because check-ins are highly unevenly distributed among a huge number of users and locations. We propose a comprehensive solution to address this problem by enriching the dataset with potential visitors, and designing a novel Recurrent-Censored Regression (RCR) model that can exploit both actual and potential visitors to improve performance. The proposed RCR model incorporates gated recurrent unit network into censored regression. This unique structure allows RCR to outperform the state-of-theart event time prediction techniques.
Acknowledgements
This work was supported in part by the National Science Foundation grants IIS-1619028, IIS-1707498 and IIS1646881.
@inproceedings{ijcai2018p413,
  title     = {Spatio-Temporal Check-in Time Prediction with Recurrent Neural Network based Survival Analysis},
  author    = {Yang, Guolei and Cai, Ying and Reddy, Chandan K.},
  booktitle = {Proceedings of the Twenty-Seventh International Joint Conference on
               Artificial Intelligence, {IJCAI-18}},
  publisher = {International Joint Conferences on Artificial Intelligence Organization},
  editor    = {Jérôme Lang},
  pages     = {2976--2983},
  year      = {2018},
  month     = {7},
  note      = {Main track},
  doi       = {10.24963/ijcai.2018/413},
  url       = {https://doi.org/10.24963/ijcai.2018/413},
}
TY - CPAPER TI - Spatio-Temporal Check-in Time Prediction with Recurrent Neural Network based Survival Analysis AU - Yang, Guolei AU - Cai, Ying AU - Reddy, Chandan K. T2 - Proceedings of the Twenty-Seventh International Joint Conference on Artificial Intelligence, IJCAI-18 PB - International Joint Conferences on Artificial Intelligence Organization PY - 2018 SP - 2976 EP - 2983 DO - 10.24963/ijcai.2018/413 UR - https://doi.org/10.24963/ijcai.2018/413 ER -Copied
Machine-readable versions of this paper, for tools and AI agents:





