
MTP-DDA: Enhanced Drug-Disease Associations Prediction via Multi-task Learning with Multi-view Graph Convolutional Networks and Contrastive Learning
Proceedings of the Thirty-Fifth International Joint Conference on Artificial Intelligence. AI and Health. Pages 6680-6688.
https://doi.org/10.24963/ijcai.2026/743
Keywords
- AI4H: Precision medicine
- AI4H: Health data mining
- AI4H: Self-supervised learning
- AI4H: Medical knowledge representation
- AI4H: Drug discovery
Abstract
Predicting drug-disease associations (DDAs) plays a crucial role in drug development and disease treatment. However, existing researches predominantly focus on single DDAs prediction task, often overlooking the intricate relationships among different tasks, which can further improve the performance of methods for DDAs prediction. To address this limitation, a multi-task prediction framework, capable of simultaneously predicting drug-disease, drug-protein, and disease-protein associations, is proposed, named MTP-DDA. The framework constructs three distinct graphs to reflect different relationships between biological entities. Then, based on these graphs, two sub-views and one main-view are constructed. For sub-view, corruption strategy is adopted to generate corrupted view, and Graph Convolutional Network (GCN) is employed to extract features from both the original view and its corrupted version, with contrastive learning applied to enhance feature representations. For main-view, GCN and Node2Vec are utilized to extract low-order and high-order node features respectively, and an attention mechanism is utilized for feature fusion. Finally, the node features from three views above are integrated, and the dot product operation is applied to the node features of association pairs to derive association scores, thereby enabling multi-task association prediction. Under 10-fold cross-validation, the proposed framework outperforms current methods on public datasets, demonstrating its effectiveness and robustness.
- [Bade and Dela Cruz, 2020] Brett C. Bade and Charles S. Dela Cruz. Lung cancer 2020: Epidemiology, etiology, and prevention. Clinics in Chest Medicine, 41(1):1-24, 2020.
- [Barzaman et al., 2020] Khadijeh Barzaman, Jafar Karami, Zeinab Zarei, Aysooda Hosseinzadeh, Mohammad Hos- sein Kazemi, Shima Moradi-Kalbolandi, Elahe Safari, and Leila Farahmand. Breast cancer: Biology, biomark- ers, and treatments. International Immunopharmacology, 84:106535, 2020.
- [Cai et al., 2021] Lijun Cai, Changcheng Lu, Junlin Xu, Ya- jie Meng, Peng Wang, Xiangzheng Fu, Xiangxiang Zeng, and Yansen Su. Drug repositioning based on the hetero- geneous information fusion graph convolutional network. Briefings in Bioinformatics, 22(6):bbab319, 2021.
- [Davis et al., 2023] Allan Peter Davis, Thomas C. Wiegers, Robin J. Johnson, Daniela Sciaky, Jolene Wiegers, and Carolyn J. Mattingly. Comparative toxicogenomics database (ctd): update 2023. Nucleic Acids Research, 51(Database Issue):D1257-D1262, 2023.
- [Eltanani et al., 2024] Mohammad Eltanani, Alaa Alsha- reeda, Wafa Alqahtani, Rawan Alharbi, Eyad Elkord, Mohmmed Alblihed, and Saleh Alkarim. Unraveling the tumor microenvironment: Insights into cancer metastasis and therapeutic strategies. Cancer Letters, 591:216894, 2024.
- [Fan et al., 2024] Yanhao Fan, Che Zhang, Xiaowen Hu, Zhijian Huang, Jiameng Xue, and Lei Deng. Sg- cldga: unveiling drug-gene associations through simple graph contrastive learning. Briefings in Bioinformatics, 25(3):bbae231, 2024.
- [Gao et al., 2023] Zihao Gao, Huifang Ma, Xiaohui Zhang, Yike Wang, and Zheyu Wu. Similarity measures-based graph co-contrastive learning for drug-disease association prediction. Bioinformatics, 39(6):btad357, 2023.
- [Gottlieb et al., 2011] Assaf Gottlieb, Gideon Y. Stein, Ey- tan Ruppin, and Roded Sharan. Predict: a method for in- ferring novel drug indications with application to person- alized medicine. Molecular Systems Biology, 7:496, 2011.
- [Gu et al., 2022] Yaowen Gu, Si Zheng, Qijin Yin, Rui Jiang, and Jiao Li. Redda: Integrating multiple biological re- lations to heterogeneous graph neural network for drug- disease association prediction. Computers in Biology and Medicine, 150:106127, 2022. Hamosh et al., 2005] Ada Hamosh, Alan F. Scott, Joanna S. Amberger, Carol A. Bocchini, and Victor A. McKusick. Online mendelian inheritance in man (omim), a knowl- edgebase of human genes and genetic disorders. Nucleic Acids Research, 33(suppl 1):D514-D517, 2005.
- [Hua et al., 2022] Yi Hua, Xiaowen Dai, Yuan Xu, Guomeng Xing, Haichun Liu, Tao Lu, Yadong Chen, and Yanmin Zhang. Drug repositioning: Progress and challenges in drug discovery for various diseases. European Journal of Medicinal Chemistry, 234:114239, 2022.
- [Huang et al., 2020] Feng Huang, Yang Qiu, Qiaojun Li, Shichao Liu, and Fuchuan Ni. Predicting drug-disease as- sociations via multi-task learning based on collective ma- trix factorization. Front Bioeng Biotechnol, 8:218, 2020.
- [Jia et al., 2025] Xiao Jia, Xinliang Sun, Kaili Wang, and Min Li. Drgcl: Drug repositioning via semantic-enriched graph contrastive learning. IEEE Journal of Biomedical and Health Informatics, 29(3):1656-1667, 2025.
- [Li et al., 2016] Jiao Li, Si Zheng, Bin Chen, Atul J. Butte, S. Joshua Swamidass, and Zhiyong Lu. A survey of cur- rent trends in computational drug repositioning. Briefings in Bioinformatics, 17(1):2-12, 2016.
- [Li et al., 2023] Hui Li, Bin Wu, Miaomiao Sun, Yangdong Ye, Zhenfeng Zhu, and Kuisheng Chen. Multi-view graph neural network with cascaded attention for lncrna- mirna interaction prediction. Knowledge-Based Systems, 268:110492, 2023.
- [Li et al., 2026] Xingyang Li, Zepeng Li, Bo Wei, and Yuni Zeng. Drug-target interaction prediction via dual- interaction fusion. Molecules, 31:498, 2026.
- [Liu et al., 2024] Junkai Liu, Shixuan Guan, Quan Zou, Hongjie Wu, Prayag Tiwari, and Yijie Ding. Amdgt: Attention aware multi-modal fusion using a dual graph transformer for drug-disease associations prediction. Knowledge-Based Systems, 284:111329, 2024.
- [Luo et al., 2016] Huimin Luo, Jianxin Wang, Min Li, Jun- wei Luo, Xiaoqing Peng, Fang-Xiang Wu, and Yi Pan. Drug repositioning based on comprehensive similarity measures and bi-random walk algorithm. Bioinformatics, 32(17):2664-2671, 2016.
- [Luo et al., 2018] Huimin Luo, Min Li, Shaokai Wang, Quan Liu, Yaohang Li, and Jianxin Wang. Computational drug repositioning using low-rank matrix approximation and randomized algorithms. Bioinformatics, 34(11):1904- 1912, 2018.
- [Luo et al., 2021] Huimin Luo, Min Li, Mengyun Yang, Fang-Xiang Wu, Yaohang Li, and Jianxin Wang. Biomed- ical data and computational models for drug reposition- ing: a comprehensive review. Briefings in Bioinformatics, 22(2):1604-1619, 2021.
- [Meng et al., 2022] Yajie Meng, Changcheng Lu, Min Jin, Junlin Xu, Xiangxiang Zeng, and Jialiang Yang. A weighted bilinear neural collaborative filtering approach for drug repositioning. Briefings in Bioinformatics, 23(2):bbab581, 2022.
- [Meng et al., 2024] Yajie Meng, Yi Wang, Junlin Xu, Changcheng Lu, Xianfang Tang, Tao Peng, Bengong Zhang, Geng Tian, and Jialiang Yang. Drug reposi- tioning based on weighted local information augmented graph neural network. Briefings in Bioinformatics, 25(1):bbad431, 2024.
- [Niu et al., 2025] Dongjiang Niu, Lianwei Zhang, Beiyi Zhang, Qiang Zhang, Shanyang Ding, Hai Wei, and Zhen Li. Dvgedr: a drug repositioning method based on dual- view fusion and graph enhancement mechanism in hetero- geneous networks. Complex & Intelligent Systems, 11:68, 2025.
- [Peng et al., 2025] Li Peng, Cheng Yang, Jiahuai Yang, Yuan Tu, Qingchun Yu, Zejun Li, Min Chen, and Wei Liang. Drug repositioning via multi-view representation learning with heterogeneous graph neural network. IEEE Journal of Biomedical and Health Informatics, 29(3):1668-1679, 2025.
- [Pushpakom et al., 2019] Sudeep Pushpakom, Francesco Io- rio, Patrick A. Eyers, K. Jane Escott, Shirley Hopper, An- drew Wells, Andrew Doig, Tim Guilliams, Joanna La- timer, Christine McNamee, Alan Norris, Philippe Sanseau, David Cavalla, and Munir Pirmohamed. Drug repurpos- ing: progress, challenges and recommendations. Nature Reviews Drug Discovery, 18(1):41-58, 2019.
- [Sheng et al., 2023] Nan Sheng, Yan Wang, Lan Huang, Ling Gao, Yangkun Cao, Xuping Xie, and Yuan Fu. Multi- task prediction-based graph contrastive learning for infer- ring the relationship among lncrnas, mirnas and diseases. Briefings in Bioinformatics, 24(5):bbad276, 2023.
- [Steinbeck et al., 2003] Christoph Steinbeck, Yongquan Han, Stefan Kuhn, Oliver Horlacher, Edgar Luttmann, and Egon Willighagen. The chemistry development kit (cdk): an open-source java library for chemo-and bioinformatics. Journal of Chemical Information and Computer Sciences, 43(2):493-500, 2003.
- [Sun et al., 2024] Xinliang Sun, Xiao Jia, Zhangli Lu, Jing Tang, and Min Li. Drug repositioning with adaptive graph convolutional networks. Bioinformatics, 40(1):btad748, 2024.
- [Sun et al., 2026] Chang Sun, Zichen Qin, Minglei Li, Yan- fei Li, Rong Tang, Shengquan Chen, Yuxiang Wang, Yan- qiang Liu, Jinmao Wei, and Jian Liu. A unified framework combining linear and 3d molecular features for robust drug-protein interaction prediction. Cell Reports Methods, 6:101304, 2026.
- [Tang et al., 2025] Xianfang Tang, Chang Zhou, Changcheng Lu, Yajie Meng, Junlin Xu, Xinrong Hu, Geng Tian, and Jialiang Yang. Enhancing drug repositioning through local interactive learning with bilinear attention networks. IEEE Journal of Biomedical and Health Informatics, 29(3):1644-1655, 2025.
- [van Driel et al., 2006] Marc A. van Driel, Jorn Bruggeman, Gert Vriend, Han G. Brunner, and Jack A. M. Leunissen. A text-mining analysis of the human phenome. European Journal of Human Genetics, 14(5):535-542, 2006.
- [Vidal et al., 2005] David Vidal, Michael Thormann, and Miquel Pons. Lingo, an efficient holographic text based method to calculate biophysical properties and intermolec- ular similarities. Journal of Chemical Information and Modeling, 45(2):386-393, 2005.
- [Wang et al., 2021] Xiaofeng Wang, Yan Li, Qian Zhang, Jianping Liu, Wei Chen, and Yong Zhao. Sodium bicar- bonate, an inorganic salt and a potential active agent for cancer therapy. Chinese Chemical Letters, 32(12):3687- 3695, 2021.
- [Wang et al., 2024] Xin-Fei Wang, Lan Huang, Yan Wang, Ren-Chu Guan, Zhu-Hong You, Nan Sheng, Xu-Ping Xie, and Qi-Xing Yang. A multichannel graph neural network based on multisimilarity modality hypergraph contrastive learning for predicting unknown types of cancer biomark- ers. Briefings in Bioinformatics, 25(6):bbae575, 2024.
- [Wishart et al., 2006] David S. Wishart, Craig Knox, An Chi Guo, Savita Shrivastava, Murtaza Hassanali, Paul Stothard, Zhan Chang, and Jennifer Woolsey. Drugbank: a comprehensive resource for in silico drug discovery and exploration. Nucleic Acids Research, 34(suppl 1):D668- D672, 2006.
- [Yu et al., 2021] Zhouxin Yu, Feng Huang, Xiaohan Zhao, Wenjie Xiao, and Wen Zhang. Predicting drug-disease as- sociations through layer attention graph convolutional net- work. Briefings in Bioinformatics, 22(4):bbaa243, 2021.
- [Zhang et al., 2020] Zi-Chao Zhang, Xiao-Fei Zhang, Min Wu, Le Ou-Yang, Xing-Ming Zhao, and Xiao-Li Li. A graph regularized generalized matrix factorization model for predicting links in biomedical bipartite networks. Bioinformatics, 36(11):3474-3481, 2020.
- [Zhao et al., 2022] Bo-Wei Zhao, Lun Hu, Zhu-Hong You, Lei Wang, and Xiao-Rui Su. Hingrl: predicting drug- disease associations with graph representation learning on heterogeneous information networks. Briefings in Bioin- formatics, 23(1):bbab515, 2022.
- [Zhao et al., 2024] Jinxian Zhao, Jamal Ouenniche, and Jo- hannes De Smedt. A complex network analysis ap- proach to bankruptcy prediction using company relational information-based drivers. Knowledge-Based Systems, 300:112234, 2024.
- [Zhao et al., 2025] Bo-Wei Zhao, Lun Hu, Zhu-Hong You, Lei Wang, and Xiao-Rui Su. Regulation-aware graph learning for drug repositioning over heterogeneous biolog- ical network. Information Sciences, 686:121360, 2025.
References were extracted automatically from the PDF and may contain errors.
Full text extracted automatically from the PDF; figures, tables and equations may differ. The PDF is the version of record.
1 Introduction
Conventional drug discovery process faces significant financial and temporal challenges [Li et al., 2016]. Drug repositioning (DR) has gained traction as a promising approach that investigates novel therapeutic uses for approved medications and reduces development costs and timelines [Pushpakom et al., 2019; Hua et al., 2022]. The prediction of drug-disease associations (DDAs) plays a vital role in this process, identifying potential relationships between drugs and novel indications. As biomedical data continues to grow exponentially, computational techniques have become essential for DDAs prediction, which are primarily classified into network-based, machine learning-based, and deep learning-based methods [Luo et al., 2021; Zhang et al., 2020; Peng et al., 2025].
Network-based approaches have demonstrated unique advantages in DDAs prediction. This methodology constructs heterogeneous relational networks comprising diverse biological entities and employs graph representation learning techniques, such as random walk and Node2Vec, to extract feature representations of nodes. These representations are then used to train classifiers for identifying potential DDAs. The HINGRL method integrated three types of nodes to construct a heterogeneous biological network [Zhao et al., 2022]. It captured node features from both attribute information and topological structure perspectives, ultimately utilizing a random forest classifier for DDAs prediction task. While network-based approaches offer strong interpretability, their predictive performance requires further enhancement.
Machine learning-based methods such as matrix factorization and matrix completion have been broadly utilized for more accurate DDAs prediction. LAGCN adopted graph convolutional network (GCN) to obtain node features and incorporated the attention mechanism to integrate features across different layers [Yu et al., 2021]. DRHGCN applied two types of encoders to capture the intra-domain and interdomain features of the nodes, and used a decoder to reconstruct the DDAs matrix [Cai et al., 2021]. REDDA learned node representations sequentially through node embedding, topological subnet embedding, graph attention, and layer attention blocks. A dot product decoder was used to reconstruct the association matrix [Gu et al., 2022]. However, machine learning-based approaches are constrained by shallow feature representations that make it difficult to reveal underlying relationships in complex biological networks.
Deep learning-based methods are increasingly used in biomedical and drug discovery. DRWBNCF encoded local nearest neighbors as well as node interactions and designed a two-channel feature extraction module [Meng et al., 2022]. DRGBCN employed two separate feature extraction modules to obtain node characterization information and applied a bilinear attention module to capture local interaction information of node pairs [Tang et al., 2025]. SMGCL constructed three views based on node similarities and DDAs information, used two types of encoders to model local and global topological information, and introduced graph contrastive learning method to maximize the consistency between them, achieving good performance [Gao et al., 2023]. Similarly, when obtaining information about drug and disease nodes, DRAGNN modeled them from heterogeneous information aggregation and neighbor information aggregation [Meng et al., 2024]. DRGCL constructed topology graph and semantic graph, employed encoders and used contrastive learning to generate feature representation vectors [Jia et al., 2025]. AMDGT adopted dual graph transformer modules to obtain node multimodal information, and utilized the modality interaction structure to effectively integrate multimodal features [Liu et al., 2024]. Although these methods have achieved some success, they typically treat DDAs prediction as a single task, failing to fully exploit the potential relationships with other tasks, such as drug-protein interaction (DPI) [Sun et al., 2026; Li et al., 2026] and disease-protein association (DPA) prediction tasks [Huang et al., 2020].
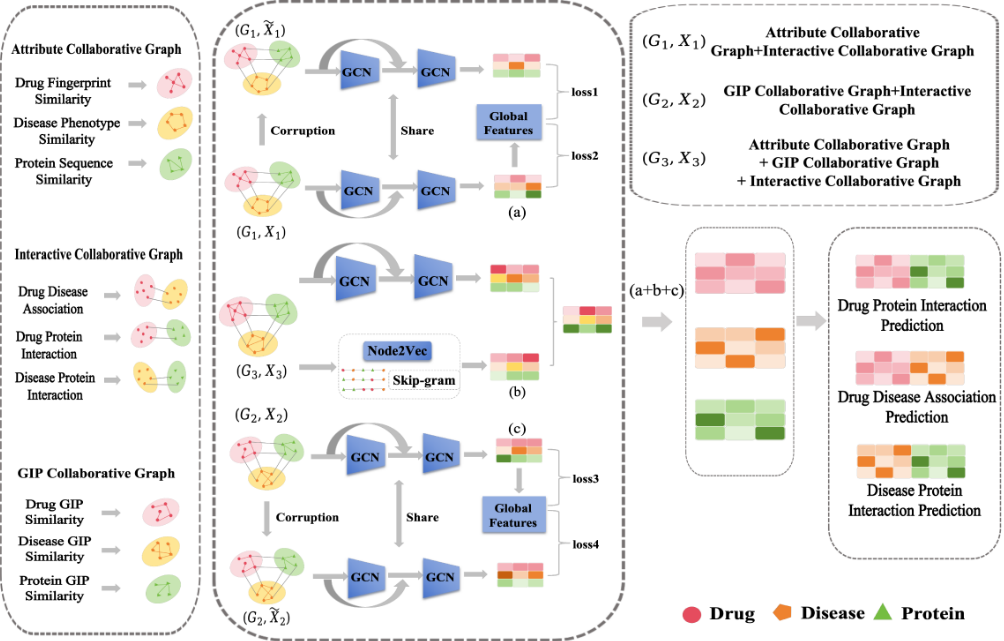
To address these limitations above, a multi-task learning framework (MTP-DDA) that simultaneously predicts drugdisease, drug-protein, and disease-protein associations is proposed. Firstly, attribute similarity collaborative graph, Gaussian Interaction Profile (GIP) kernel similarity collaborative graph and interaction graph are built using node attribute features, topological features and association data. Subsequently, taking the interaction graph as the core, integrating the attribute collaborative graph, GIP collaborative graph individually and integrating both attribute collaborative graph and GIP collaborative graph to complete the construction of three views, which contains two sub-views and one main view. Next, for the sub-view, the corruption graph is established based on original graph. Then, GCN is utilized to extract node features from both original graph and its corrupted version, and contrastive learning is employed to enhance model's robustness and obtain more discriminative node representations. For the main-view, GCN and Node2Vec are used to obtain low-order and high-order features of nodes, and attention mechanism is introduced to realize feature fusion. Finally, node features obtained from the three views are integrated to produce the feature representations of drugs, diseases, and proteins, which are adopted for multi-task association prediction. This strategy leverages latent relationships among tasks to boost DDA prediction performance.
| Statistic | Cdataset | Fdataset |
|---|---|---|
| Drugs | 663 | 593 |
| Diseases | 409 | 313 |
| Proteins | 993 | 2741 |
| Drug-disease Associations | 2532 | 1933 |
| Drug-protein Associations | 3773 | 3243 |
| Disease-protein Associations | 10734 | 54265 |
| Sparsity | 0.0093 | 0.0104 |
2 Datasets andMaterials
In this study, the model's performance is evaluated using two publicly available datasets. The first dataset, Fdataset [Gottlieb et al., 2011; Luo et al., 2016], comprises 593 drugs from DrugBank (DB) [Wishart et al., 2006], 313 diseases from OMIM [Hamosh et al., 2005], and 1933 known associations between them. The second dataset is Cdataset [Luo et al., 2018], which contains 663 drugs from DB, 409 diseases from OMIM, and 2532 known associations between them. Comprehensive details are provided in Table 1.
3 Methods
As shown in Fig. 1, MTP-DDA involves the following key steps: (1) graph construction (2) multi-view construction (3) multi-view node feature extraction (4) multi-task association prediction.
3.1 Graph Construction
Three distinct perspectives, biological attributes, topological features, and interactions between nodes, are selected to comprehensively capture diverse information related to drugs, diseases, and proteins.
Attribute Collaborative Graph
The attribute similarity of drugs is quantified using the cosine function based on fingerprint vectors obtained by RDKit [Vidal et al., 2005; Steinbeck et al., 2003], whereas disease attribute similarity is derived from disease phenotype data [van Driel et al., 2006]. Protein similarity is calculated using the cosine function based on protein sequence information. Each similarity matrix is processed using the K-nearest neighbors (KNN) algorithm, where the top K most similar nodes for each entity are assigned a value of 1, and the remaining nodes are set to 0. This procedure resulted in an attribute collaborative graph, which includes three similarity adjacency matrices, Aratt ∈ RNr×Nr , Adatt ∈ RNd×Nd , and Apatt ∈ RNp×Np , for drugs, diseases, and proteins. Nr, Nd, and Np signify the number of drugs, diseases, and proteins.
GIP Collaborative Graph
To capture topological characteristics, GIP kernels are utilized. The integrated GIP similarity for drugs is the average of GIP similarities based on drug-disease and drug-protein associations. For diseases, the integrated GIP similarity is the average of GIP similarities calculated from drug-disease and disease-protein association matrices, while for proteins, it is obtained by leveraging drug-protein and disease-protein association matrices. Using the same method, each integrated GIP similarity matrix is then processed by KNN algorithm. This yielded a GIP collaborative graph, encompassing three GIP similarity adjacency matrices, Argip ∈ RNr×Nr , Adgip ∈ RNd×Nd , and Apgip ∈ RNp×Np .
Interactive Graph
The relationships among drugs, diseases, and proteins are represented by three association matrices: Ard ∈ RNr×Nd , Arp ∈ RNr×Np , and Adp ∈ RNd×Np . In each matrix, an element is assigned a value of 1 if an association exists between the corresponding entities; otherwise, it is set to 0. An interactive graph consisting of three association adjacency matrices is obtained.
3.2 Multi-ViewConstruction
Based on the aforementioned constructed graphs, two subviews, G1 and G2, and one main-view G3, are defined as follows:
where Adr , Apr , and Apd are the transpose of Ard , Arp , and Adp . Arall ∈ RNr×Nr is the matrix generated by considering both Aratt and Argip . If drug di and drug dj is associated in Aratt or Argip , the corresponding position in Arall is assigned a value of 1; otherwise, it is set to 0.
Respectively regularizing G1, G2, and G3 yields different initial features of the nodes in three views, X1 ∈ RNv×Nv , X2 ∈ RNv×Nv , and X3 ∈ RNv×Nv , where Nv = Nr +Nd+ Np.
3.3 Multi-ViewNode Feature Extraction
Graph Contrastive Learning for Sub-View Feature Extraction
In the MTP-DDA framework, two sub-views are constructed, G1 and G2, from the perspectives of node attribute information and node topological features, respectively. Node feature extraction for these two views is performed using graph contrastive learning. Taking the node feature extraction of G1 as an example, the specific steps are summarized below:
Enabling the model to learn robust and discriminative feature representations, according to (G1,X1), a corruption function is employed to produce a fake view, which does not alter original adjacency matrix G1, but only modifies the feature matrix X1 [Sheng et al., 2023]. Specifically, ˜X1 is obtained by randomly shuffling the rows of X1, as shown below:
(G1,X1) and (G1, ˜X1) are input to GCN encoder to generate the local representations from both the original and fake graphs. Furthermore, to alleviate the gradient vanishing problem, residual connection is introduced in each layer of the GCN:
where l is the number of GCN layers, G1 represents the adjacency matrix, and D is the degree matrix of G1. Z(l) ∈ RNv×d and ˜Z(l) ∈ RNv×d signify node feature embeddings obtained in the l- th GCN layer, where d is the node feature dimension and Z(0) = X1, ˜Z(0) = ˜X1. W(l) and ˜W(l) are trainable weight matrix of l-th layer. σ is the activation function, parametric rectified linear unit (PRelu).
Therefore, the last layer of GCN both original and fake graphs output the final node embedding Z = [z1, z2, ..., zNv ] and ˜Z = [˜z1, ˜z2, ..., ˜zNv ].
The global feature summarizes the overall graph information, reflecting the graph's structure or patterns. To further capture global information, simple average pooling and sigmoid activation function are applied to the node features generated from the original graph, resulting in the global node features:
After extracting local features from both the original and fake graphs and the global representations, contrastive learning is introduced to strengthen model's feature representation capability [Wang et al., 2024; Fan et al., 2024]. The discriminator D , implemented as a linear layer, assigns probability scores to "local-global" pairs, with higher scores indicating that the local information is contained in the global features. In the original graph, "local-global" pairs formed by every local node feature and the global representation are assigned a label of 1, whereas in the corrupted graph, such pairs are labeled as 0. This task is modeled using binary cross-entropy (BCE) loss, and the objective function is defined as follows:
By minimizing the loss function between the node features of the original graph and the global representation, the model learns feature representations that align with global information, capturing common node characteristics and enhancing its ability to identify positive samples. Conversely, by maximizing the loss function for the corrupted graph, the model learns to distinguish features that deviate from global information, thereby improving robustness by identifying noise or anomalies.
Finally, after contrastive learning, the final node features of G1, denoted as Z1 = Z, can be obtained. Using the same method, the final node features of G2 is represented as Z2, and the loss in this stage is denoted as L2.
GCN and Node2Vec for Main-View Feature Extraction
To capture both low-order and high-order features of nodes in the main view G3, GCN and Node2Vec are utilized for feature extraction, respectively.
For G3, on the one hand, similar to Eq. (5), the node low-order features, Zlow, can be derived by GCN. On the other hand, Node2Vec is a random walk-based graph embedding algorithm designed to learn high-order vector representations of nodes in a graph. By flexibly controlling the random walk strategy, it can capture high-order topological information of nodes, such as community structures, node roles, and long-range dependencies [Zhao et al., 2024; Li et al., 2023]. To be specific, by controlling two parameters p and q of the random walk, Node2Vec can generate node sequences. Based on these node sequences, it learns the embedding representations of the nodes using skip-gram model, a type of shallow neural network, which aims to maximize the probability of co-occurrence of nodes with their context nodes. Therefore, the high-order representations, Zhigh, can be obtained.
The low-order and high-order features are concatenated along the feature dimension to obtain the stacked feature matrix Z′ . To adaptively weight the low-order and high-order features, an attention mechanism is adopted, which computes the attention weights ω using a multi-layer perceptron (MLP) and obtains the fused feature representation Z3. The specific formulas are as follows:ω = MLP(Z′ ), (9)
3.4 Multi-Task Association Prediction
In the multi-view feature extraction stage of MTP-DDA, node features Z1, Z2, and Z3 from three views are acquired. To fully utilize the complementary information from these views, these three feature matrices are horizontally concatenate into a combined feature matrix. To reduce the feature dimensionality and extract more discriminative information, a linear transformation layer is introduced on the combined feature matrix. At last, the output is the final node feature representation:
MTP-DDA uses dot product operation on the node features of association pairs as predicted association score:
In addition, MTP-DDA, as a multi-task learning framework, can simultaneously realize DDAs, DPI and DPA prediction, each of which has a corresponding cross-entropy loss function, which are as follows:
(14)
(15)
where y+ represents positive sample pairs in each task and ystands for negative sample pairs. Given the scarcity of positive samples relative to negative samples, random sampling is applied to negative sample pairs to achieve a balanced sample ratio in each task.
MTP-DDA trains these three association prediction tasks simultaneously. However, there is a disparity in the number of training samples of these three tasks. To balance this difference, weighting coefficients are introduced into the total prediction loss function, determined by the number of training samples for each task:
Therefore, the total loss function is defined below:
where λ is to control the weight of the contrastive loss in the total loss.
4 Results and Discussion
4.1 EvaluationMetrics
This study employs 10-fold cross-validation (10-CV) to evaluate the effectiveness of MTP-DDA. Specifically, both positive and negative samples are randomly divided into 10 equally sized subsets. In each iteration, one subset is designated as the test set, while the other nine subsets are adopted for model training. The evaluation metrics include the area under the receiver operating characteristic curve (AUC) and the area under the precision-recall curve (AUPR), which do not require specific thresholds, as well as threshold-based metrics such as Accuracy, F1-score (F1), Precision, and Recall.
The specific multi-task prediction results of MTP-DDA are listed in Table 2. All values represent the average performance of 10 validation folds. MTP-DDA achieves competitive results on DDAs, DPI and DPA prediction tasks, validating its multi-task learning capability.
4.2 Comparison with Other Models
In the multi-task prediction framework of MTP-DDA, the DDA prediction task is designated as the primary task and constitutes the central focus of performance evaluation. To validate the effectiveness of MTP-DDA, it is compared with a series of state-of-the-art DDA prediction models, including DRHGCN [Cai et al., 2021], DRWBNCF [Meng et al., 2022], DRGBCN [Tang et al., 2025], SMGCL [Gao et al., 2023], DRAGNN [Meng et al., 2024], DRGCL [Jia et al., 2025], and AMDGT [Liu et al., 2024].
As listed in Table 3, MTP-DDA outperforms existing methods in terms of AUC and AUPR. On the Cdataset, it attains an AUC of 0.9734 and an AUPR of 0.9730, while on the Fdataset, it achieves an AUC of 0.9663 and an AUPR of 0.9681, demonstrating its superior performance on the primary task. MTP-DDA constructs three views with different focuses, extracts node features in different views and fuse them to obtain more comprehensive node information. In addition, instead of considering DDAs prediction as a single task, MTP-DDA fully considers the potential correlations between different tasks, which further enhances its capability.
To rigorously evaluate the effectiveness differences among various DDA prediction models, statistical significance tests are conducted using paired t-tests. Taking the Cdataset as an example, paired t-tests are performed to assess the significant differences between MTP-DDA and seven other methods across three metrics: AUC, AUPR, and Accuracy, with a significance level of 0.05. As shown in Table 4, MTP-DDA significantly outperforms all baselines, with all p-values below the threshold.
| Dataset | Methods | AUC | AUPRAccuracy | F1 | Precision | Recall |
|---|---|---|---|---|---|---|
| Cdataset | DDA | 0.97340.9730 | 0.9185 | 0.9182 | 0.9233 | 0.9127 |
| DPI | 0.96650.9681 | 0.9030 | 0.9025 | 0.9068 | 0.8923 | |
| DPA | 0.98740.9877 | 0.9493 | 0.9492 | 0.9511 | 0.9473 | |
| Fdataset | DDA | 0.96630.9681 | 0.9097 | 0.9095 | 0.9119 | 0.9072 |
| DPI | 0.92680.9411 | 0.8544 | 0.8539 | 0.8566 | 0.8512 | |
| DPA | 0.92530.9469 | 0.8756 | 0.8753 | 0.8772 | 0.8733 |
| Dataset | Methods | AUC AUPR | Acc. | F1 | Prec. | Rec. |
|---|---|---|---|---|---|---|
| Cdataset | DRHGCN | 0.9608 0.9675 | 0.9102 | 0.9090 | 0.9193 | 0.9001 |
| DRWBNCF | 0.8984 0.9132 | 0.8272 | 0.8256 | 0.8354 | 0.8199 | |
| DRGBCN | 0.8832 0.8743 | 0.8100 | 0.8204 | 0.7781 | 0.8704 | |
| SMGCL | 0.9426 0.9542 | 0.8934 | 0.8901 | 0.9168 | 0.8661 | |
| DRAGNN | 0.9325 0.9594 | 0.8829 | 0.8956 | 0.9161 | 0.8780 | |
| DRGCL | 0.9629 0.9691 | 0.9070 | 0.9035 | 0.9380 | 0.8720 | |
| AMDGT | 0.9671 0.9693 | 0.9010 | 0.9033 | 0.8837 | 0.9241 | |
| MTP-DDA | 0.9734 0.9730 | 0.9185 | 0.9182 | 0.9233 | 0.9127 | |
| Fdataset | DRHGCN | 0.9473 0.9574 | 0.8960 | 0.8937 | 0.9141 | 0.8748 |
| DRWBNCF | 0.8897 0.9068 | 0.8254 | 0.8263 | 0.8260 | 0.8300 | |
| DRGBCN | 0.8670 0.8627 | 0.7941 | 0.8078 | 0.7601 | 0.8636 | |
| SMGCL | 0.9264 0.9402 | 0.8678 | 0.8667 | 0.8733 | 0.8616 | |
| DRAGNN | 0.9076 0.9462 | 0.8540 | 0.8673 | 0.9039 | 0.8355 | |
| DRGCL | 0.9512 0.9588 | 0.8939 | 0.8897 | 0.9269 | 0.8567 | |
| AMDGT | 0.9565 0.9600 | 0.8843 | 0.8865 | 0.8714 | 0.9037 | |
| MTP-DDA | 0.9663 0.9681 | 0.9097 | 0.9095 | 0.9119 | 0.9072 |
| Paired Methods | AUC | AUPR | Accuracy |
|---|---|---|---|
| MTP-DDA vs DRHGCN | 2.743e-05 | 2.100e-03 | 4.246e-05 |
| MTP-DDA vs DRWBNCF | 2.157e-08 | 4.952e-07 | 4.296e-07 |
| MTP-DDA vs DRGBCN | 6.856e-08 | 6.826e-08 | 7.672e-07 |
| MTP-DDA vs SMGCL | 3.946e-07 | 1.964e-05 | 4.287e-07 |
| MTP-DDA vs DRAGNN | 1.000e-04 | 2.200e-03 | 1.100e-03 |
| MTP-DDA vs DRGCL | 6.000e-04 | 8.700e-03 | 4.700e-03 |
| MTP-DDA vs AMDGT | 7.000e-04 | 2.300e-03 | 8.389e-05 |
| Task | Model | AUC | AUPR |
|---|---|---|---|
| DDA | MTP-DDA (full model) | 0.9734 | 0.9730 |
| w/o attribute graph (G1) | 0.9675 | 0.9668 | |
| w/o GIP graph (G2) | 0.9691 | 0.9682 | |
| w/oG1 andG2 | 0.9497 | 0.9502 | |
| DPI | MTP-DDA (full model) | 0.9665 | 0.9681 |
| w/o attribute graph (G1) | 0.9529 | 0.9577 | |
| w/o GIP graph (G2) | 0.9631 | 0.9657 | |
| w/oG1 andG2 | 0.9463 | 0.9480 | |
| Loss | w/o contrastive loss (DDA) | 0.9719 | 0.9718 |
| w/o contrastive loss (DPI) | 0.9657 | 0.9663 |
| Task Framework AUC AUPR | Accuracy | F1 | Precision | Recall |
|---|---|---|---|---|
| DDASingle-task 0.9711 0.9685 | 0.8596 | 0.8359 | 0.9370 | 0.8001 |
| Multi-task 0.9734 0.9730 | 0.9185 | 0.9182 | 0.9233 | 0.9127 |
| DPI Single-task 0.9649 0.9654 | 0.9883 | 0.8803 | 0.9124 | 0.8732 |
| Multi-task 0.9665 0.9681 | 0.9030 | 0.9025 | 0.9068 | 0.8923 |
4.3 Parameter Analysis and Ablation Tests
Due to the limited exploration of DPA prediction task, parameter selection in this study is primarily based on the performance metrics of DDAs and DPI tasks. Specifically, parameter tuning experiments are conducted for the values of K in KNN method and the node feature dimension d. The value of K is tested within the range [5, 10, 15, 20, 25], while d is evaluated at [128, 256, 512]. It can be identified the optimal parameters for Cdataset as K = 15 and d = 256. For Fdataset, a similar parameter selection process is conducted, yielding optimal parameters of K = 10 and d = 256.
To comprehensively validate the importance of each component in MTP-DDA for enhancing model performance, a set of ablation experiments is conducted. By sequentially removing or replacing key modules within the framework, their respective contributions to the overall performance of MTP-DDA are systematically evaluated. For brevity, the ablation experiments in this section only present the results on the Cdataset.
Ablation Tests for Sub-Views
In the proposed framework, three views (G1, G2, and G3) are constructed, with G3 being the most comprehensive heterogeneous association view. To validate the roles of G1 and G2, ablation experiments are conducted, and the results are analyzed based on the performance metrics of DDAs and DPI prediction tasks. As listed in Table 5, the performance of MTP-DDA significantly decreases when either G1 or G2 is removed, and it reaches the lowest level when both G1 and G2 are removed simultaneously. This demonstrates that the inclusion of G1 and G2 plays a critical role in enhancing model performance, further confirming their necessity in the framework.
Ablation Tests for Graph Contrastive Learning
MTP-DDA constructs two corruption views based on the original G1 and G2 views. Then it employs GCN to extract node features from both original and perturbed views, followed by contrastive learning to obtain more discriminative node representations. To validate the effectiveness of the contrastive learning module, systematic ablation experiments are conducted, using AUC and AUPR as evaluation metrics for both DDAs and DPI prediction tasks. As listed in Table 5, eliminating contrastive learning module leads to performance degradation, confirming its crucial contribution to model enhancement.
Ablation Tests for Multi-Task Synergistic Effects
To validate the synergistic effects of DPI and DPA prediction tasks on DDAs prediction task, an ablation study is conducted. Specifically, the proposed multi-task framework is compared with an ablated version that solely focused on the DDAs prediction task, excluding the DPI and DPA prediction tasks. As listed in Table 6, full multi-task framework achieves superior performance in DDAs prediction task, with AUC and AUPR values of 0.9734 and 0.9730, respectively, compared to 0.9711 and 0.9685 for the ablated model. This highlights the effectiveness of multi-task learning in capturing the complex relationships among DDAs, DPI and DPA prediction tasks, and provides a promising approach for further improving DDAs prediction performance. Furthermore, using the same method, the comparison results of single-task and multi-task on DPI prediction task validate this as well, which can be found in Table 6.
5 Case Studies
To evaluate practical predictive capability of MTP-DDA, this study conducts in-depth case studies on breast cancer (BC) and lung cancer (LC), two cancer types lacking effective treatment options, using the Cdataset and Fdataset. During the model training phase, MTP-DDA utilizes all known drugdisease pairs for learning and subsequently predicts unobserved DDAs. The prediction results are ranked according to probability values, with higher-ranked drug-disease pairs considered to have greater interaction potential. To ensure the reliability of prediction results, this study strictly follows established validation protocols, integrating multiple authoritative data sources including the DB, the Comparative Toxicogenomics Database (CTD) [Davis et al., 2023], and the ClinicalTrials.gov, combined with relevant clinical trial results for comprehensive validation. This rigorous validation process effectively ensures the accuracy of prediction results.
BC is one of the most widely recognized malignant tumors affecting women and remains a significant health concern worldwide.
| Rank | Drugs (DrugBank ID) | Evidence |
|---|---|---|
| 1 | Dasatinib (DB01254) | CTD |
| 2 | Norethisterone (DB00717) | [Gu et al., 2022] |
| 3 | Prednisone (DB00635) | CTD |
| 4 | Cisplatin (DB00515) | DB, CTD |
| 5 | Levonorgestrel (DB00367) | ClinicalTrials.gov |
| 6 | Daunorubicin (DB00694) | [Niu et al., 2025] |
| 7 | Vincristine (DB00541) | DB, CTD |
| 8 | Cytarabine (DB00987) | CTD |
| 9 | Etoposide (DB00773) | [Sun et al., 2024] |
| 10 | Norgestimate (DB00957) | NA |
| 11 | Sodium bicarbonate (DB01390) | NA |
| 12 | Diethylstilbestrol (DB00255) | [Jia et al., 2025] |
| 13 | Dexamethasone (DB01234) | CTD |
| 14 | Teniposide (DB00444) | [Meng et al., 2024] |
| 15 | Ethinylestradiol (DB00977) | [Meng et al., 2022] |
| Rank | Drugs (DrugBank ID) | Evidence |
|---|---|---|
| 1 | Tamoxifen (DB00675) | CTD |
| 2 | Cisplatin (DB00515) | DB, CTD |
| 3 | Vincristine (DB00541) | DB, CTD |
| 4 | Sorafenib (DB00398) | [Zhao et al., 2025] |
| 5 | Tretinoin (DB00755) | ClinicalTrials.gov |
| 6 | Sunitinib (DB01268) | ClinicalTrials.gov |
| 7 | Fludarabine (DB01073) | ClinicalTrials.gov |
| 8 | Methotrexate (DB00563) | DB, CTD |
| 9 | Cladribine (DB00242) | CTD |
| 10 | Prednisone (DB00635) | NA |
| 11 | Docetaxel (DB01248) | DB, CTD |
| 12 | Methylprednisolone (DB00959) | ClinicalTrials.gov |
| 13 | Mercaptopurine (DB01033) | NA |
| 14 | Dacarbazine (DB00851) | ClinicalTrials.gov |
| 15 | Flutamide (DB00499) | NA |
Despite advances in treatment, identifying effective therapeutic agents for BC remains a critical challenge in medical research [Barzaman et al., 2020]. To validate the reliability of MTP-DDA, a case study focused on BC is conducted, aiming to identify potential drug candidates for BC treatment by leveraging the model's capability to predict new DDAs. From the predictions generated by MTP-DDA model, top 15 drug candidates that are predicted to be associated with BC are selected, which are listed in Table 7. Among these candidates, several drugs, such as Dasatinib, Cisplatin, and Vincristine, are supported by multiple evidence sources, including DB, CTD, and other computational models [Wang et al., 2021; Sun et al., 2024]. These results indicate that MTP-DDA model has reliability.
Notably, MTP-DDA also predicts several drugs with no previously reported evidence (marked as "NA"), such as Norgestimate, and Sodium bicarbonate. These predictions represent novel associations that have not yet been experimentally validated, highlighting the model's potential to uncover new therapeutic opportunities for BC. Taking the sodium bicarbonate as an example, Sodium bicarbonate, commonly known as baking soda, is widely used as an antacid to neutralize stomach acid and treat metabolic acidosis. Beyond its traditional uses, recent studies have suggested that sodium bicarbonate may play a role in cancer therapy by modulating the tumor microenvironment. Tumors often exhibit an acidic extracellular microenvironment due to increased glycolysis and lactate production. This acidic environment promotes tumor invasion, metastasis, and resistance to therapy [Eltanani et al., 2024]. Sodium bicarbonate, as an alkaline agent, can neutralize the acidic tumor microenvironment, thereby inhibiting these pro-tumor effects. Additionally, studies have shown that alkalinization of the tumor microenvironment by sodium bicarbonate can reduce the activity of proteases that are critical for tumor cell invasion and metastasis [Wang et al., 2021].
LC stands as a major contributor to global cancer-related deaths, with its complex pathogenesis and limited treatment options presenting ongoing challenges in oncology [Bade and Dela Cruz, 2020]. To explore the potential of MTP-DDA model in addressing this issue, a focused investigation into LC is undertaken. To be specific, MTP-DDA is employed to uncover previously unrecognized drug-disease relationships, with the goal of identifying promising therapeutic agents for LC. From the model's predictions, top 15 drug candidates with potential efficacy against LC are selected, which can be found in Table 8. These candidates are rigorously screened to remove any previously documented associations with LC, ensuring that the findings highlight entirely novel therapeutic possibilities. Of the top 15 predicted associations, 12 could be confirmed. For example, Cisplatin and Vincristine can be used in the treatment of LC, as evidenced by the DB and CTD. Sorafenib is also validated by RGLDR method, which indicates a strong association between Sorafenib and LC. However, there are 3 drugs predicted by MTP-DDA that are currently unproven. They require further validation.
Case studies demonstrate the effectiveness of the MTPDDA in accurately identifying potential DDAs.
6 Conclusion
Existing research predominantly focuses on single task, often overlooking the potential relationships between different tasks in improving model performance. To address this issue, a multi-task prediction framework is proposed, which is designed to simultaneously predict pairwise associations among drugs, diseases, and proteins. By constructing multiple views and leveraging advanced techniques, the framework effectively captures the complex relationships among these entities. Furthermore, the deep fusion of high-order and low-order features and the integration of multi-view features further enhance model's predictive performance. Tests conducted on public datasets show that the framework surpasses state-of-the-art methods.
Although MTP-DDA achieves better performance, it can still be further enhanced. Subsequent efforts will aim to expand dataset scale, incorporating additional biological data to improve prediction accuracy.
Ethical Statement
There are no ethical issues.
Acknowledgments
This work was supported in part by the National Natural Science Foundation of China under Grant No. 62473179 and the Shandong Province Social Science Programme Digital Shandong Research Project under Grant No. 24CSDJ05.
@inproceedings{ijcai2026p743,
  title     = {MTP-DDA: Enhanced Drug-Disease Associations Prediction via Multi-task Learning with Multi-view Graph Convolutional Networks and Contrastive Learning},
  author    = {Cui, Ming-Li and Jiao, Cui-Na and Ge, Dao-Hui and Zheng, Chun-Hou and Yang, Hui and Gao, Ying-Lian and Wang, Yan-Li and Liu, Jin-Xing},
  booktitle = {Proceedings of the Thirty-Fifth International Joint Conference on
               Artificial Intelligence, {IJCAI-26}},
  publisher = {International Joint Conferences on Artificial Intelligence Organization},
  editor    = {Diego Calvanese},
  pages     = {6680--6688},
  year      = {2026},
  month     = {8},
  note      = {AI and Health},
  doi       = {10.24963/ijcai.2026/743},
  url       = {https://doi.org/10.24963/ijcai.2026/743},
}
TY - CPAPER TI - MTP-DDA: Enhanced Drug-Disease Associations Prediction via Multi-task Learning with Multi-view Graph Convolutional Networks and Contrastive Learning AU - Cui, Ming-Li AU - Jiao, Cui-Na AU - Ge, Dao-Hui AU - Zheng, Chun-Hou AU - Yang, Hui AU - Gao, Ying-Lian AU - Wang, Yan-Li AU - Liu, Jin-Xing T2 - Proceedings of the Thirty-Fifth International Joint Conference on Artificial Intelligence, IJCAI-26 PB - International Joint Conferences on Artificial Intelligence Organization PY - 2026 SP - 6680 EP - 6688 DO - 10.24963/ijcai.2026/743 UR - https://doi.org/10.24963/ijcai.2026/743 ER -Copied
Machine-readable versions of this paper, for tools and AI agents:





