
Bridging the Data Scarcity in Venous Thromboembolism Detection: A Deep Learning Framework for Large-scale Irregular Clinical Time Series
Proceedings of the Thirty-Fifth International Joint Conference on Artificial Intelligence. AI4Tech: AI Enabling Technologies. Pages 6591-6599.
https://doi.org/10.24963/ijcai.2026/733
© 2026 International Joint Conferences on Artificial Intelligence
Keywords
- Advanced AI4Tech: Data-driven AI4Tech
- Domain-specific AI4Tech: AI4Care and AI4Health
- Advanced AI4Tech: Deep AI4Tech
- Domain-specific AI4Tech: AI4Biotech
Abstract
Venous thromboembolism (VTE) is a common and life-threatening complication in cancer patients after treatment. Early risk assessment and detection of VTE primarily rely on clinical indicators, such as blood test results. However, existing studies are limited to static or snapshot-based models, failing to capture the evolving dynamics of disease progression, as deep time-series modeling is hindered by the lack of longitudinal clinical data. To address this gap, we introduce CliTsVTE, a large-scale clinical time-series dataset curated for VTE modeling, comprising 501,063 samples from 26,022 patients over seven years across nine cancer types. The dataset contains continuous time gaps between consecutive time points. Unlike many benchmarks, CliTsVTE reflects real-world clinical settings and presents unique challenges in continuous irregular time-series modeling with long-term irregularity and varying data granularity, which makes missingness significantly consequential. To tackle this, we propose a deep learning framework integrating multiple sequential backbones with an adversarially regularized autoencoder (ARAE) that learns latent representations to eliminate missingness. Experiments on CliTsVTE show that our best model achieves 88.7% accuracy and an AUC of 0.952, significantly outperforming traditional time-point models and regular time-series benchmarks. These results establish a strong benchmark for deep modeling of continuous irregularity in clinical time-series data and highlight the potential of AI-driven large-scale clinical datasets in solving real-world medical research challenges.
- [Alexander et al., 2019] Marliese Alexander, David Ball, Benjamin Solomon, Michael MacManus, Renee Manser, Bernhard Riedel, David Westerman, Sue M. Evans, Rory Wolfe, and Kate Burbury. Dynamic thromboembolic risk modelling to target appropriate preventative strategies for patients with non-small cell lung cancer. Cancers, 11(1):50, 2019.
- [Breiman et al., 2017] Leo Breiman, Jerome Friedman, Richard A. Olshen, and Charles J. Stone. Classification and regression trees. Chapman and Hall/CRC, 2017.
- [Breiman, 2001] Leo Breiman. Random Forests. Machine Learning, 45(1):5-32, 2001.
- [Cho et al., 2014] Kyunghyun Cho, Bart van Merrienboer, Caglar Gulcehre, Dzmitry Bahdanau, Fethi Bougares, Holger Schwenk, and Yoshua Bengio. Learning phrase representations using rnn encoder-decoder for statistical machine translation. arXiv preprint arXiv.1406.1078, 2014.
- [Cortes and Vapnik, 1995] Corinna Cortes and Vladimir Vapnik. Support-vector networks. Machine Learning, 20(3):273-297, 1995.
- [Elman, 1990] Jeffrey L. Elman. Finding Structure in Time. Cognitive Science, 14(2):179-211, 1990.
- [Ferroni et al., 2017] Patrizia Ferroni, Fabio Massimo Zan- zotto, Noemi Scarpato, Silvia Riondino, Umberto Nanni, Mario Roselli, and Fiorella Guadagni. Risk assessment for venous thromboembolism in chemotherapy-treated ambu- latory cancer patients: A machine learning approach. Med- ical Decision Making, 37(2):234-242, 2017.
- [Grilz et al., 2021] Ella Grilz, Florian Posch, Stephan Nopp, Oliver Königsbrügge, Irene M Lang, Peter Klimek, Ste- fan Thurner, Ingrid Pabinger, and Cihan Ay. Relative risk of arterial and venous thromboembolism in persons with cancer vs. persons without cancer-a nationwide analysis. European Heart Journal, 42(23):2299-2307, 2021.
- [Guntupalli et al., 2023] Saketh R Guntupalli, Daniel Spinosa, Stephanie Wethington, Ramez Eskander, and Alok A Khorana. Prevention of venous thromboembolism in patients with cancer. BMJ, 381:e072715, 2023.
- [He et al., 2021] Lingxiao He, Lei Luo, Xiaoling Hou, Dengbin Liao, Ran Liu, Chaowei Ouyang, and Guanglin Wang. Predicting venous thromboembolism in hospital- ized trauma patients: a combination of the caprini score and data-driven machine learning model. BMC Emergency Medicine, 21(1):60, 2021.
- [He et al., 2022] Jiahao He, Qian Jiang, Yiting Yao, Yi Shen, Juan Li, Jianuo Yang, Ran Ma, Nuofu Zhang, and Chunli Liu. Blood cells and venous thromboembolism risk: a two- sample mendelian randomization study. Frontiers in Car- diovascular Medicine, 9:919640, 2022.
- [Hochreiter and Schmidhuber, 1997] Sepp Hochreiter and Jürgen Schmidhuber. Long Short-Term Memory. Neural Computation, 9(8):1735-1780, 1997.
- [Iglesias et al., 2023] Guillermo Iglesias, Edgar Talavera, Angel González-Prieto, Alberto Mozo, and Sandra Gómez-Canaval. Data Augmentation techniques in time series domain: a survey and taxonomy. Neural Computing and Applications, 35(14):10123-10145, 2023.
- [Jin et al., 2022] Shuai Jin, Dan Qin, Bao-Sheng Liang, Li- Chuan Zhang, Xiao-Xia Wei, Yu-Jie Wang, Bing Zhuang, Tong Zhang, Zhen-Peng Yang, and Yi-Wei Cao. Machine learning predicts cancer-associated deep vein thrombosis using clinically available variables. International Journal of Medical Informatics, 161:104733, 2022.
- [Kearon et al., 2022] Clive Kearon, Kerstin de Wit, Sameer Parpia, Sam Schulman, Frederick A. Spencer, Sangita Sharma, Marc Afilalo, Susan R. Kahn, Gregoire Le Gal, and Sudeep Shivakumar. Diagnosis of deep vein thrombo- sis with D-dimer adjusted to clinical probability: prospec- tive diagnostic management study. BMJ, 376, 2022.
- [Khorana et al., 2008] Alok A. Khorana, Nicole M. Kud- erer, Eva Culakova, Gary H. Lyman, and Charles W. Francis. Development and validation of a predictive model for chemotherapy-associated thrombosis. Blood, 111(10):4902-4907, May 2008.
- [Khorana et al., 2022] Alok A Khorana, Nigel Mackman, Anna Falanga, Ingrid Pabinger, Simon Noble, Walter Ageno, Florian Moik, and Agnes Y Y Lee. Cancer- associated venous thromboembolism. Nature Reviews Dis- ease Primers, 8(1):11, 2022.
- [Lee et al., 2017] Lai Heng Lee, Alexander Gallus, Ravul Jindal, Chen Wang, and Chau-Chung Wu. Incidence of venous thromboembolism in asian populations: A sys- tematic review. Journal of Thrombosis and Haemostasis, 117(12):2243-2260, 2017.
- [Lee et al., 2022] Yurim Lee, Eunji Jun, Jaehun Choi, and Heung-Il Suk. Multi-view integrative attention-based deep representation learning for irregular clinical time-series data. IEEE Journal of Biomedical and Health Informat- ics, 26(8):4270-4280, 2022.
- [Liu et al., 2021] Hua Liu, Hua Yuan, Yongmei Wang, Wei- wei Huang, Hui Xue, and Xiuying Zhang. Prediction of venous thromboembolism with machine learning tech- niques in young-middle-aged inpatients. Scientific Re- ports, 11(1):12868, 2021.
- [Makhzani et al., 2016] Alireza Makhzani, Jonathon Shlens, Navdeep Jaitly, Ian Goodfellow, and Brendan Frey. Ad- versarial Autoencoders. arXiv preprint arXiv.1511.05644, 2016.
- [McCullagh, 2019] Peter McCullagh. Generalized linear models. Routledge, 2019.
- [Mulder et al., 2021] Frits I. Mulder, Erzsébet Horvàth- Puhó, Nick van Es, H. W. M. Van Laarhoven, Lars Ped- ersen, Florian Moik, Cihan Ay, H. R. Büller, and H. T. Sørensen. Venous thromboembolism in cancer patients: A population-based cohort study. Blood, The Journal of the American Society of Hematology, 137(14):1959-1969, 2021.
- [Murariu-Gligor et al., 2025] Emma Eugenia Murariu- Gligor, Simona Mures , an, and Ovidiu Simion Cotoi. From cell interactions to bedside practice: complete blood count-derived biomarkers with diagnostic and prognostic potential in venous thromboembolism. Journal of Clinical Medicine, 14(1):205, 2025.
- [Nafee et al., 2020] Tarek Nafee, C. Michael Gibson, Ryan Travis, Megan K. Yee, Mathieu Kerneis, Gerald Chi, Fa- had AlKhalfan, Adrian F. Hernandez, Russell D. Hull, An- der T. Cohen, Robert A. Harrington, and Samuel Z. Gold- haber. Machine learning to predict venous thrombosis in acutely ill medical patients. Research and Practice in Thrombosis and Haemostasis, 4(2):230-237, 2020.
- [Nicholson et al., 2020] Matthew Nicholson, Noel Chan, Vinai Bhagirath, and Jeffrey Ginsberg. Prevention of ve- nous thromboembolism in 2020 and beyond. Journal of Clinical Medicine, 9(8):2467, 2020.
- [Park et al., 2021] Jung In Park, Doyub Kim, Jung-Ah Lee, Kai Zheng, and Alpesh Amin. Personalized risk prediction for 30-day readmissions with venous thromboembolism using machine learning. Journal of Nursing Scholarship, 53(3):278-287, 2021.
- [Posch et al., 2020] Florian Posch, Julia Riedl, Eva-Maria Reitter, Michael J. Crowther, Ella Grilz, Peter Quehen- berger, Bernd Jilma, Ingrid Pabinger, and Cihan Ay. Dy- namic assessment of venous thromboembolism risk in pa- tients with cancer by longitudinal d-dimer analysis: A prospective study. Journal of Thrombosis and Haemosta- sis, 18(6):1348-1356, 2020.
- [Qatawneh et al., 2019] Zelal Qatawneh, Mohammad Al- shraideh, Nada Almasri, Luay Tahat, and Abdullah Awidi. Clinical decision support system for venous thromboem- bolism risk classification. Applied Computing and Infor- matics, 15(1):12-18, 2019.
- [Rumelhart et al., 1986] David E. Rumelhart, Geoffrey E. Hinton, and Ronald J. Williams. Learning representations by back-propagating errors. Nature, 323(6088):533-536, 1986.
- [Shohat et al., 2023] Noam Shohat, Leanne Ludwick, Matthew B. Sherman, Yale Fillingham, and Javad Parvizi. Using machine learning to predict venous thromboem- bolism and major bleeding events following total joint arthroplasty. Scientific Reports, 13(1):2197, 2023.
- [Tang et al., 2022] Yan-Fen Tang, Yu Wang, Tian-Jiao Xue, Gang Liu, Qi Chen, Wen Zhao, Yan-Yan Liu, Rong-Qian Chen, Li Chen, and Jing Liu. Clinical Characteristics of HIV-Infected Patients with Venous Thromboembolism and Different CD4+ T Lymphocyte Levels. Journal of In- flammation Research, 15:613-620, 2022.
- [Tipirneni and Reddy, 2022] Sindhu Tipirneni and Chan- dan K. Reddy. Self-Supervised Transformer for Sparse and Irregularly Sampled Multivariate Clinical Time-Series. ACM Transactions on Knowledge Discovery from Data, 16(6):1-17, 2022.
- [Vaswani et al., 2017] Ashish Vaswani, Noam Shazeer, Niki Parmar, Jakob Uszkoreit, Llion Jones, Aidan N. Gomez, Lukasz Kaiser, and Illia Polosukhin. Attention is all you need. Advances in Neural Information Processing Sys- tems, 30, 2017.
- [Verso et al., 2012] Melina Verso, Giancarlo Agnelli, Sandro Barni, Giampietro Gasparini, and Roberto LaBianca. A modified Khorana risk assessment score for venous throm- boembolism in cancer patients receiving chemotherapy: the Protecht score. Internal and Emergency Medicine, 7(3):291-292, 2012.
- [Wang et al., 2024a] Ping Wang, Lin Zheng, Sheng Yan, Xuezhen Xuan, Yusi Yang, Xiaotong Qi, and Honglin Dong. Understanding the role of red blood cells in venous thromboembolism: A comprehensive review. The Ameri- can Journal of the Medical Sciences, 2024.
- [Wang et al., 2024b] Yihe Wang, Nan Huang, Taida Li, Yu- jun Yan, and Xiang Zhang. Medformer: A multi- granularity patching transformer for medical time-series classification. Advances in Neural Information Process- ing Systems, 37:36314-36341, 2024.
- [Wen et al., 2021] Qingsong Wen, Liang Sun, Fan Yang, Xi- aomin Song, Jingkun Gao, Xue Wang, and Huan Xu. Time series data augmentation for deep learning: A survey. In International Joint Conference on Artificial Intelligence, 2021. IJCAI
- [Zhang et al., 2023] Jiawen Zhang, Shun Zheng, Wei Cao, Jiang Bian, and Jia Li. Warpformer: A multi-scale mod- eling approach for irregular clinical time series. In ACM SIGKDD Conference on Knowledge Discovery and Data Mining, 2023.
- [Zhang et al., 2025] Weijia Zhang, Chenlong Yin, Hao Liu, and Hui Xiong. Unleashing the power of pre-trained lan- guage models for irregularly sampled time series. In ACM SIGKDD Conference on Knowledge Discovery and Data Mining, 2025.
- [Zhao et al., 2018] Junbo Zhao, Yoon Kim, Kelly Zhang, Alexander Rush, and Yann LeCun. Adversarially regu- larized autoencoders. In International Conference on Ma- chine Learning, 2018.
References were extracted automatically from the PDF and may contain errors.
Full text extracted automatically from the PDF; figures, tables and equations may differ. The PDF is the version of record.
1 Introduction
Venous thromboembolism (VTE) is a frequent and serious complication of cancer and its treatments [Mulder et al., 2021; Grilz et al., 2021]. Its incidence is markedly higher among cancer patients [Lee et al., 2017]. Beyond the acute thrombotic event, VTE contributes to post-thrombotic syndrome and significantly worsens overall survival [Khorana et al., 2022; Guntupalli et al., 2023]. Early and accurate identification of patients at risk is therefore essential, as it directly influences both prognosis and subsequent treatment decisions [Nicholson et al., 2020]. In clinical practice, VTE risk stratification remains largely dependent on the Khorana score [Khorana et al., 2008] and related heuristic systems [Verso et al., 2012], which capture only coarse, static risk factors. The approaches predominantly depend on static, timepoint blood test results [Kearon et al., 2022; He et al., 2022; Wang et al., 2024a], offering only a snapshot of patient status and neglecting the dynamic evolution of the disease. Recent efforts have attempted to incorporate time-series clinical data into machine learning frameworks [Posch et al., 2020; Alexander et al., 2019], yet their effectiveness is constrained by small cohorts, as it is challenging to obtain large-scale, long-term and fine-grained time-series datasets required for robust modeling of disease trajectories. As a result, existing models struggle to capture the evolving clinical patterns that herald VTE onset, leaving a critical gap in the development of effective real-time early-warning systems from clinical timeseries data.
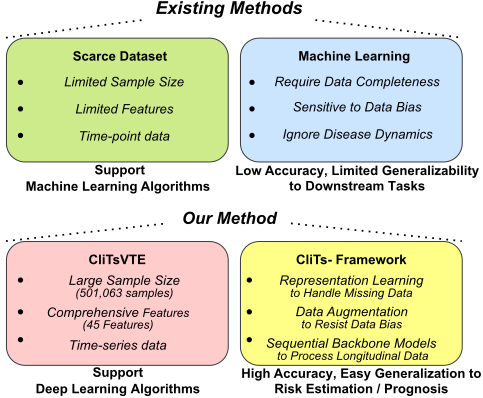
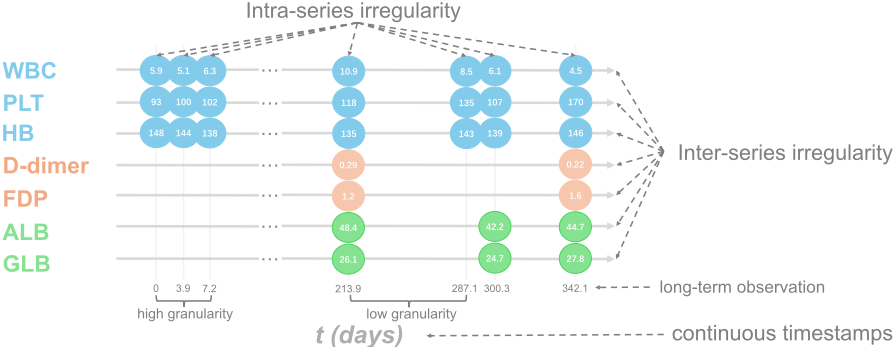
To fill the gap, we constructed a large-scale clinical timeseries dataset CliTsVTE, a longitudinal cohort of 26,022 patients for seven year of studies across nine cancer types, comprising 501,063 samples with 21 longitudinal and 24 static features. This dataset is specifically curated for dynamic VTE modeling. Due to disease incidence, the dataset contains significant distributional bias. Unlike typical time-series datasets, clinical time-series datasets exhibit both intra-series and inter-series irregularities. Due to the uncontrollable nature of patient visits for examinations, patient features are sampled at irregular time intervals. Additionally, the variability in the types of tests conducted during each visit results in different sampling rates for different features. Moreover, as shown in Fig. 2, CliTsVTE presents unique challenges with its long observation lengths and both high-granularity and low-granularity data. The same patient may undergo tests frequently during certain periods, while in other periods, tests may be conducted only once every few months. The unique data structure requires specialized handling.
The timestamps in CliTsVTE are continuous, which restricts the applicability of regular time-series models (e.g., Medformer [Wang et al., 2024b]) and discrete irregular timeseries models, such as ISTS-PLM [Zhang et al., 2025]. Existing methods [Lee et al., 2022; Tipirneni and Reddy, 2022; Zhang et al., 2023] attempt to model continuous irregular clinical time series either by converting irregularity to regularity or by learning the relationships between observations and time intervals. These methods have been validated on ICU records with short-term irregularities, where observation density is higher and irregularity is typically localized in time. The sampling gaps are generally small, and missing data can often be inferred from nearby observations in time. In contrast, CliTsVTE poses substantially greater challenges. It exhibits long-term continuous irregularity with varying data granularity. VTE detection, as a classification task, requires recognizing entire long-term time series, which makes data missingness far more consequential.
To address the challenges, we propose a deep learning framework equipped with novel representation learning and data augmentation modules for accurate VTE detection on large-scale irregular clinical time series. The representation learning module extracts essential information from inputs with missing data while preserving observed information, converting inputs into latent time series that eliminate missingness. Meanwhile, feature space data augmentation balances data classes to mitigate data bias introduced by longtail distributions. Experiments on CliTsVTE demonstrate that the proposed models remarkably outperforms existing timepoint and time-series methods, and the best model architecture achieves state-of-the-art performance with 88.7% accuracy and 0.952 AUC. We summarize our contributions as follows:
- We introduce a large-scale clinical dataset CliTsVTE for dynamic VTE studies. To the best of our knowledge, it will be the largest open-source clinical time series dataset available.
- We address continuous irregular time series, especially long-term time series with varying data granularity.
- We propose a deep learning framework that achieves precise VTE detection, and capable of providing early warnings of high VTE risk, which could be crucial for practical therapeutic intervention.
2 RelatedWorks
Several studies have explored machine learning for VTE risk estimation and detection, employing methods such as Multilayer Perceptron (MLP) [Qatawneh et al., 2019]. Nafee and his team [Nafee et al., 2020] compared 39 different machine learning algorithms with scoring systems in the task of VTE prediction, showing that ML models remarkably outperform scoring systems. Other studies [Park et al., 2021; He et al., 2021] compared most of the available ML algorithms and further demonstrated that combining ML mod- Lung Total Patient Num: 26022
Esophageal
Gastric
Pancreatic
4.8%
6.6%
1.3%
30.3%
Liver
7.1%
7.3%
7.5%
16.2%
Breast
18.9%
(a)
els with traditional scoring systems can achieve improved performance. Several studies have also highlighted the dynamic changes in patients with VTE [Posch et al., 2020; Alexander et al., 2019]. These studies primarily focused on analyzing specific blood features rather than detecting VTE. Although ML models often advance scoring systems, most existing research was based on small sample sizes, overlooking the data-volume advantage of clinical data. The scarcity of data has also constrained existing studies to traditional machine learning models and statistical approaches, preventing the effective utilization of more advanced deep learning algorithms. We propose a large-scale clinical time series dataset, CliTsVTE, to address this gap.
CliTsVTE presents long-term continuous irregularity. Existing studies on continuous irregular clinical time series can be broadly classified into two categories: (i) converting irregular time series to regular time series; (ii) learning joint relationships between observed values and time intervals. Warpformer [Zhang et al., 2023] modeled multi-scale irregularity via differentiable temporal warping and attention-based fusion, mapping irregular time intervals to calibrated positions. On the other hand, for methods that learn observationtime relationships, MIAM [Lee et al., 2022] integrated multiview signals (values, missingness, and time intervals) through attention, and STraTS [Tipirneni and Reddy, 2022] represented records as sets of triplets and improved robustness via self-supervised Transformer pretraining. These studies have largely focused on short-term irregularity, where sampling gaps are relatively limited and missing information can often be approximated from temporally adjacent observations. By comparison, CliTsVTE features long-term irregularity with varying data granularity, in which missingness becomes far more consequential due to larger time gaps and greater variability. Our proposed framework lies between the two categories, which converts a continuous irregular time series into a complete latent-space time series that is regularly sampled across features while irregular with respect to time.
3 CliTsVTE
We collected data from patients diagnosed with nine cancer types and received treatments at the institution from Jan 2017 to Jan 2024. These nine cancer types were selected based on their high incidence and mortality rates, including lung cancer, breast cancer, cervical cancer, liver cancer, rectal cancer, colon cancer, esophageal cancer, gastric cancer, and pancreatic cancer. Among the eligible cases, data were collected based on potential risk factors for VTE in previous related studies and clinical practice [Tang et al., 2022; Murariu-Gligor et al., 2025]. Each sample contained 21 blood test features, including Coagulation Tests (APTT, PT, TT, FIB, D-dimer, FDP), Complete Blood Count (WBC, PLT, Hb, NE, LYM, MONO), Liver Panel (ALB, GLB, GGT), Renal Panel (β2, CR), Immunology Panel (CD4, CD8, CD4/CD8), and other related features (LDH), along with the corresponding timestamp information. Additionally, each patient was associated with static features such as gender and blood type, and cancer types were encoded as one-hot vectors. The diagnosis of deep vein thrombosis (DVT) relied on vascular ultrasound examination or computed tomography angiography (CTA), while pulmonary embolism (PE) was diagnosed through computed tomography pulmonary angiography (CTPA) or enhanced computed tomography (CT) scan of the chest. All VTE diagnoses were confirmed by two experienced physicians to ensure accuracy. The final dataset included 501,063 samples from 26,022 patients with 21 longitudinal and 24 static features.
As shown in Fig. 3 (a), lung cancer represented the largest subgroup (30.3%), followed by breast cancer (18.9%) and cervical cancer (16.2%). Other cancers-including rectal (7.5%), colon (7.3%), liver (7.1%), esophageal (6.6%), and
Colon Rectal Cervical
6
5
4
3
| Feature | Overall (n = 26, 022) | Non VTE (n = 22, 573) | VTE (n = 3, 449) |
|---|---|---|---|
| Age Groups | |||
| < 20 | n = 27 | n = 25 | n = 2 |
| 20 - 40 | n = 1, 852 | n = 1, 708 | n = 144 |
| 40 - 60 | n = 14, 953 | n = 13, 400 | n = 1, 553 |
| > 60 | n = 9, 190 | n = 7, 440 | n = 1, 750 |
| Genders | |||
| Male | n = 11, 391 | n = 9, 753 | n = 1, 638 |
| Female | n = 14, 631 | n = 12, 820 | n = 1, 811 |
| Blood Types | |||
| A | n = 5, 748 | n = 5, 013 | n = 735 |
| B | n = 3, 912 | n = 3, 372 | n = 540 |
| AB | n = 1, 848 | n = 1, 600 | n = 248 |
| O | n = 5, 410 | n = 4, 741 | n = 669 |
| Unknown | n = 9, 104 | n = 7, 847 | n = 1, 257 |
| Body Factors | |||
| Height (cm) | 161.29 (±7.60) | 161.19 (±7.57) | 161.93 (±7.77) |
| Weight (kg) | 62.31 (±9.94) | 62.10 (±9.73) | 62.94 (±10.14) |
| BMI (kg/m2 ) | 23.90 (±3.26) | 23.87 (±3.19) | 23.99 (±3.44) |
| Blood Indicators | |||
| NE (109 /L) | 4.65 (±1.56) | 4.57 (±1.48) | 5.28 (±2.06) |
| LYM (109 /L) | 1.17 (±0.42) | 1.17 (±0.42) | 1.13 (±0.41) |
| MONO (109 /L) | 0.47 (±0.16) | 0.47 (±0.15) | 0.51 (±0.18) |
| WBC (109 /L) | 6.46 (±1.75) | 6.37 (±1.68) | 7.11 (±2.24) |
| PLT (109 /L) | 199.09 (±60.37) | 197.47 (±58.73) | 211.24 (±71.46) |
| Hb (g/dL) | 117.96 (±15.71) | 118.61 (±15.47) | 113.50 (±16.80) |
| APTT (s) | 26.87 (±2.28) | 26.85 (±2.22) | 27.08 (±2.78) |
| PT (s) | 11.16 (±0.79) | 11.11 (±0.75) | 11.43 (±1.00) |
| TT (s) | 16.55 (±0.79) | 16.57 (±0.76) | 16.40 (±0.98) |
| FIB (g/L) | 3.42 (±0.80) | 3.39 (±0.77) | 3.65 (±1.00) |
| D-dimer (mg/L/FEU) | 1.14 (±1.20) | 0.91 (±0.79) | 2.58 (±2.53) |
| FDP (mg/L) | 4.14 (±3.60) | 3.70 (±2.80) | 7.79 (±7.77) |
| ALB (g/L) | 39.99 (±4.03) | 40.35 (±3.87) | 37.59 (±4.24) |
| GLB (g/L) | 30.02 (±4.31) | 30.14 (±4.26) | 29.30 (±4.58) |
| GGT (U/L) | 47.89 (±48.64) | 46.48 (±46.68) | 57.78 (±60.85) |
| Beta2 (mg/L) | 2.58 (±0.81) | 2.54 (±0.77) | 2.83 (±0.98) |
| CR (umol/L) | 59.72 (±14.19) | 59.52 (±13.93) | 61.20 (±16.05) |
| CD4 (cells/µL) | 494.44 (±220.20) | 495.82 (±220.41) | 485.20 (±218.94) |
| CD8 (cells/µL) | 334.61 (±156.52) | 336.74 (±156.37) | 320.34 (±157.58) |
| CD4/CD8 Ratio | 1.64 (±0.75) | 1.63 (±0.74) | 1.72 (±0.83) |
| LDH (U/L) | 211.19 (±67.77) | 207.77 (±63.83) | 234.65 (±89.37) |
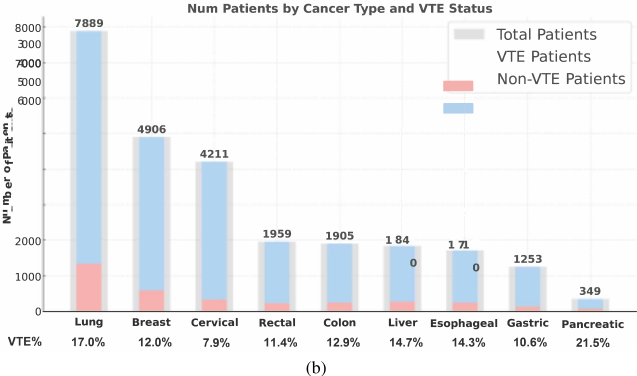
gastric cancer (4.8%)-each contributed moderate proportions, while pancreatic cancer accounted for the smallest share (1.3%). This distribution generally reflected the clinical incidence rate. As shown in Fig. 3 (b), lung cancer not only comprised the largest overall patient group but also contributed the second highest VTE rate at 17.0%. Whereas, pancreatic cancer had the highest VTE rate of 21.5% with the smallest number of patients. For other cancer types, VTE-positive and VTE-negative cases were clearly delineated, showing heterogeneity in thrombotic risk, ranging from 7.9% (cervical) to 14.7% (liver). The basic demographic and clinical characteristics of the study population are shown in Table 1. Among 26,022 patients, the VTE cohort (n = 3,449) showed a higher proportion of older individuals and a slightly higher BMI distribution. Several laboratory indicators, including neutrophil count, platelet count, D-dimer, FDP, gamma-glutamyl transferase (GGT), and Beta2, also exhibited elevated mean values in VTE patients compared with the non-VTE group.
A time series of a patient is recorded with irregular time intervals. The practical situation of clinical testing results in long-term irregularities with an average observation length (from the first observation to the last observation of a patient) of 330.50 days. The presence of high data sparsity necessitates specialized processing, which prevents off-theshelf models from being directly applied. To the best of our knowledge, CliTsVTE is the largest VTE time-series clinical dataset in terms of data volume, patient population, temporal coverage, and comprehensiveness of feature information.
Ethics is of paramount importance in our research. All sensitive information in the dataset was meticulously removed. Our study strictly adheres to the ethical principles outlined in the Declaration of Helsinki regarding the use of human subjects in medical research. The study has been reviewed and approved by Chongqing University Cancer Hospital's Ethics Committee (Approval Number -CZLS2023343-A).
4 ProblemFormulation
For each patient i, the corresponding data X(i) is described as X(i) = (x(i) sta , S (i) , y(i) ), where x(i) sta ∈ Rdsta is a vector representing the static features of the patient and y(i) ∈ {0, 1} indicates whether the subject i was diagnosed with VTE. Let S (i) = {(x(i) j , t(i) j )|t(i) j = cumulative time of oberseving x(i) j }j=0,1,...J (i) be the set of the time-series features of the patient i, where J (i) denotes the number of valid records for each patient i. We follow the independent and identically distributed (i.i.d.) assumption, where each patient is treated as independent from the others. Without loss of generality, the timestamp of the first record for each patient is set to t(i) 0 = 0, for all i, and t(i) j ∈ R+ for j = 1, ..., J (i) are continuous timestamps of subsequent records calculated as time elapsed since the first observation.
The dataset is then formulated as D = {X(i) }i=1,...,N, where N is the number of patients. The goal is to determine y(i) , given x(i) sta and S (i) .
5 Framework for Long-term Irregular Clinical Time Series
CliTsVTE presents unique challenges of modeling continuous irregularity with long-term observation lengths and varying data granularity. Large gaps between consecutive observations and substantial variability in feature values make missingness highly consequential. To guarantee more comprehensive information at each time point and undermine the impact of missingness, we map inputs to complete latent time series.
5.1 Representation Learning
Assuming that features across samples and time points follow the same distribution, it allows the model to learn representations that capture missing information. We employ an adversarially regularized autoencoder (ARAE) [Zhao et al., 2018; Makhzani et al., 2016] to regularize the latent space, aligning it with a predefined prior distribution through a discriminator. This regularization facilitates effective data augmentation directly in the latent space. Let z(i) j denote the latent representation generated by the encoder Φenc given the input x(i) j , and let ˆx(i) j represent the reconstruction produced by the decoder Φdec. The discriminator, denoted as Dψ, aims to distinguish between the learned representations z(i) j and synthetic representations ˆzm, where ˆzm ∼ p(ˆzm) is sampled from a predefined prior distribution. In our case, we align the latent representations with a Gaussian distribution N (0, I). According to the conventional framework for maximum likelihood estimation, the reconstruction process is optimized using the Mean Squared Error (MSE) loss, while the discriminator is trained using the Binary Cross-Entropy (BCE) loss.
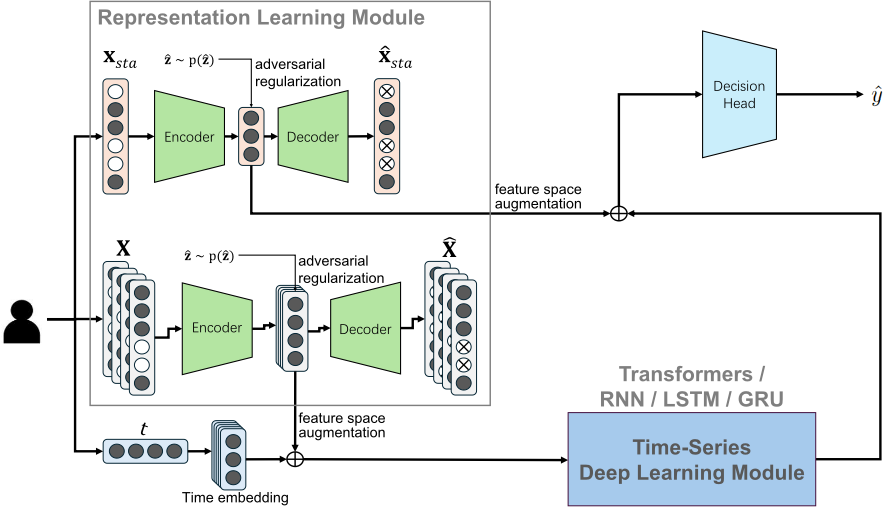
The reconstruction objective is not to recover the entire dataset but rather to minimize the reconstruction error specifically for the observed (known) entries. During the computation of losses, all missing entries are masked to ensure that they do not contribute to the loss calculation.
5.2 Feature Space Data Augmentation
With the regularized latent representation space, we perform data augmentation to balance the data classes. Unlike traditional data augmentation techniques, feature space augmentation operates directly on the latent representations. Drawing from various augmentation methodologies for time-series data [Wen et al., 2021; Iglesias et al., 2023], we implement four specific strategies: interpolation, random drop, random slice, and Gaussian noise addition. Each augmentation strategy is assigned an adjustable effectiveness probability and applied independently, allowing multiple methods to be combined on a single data sequence for richer latent space exploration.
5.3 Time-Series Module and Decision Head
To evaluate the performance of different backbone architectures, we implement four variations for the time-series module based on common sequence neural networks: Transformer [Vaswani et al., 2017], RNN [Elman, 1990], LSTM [Hochreiter and Schmidhuber, 1997], and GRU [Cho et al., 2014]. As we formulate the problem as a binary classification task, the objective function for VTE detection is optimized using the BCE loss.
Here, ˆ y represents the model's prediction. The final integrated model, which comprises the representation learning module, the data augmentation module, and the detection module, is optimized using a composite loss function.
| Models | Validation | Test | ||||||||
|---|---|---|---|---|---|---|---|---|---|---|
| AUC | Accuracy | F1-Score | Recall | Precision | AUC | Accuracy | F1-Score | Recall | Precision | |
| LR DT RF | 0.754 (±0.002) 0.808 (±0.002) 0.832 (±0.002) 0.845 (±0.002) | 0.694 (±0.002) 0.731 (±0.002) 0.752 (±0.001) 0.752 (±0.002) 0.773 (±0.002) | 0.684 (±0.002) 0.673 (±0.005) 0.714 (±0.002) 0.729 (±0.002) 0.766 (±0.003) 0.846 (±0.003) 0.845 (±0.001) | 0.662 (±0.002) 0.558 0.619 0.666 0.745 0.829 0.852 | 0.708 (±0.003) 0.860 0.843 0.805 0.791 0.864 0.839 0.881 | 0.790 (±0.002) 0.789 (±0.002) 0.804 (±0.002) 0.852 (±0.002) | 0.725 (±0.002) 0.717 0.728 0.767 0.767 0.836 | 0.721 (±0.002) 0.649 (±0.003) | 0.711 (±0.002) 0.525 (±0.008) 0.570 (±0.001) | 0.731 (±0.003) 0.860 (±0.010) |
| CliTsRNN | (±0.010) (±0.003) | (±0.008) (±0.003) | (±0.002) (±0.002) (±0.002) | 0.677 (±0.002) 0.748 (±0.002) | ||||||
| 0.834 (±0.004) | ||||||||||
| SVM | (±0.003) | (±0.003) | 0.693 (±0.002) | 0.814 (±0.003) | ||||||
| MLP | 0.857 (±0.002) | (±0.006) | (±0.005) | 0.858 (±0.002) | (±0.002) | 0.761 (±0.003) | 0.740 (±0.006) | 0.784 (±0.005) | ||
| MIAM | 0.925 (±0.001) | 0.849 (±0.002) | (±0.007) | (±0.005) | 0.918 (±0.002) | (±0.002) | 0.833 (±0.003) | 0.819 (±0.007) | 0.848 (±0.005) | |
| Warpformer | 0.923 (±0.001) | 0.843 (±0.001) | (±0.005) | (±0.004) | 0.936 (±0.002) | 0.852 (±0.002) | 0.853 (±0.002) | 0.862 (±0.005) | 0.847 (±0.003) | |
| Transformer | 0.919 (±0.002) | 0.839 (±0.003) | 0.830 (±0.003) | 0.786 (±0.008) | (±0.006) | 0.915 (±0.002) | 0.836 (±0.002) | 0.826 (±0.003) | 0.782 (±0.008) | 0.879 (±0.006) |
| RNN | 0.928 (±0.001) | 0.847 (±0.002) | 0.839 (±0.003) | 0.801 (±0.005) | 0.882 (±0.004) | 0.924 (±0.002) | 0.845 (±0.002) | 0.837 (±0.003) | 0.800 (±0.006) | 0.880 (±0.004) |
| LSTM | 0.926 (±0.002) | 0.847 (±0.002) | 0.839 (±0.003) | 0.799 (±0.005) | 0.885 (±0.004) | 0.922 (±0.002) | 0.842 (±0.002) | 0.834 (±0.002) | 0.793 (±0.005) | 0.880 (±0.004) |
| GRU | 0.934 (±0.001) | 0.855 (±0.002) | 0.847 (±0.003) | 0.803 (±0.006) | 0.896 (±0.004) | 0.934 (±0.001) | 0.856 (±0.002) | 0.848 (±0.002) | 0.806 (±0.005) | 0.897 (±0.004) |
| CliTsTransformer | 0.936 (±0.002) | 0.873 (±0.002) | 0.867 (±0.002) | 0.828 (±0.005) | 0.911 (±0.005) | 0.933 (±0.002) | 0.862 (±0.002) | 0.855 (±0.002) | 0.816 (±0.005) | 0.900 (±0.005) |
| 0.948 (±0.001) | 0.887 (±0.002) | 0.882 (±0.002) | 0.843 (±0.004) | 0.925 (±0.004) | 0.946 (±0.001) | 0.878 (±0.002) | 0.872 (±0.002) | 0.833 (±0.005) | 0.916 (±0.004) | |
| CliTsLSTM | 0.952 (±0.001) | 0.894 (±0.002) | 0.889 (±0.002) | 0.853 (±0.004) | 0.930 (±0.002) | 0.950 (±0.001) | 0.885 (±0.002) | 0.880 (±0.002) | 0.840 (±0.004) | 0.924 (±0.004) |
| CliTsGRU | 0.953 (±0.001) | 0.895 (±0.002) | 0.890 (±0.002) | 0.854 (±0.004) | 0.930 (±0.002) | 0.952 (±0.001) | 0.887 (±0.002) | 0.883 (±0.002) | 0.847 (±0.004) | 0.922 (±0.004) |
5.4 Implementation Details
Several implementation details are noteworthy in our approach. Specifically, the modules Φenc, Φdec, and Dψ were all implemented using multi-layer neural networks. Time embeddings were encoded as sin/cos positional encoding and concatenated with zj following the data augmentation process to incorporate temporal information. The static features xsta were processed through a separate ARAE, to mitigate the impact of missing data. The resulting representations of static features were concatenated with the output of the time-series module before being passed to the decision head. Moreover, a two-stage training strategy was employed. In the first stage, the representation learning module was pre-trained. During the pre-training phase of the ARAE, the discriminator and the representation network were trained alternately, following the standard adversarial learning paradigm. In the second stage, when training the integrated model, the discriminator network was frozen to ensure stability.
6 Experiments
6.1 VTE Detection with Large-Scale Time-Series Data
To validate model performance, from related VTE studies [Ferroni et al., 2017; Nafee et al., 2020; Shohat et al., 2023; Liu et al., 2021; Jin et al., 2022], we identified five commonly discussed machine learning algorithms as our timepoint model benchmarks with the latest longitudinal features, namely Logistic Regression (LR [McCullagh, 2019]), Decision Trees (DT [Breiman et al., 2017]), Random Forests (RF [Breiman, 2001]), Support Vector Machines (SVM [Cortes and Vapnik, 1995]), and Multi-Layer Perceptrons (MLP [Rumelhart et al., 1986]). The performance of the models was assessed using key evaluation metrics, including AUC, accuracy, F1-score, recall, and precision. We divided the dataset into training, validation, and test sets at a 0.7/0.15/0.15 ratio at the patient level.
The results are summarized in Table 2. Among the timepoint models, MLP achieved the best performance with an AUC of 0.858 and an accuracy of 0.767, while the logistic regression model and decision tree performed worse, showing limited recall and unstable results. In contrast, the timeseries models achieved a substantial performance improvement across all metrics, demonstrating the advantage of incorporating longitudinal clinical dynamics. All of the timeseries benchmark models achieved AUCs exceeding 0.9, significantly outperforming all time-point models.
6.2 Learning Complete Latent Series
We compared the proposed framework to existing methods on continuous irregular time series [Lee et al., 2022; Zhang et al., 2023] and the backbone time-series models without the representation learning and augmentation modules. For the baseline models, zero imputation was employed to address missing entries. As shown in Table 2, Warpformer performed moderately on the validation set, with an AUC of 0.923 and accuracy of 0.843, but showed better generalization on the test set, achieving an AUC of 0.936 and accuracy of 0.852. Among backbone models, the GRU model maintained high performance on both the validation set (AUC 0.934 and accuracy 0.855) and the test set (AUC 0.934 and accuracy 0.856).
Models with our proposed framework (CliTsTransformer, CliTsRNN, CliTsLSTM, and CliTsGRU) achieved a further breakthrough, with CliTsGRU reaching the best AUC of 0.953 ± 0.001 and accuracy of 0.895 ± 0.002 on the validation set, as well as 0.952 ± 0.001 and 0.887 ± 0.002, respectively, on the test set. CliTsGRU maintained high precision (0.922) and recall (0.847) on test set, indicating its strong capability to generalize across unseen data while effectively capturing the temporal dependencies crucial for VTE detection. These results were statistically superior to all baselines (p < 0.01), highlighting both the robustness and generalization of the model. We attribute this to that our framework effectively handles irregular trajectories by learning complete latent representations.
6.3 Monitoring of VTE Risk Over Time
To approximate a real-world clinical setting, where VTE risk is dynamically updated as new clinical data become available, Alarm trigger we simulated a sequential prediction process in which the model computed a VTE risk score at each time point using all historical records up to that moment. As shown in Fig. 5 (a), the predicted VTE scores for affected patients maintained high values throughout the observation period, whereas the scores for non-VTE patients progressively declined. The median predictive score of VTE patients concentrated close to 1.0, resulting in the deep red color at the top of Fig. 5 (a), evidencing the model's certainty of identifying high VTE risk. As time progresses, the model's ability to distinguish between the two populations became progressively stronger. These temporal patterns aligned with known clinical observations that thromboembolic events often follow major physiological stressors such as surgery, chemotherapy, or targeted therapy [Mulder et al., 2021].
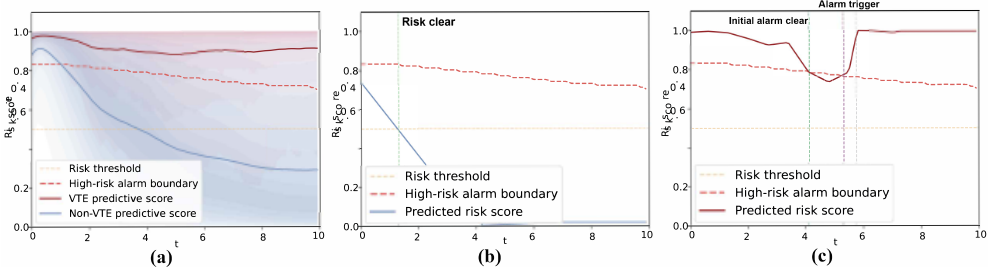
The consistent high level of predicted scores prior to clinical diagnosis suggested that the proposed model not only identified high-risk individuals but also enabled presymptomatic monitoring of thrombotic progression. We determined a high risk alarm boundary as the optimal separation boundary of VTE and non-VTE risk scores (Fig. 5 (a)), computed using SVM. Fig. 5 (b)(c) demonstrate the predictive risk scores for individual patient samples. For non-VTE samples, the risk curve consistently declined. Importantly, for VTE patients, the alarm triggers for high-risk boundaries occurred earlier than the actual diagnosis, indicating that the alarm system is proactive in identifying potential risks before clinical confirmation. This suggested that the systemmay be effective in providing early warnings for VTE patients, which could be crucial for timely intervention.
7 Conclusions
In this study, we seek to bridge the gap caused by the scarcity of large-scale time-series datasets in cancer associated VTE research. We introduce CliTsVTE, comprising over 500,000 samples from more than 26,000 patients spanning seven years across nine cancer types, for VTE detection and analysis. Each patient is associated with static features and a time series of 21 key features of blood test, providing comprehensive information on the dynamic characteristics of the subject. Experiments results evidence the potency of CliTsVTE.
Along with the dataset, we propose a deep learning framework, CliTs-, to address the problems of long-term continuous irregularity and varying data granularity presented in CliTsVTE. The model integrates representation learning and feature-space data augmentation modules. The representation learning module plays a crucial role in fusing features from the entire dataset and encodes vital information into complete latent time-series representations and undermine the impact of data missingness. The integrated CliTsGRU model achieved state-of-the-art performance, with an AUC of 0.952 and an accuracy of 88.7%, significantly outperforming all benchmark models. The results support the potential application of CliTs- as a benchmark for dynamic VTE detection.
However, several limitations must be acknowledged in this study. CliTsVTE may introduce bias due to the specific patient population and region. The proposed models serves as benchmarks to address the challenges in the dataset rather than making definitive diagnoses. It provides a possible pathway for dataset processing and dynamic VTE studies. Future research could focus on developing model architecture to support individualized treatments, as well as investigating treatment effects and conducting detailed pathological analysis.
Nonetheless, CliTsVTE provides a strong data foundation for applying advanced deep learning methods to dynamic VTE studies. It demonstrates the power of clinical data, particularly the advantages derived from large sample sizes and longitudinal data structures. Our method offers a framework for effectively managing the challenges of working with clinical data and continuous irregular time series. Our work highlights the potential of clinical data as a valuable resource for deep learning applications. We envision that future research will unlock even greater potential for clinical datasets, ultimately contributing to the advancement of medical science.
8 Data and Code Availability
The full dataset is available on request and will be opensourced on Kaggle with formal publication. All source code is available at https://github.com/CanXu0728/CliTs pub.
Ethical Statement
We strictly adheres to the ethical principles outlined in the Declaration of Helsinki. The study has been reviewed and approved by Chongqing University Cancer Hospital's Ethics Committee (Approval Number -CZLS2023343-A).
Acknowledgments
We thank the anonymous reviewer for his/her helpful comments on an earlier draft of the paper. We thank the clinicians at Chongqing University Cancer Hospital for their assistance in data annotation and validation.
Contribution Statement
Authors Can Xu and Runze Yang contributed equally to this work. Authors Haike Lei and Jie Yang are correspinding authers.
@inproceedings{ijcai2026p733,
  title     = {Bridging the Data Scarcity in Venous Thromboembolism Detection: A Deep Learning Framework for Large-scale Irregular Clinical Time Series},
  author    = {Xu, Can and Yang, Runze and Xiang, Xinni and Wu, Yongtao and Huang, Yaqin and Lei, Haike and Yang, Jie},
  booktitle = {Proceedings of the Thirty-Fifth International Joint Conference on
               Artificial Intelligence, {IJCAI-26}},
  publisher = {International Joint Conferences on Artificial Intelligence Organization},
  editor    = {Diego Calvanese},
  pages     = {6591--6599},
  year      = {2026},
  month     = {8},
  note      = {AI4Tech: AI Enabling Technologies},
  doi       = {10.24963/ijcai.2026/733},
  url       = {https://doi.org/10.24963/ijcai.2026/733},
}
TY - CPAPER TI - Bridging the Data Scarcity in Venous Thromboembolism Detection: A Deep Learning Framework for Large-scale Irregular Clinical Time Series AU - Xu, Can AU - Yang, Runze AU - Xiang, Xinni AU - Wu, Yongtao AU - Huang, Yaqin AU - Lei, Haike AU - Yang, Jie T2 - Proceedings of the Thirty-Fifth International Joint Conference on Artificial Intelligence, IJCAI-26 PB - International Joint Conferences on Artificial Intelligence Organization PY - 2026 SP - 6591 EP - 6599 DO - 10.24963/ijcai.2026/733 UR - https://doi.org/10.24963/ijcai.2026/733 ER -Copied
Machine-readable versions of this paper, for tools and AI agents:





